Giter Club home page Giter Club logo

grafana-sunandmoon-datasource's Introduction

Build Status Coverage Status

Sun and Moon Datasource Plugin for Grafana

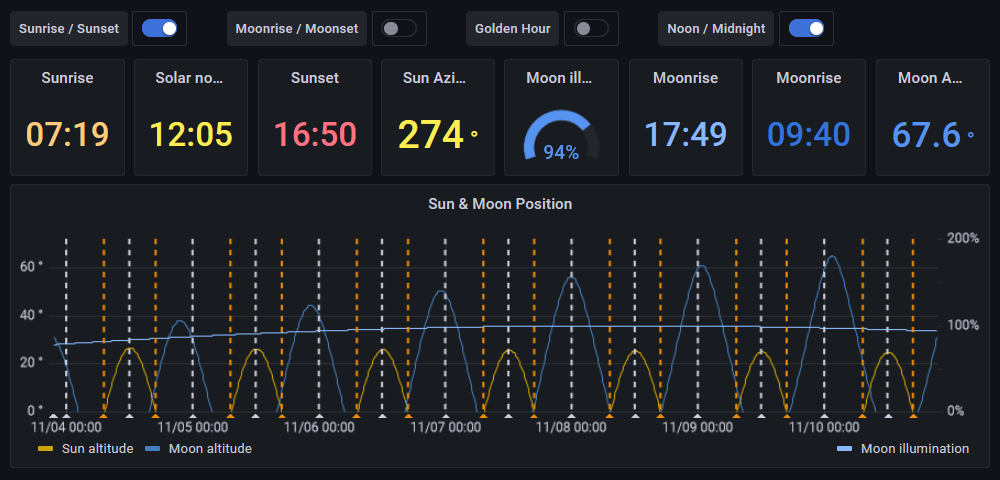
SunAndMoon is a Datasource Plugin for Grafana that calculates the position of Sun and Moon as well as the Moon illumination using SunCalc.

Additionally it provides annotations for sunrise, sunset, twilight, moonrise, moonset and others.

SunAndMoon

Configuration

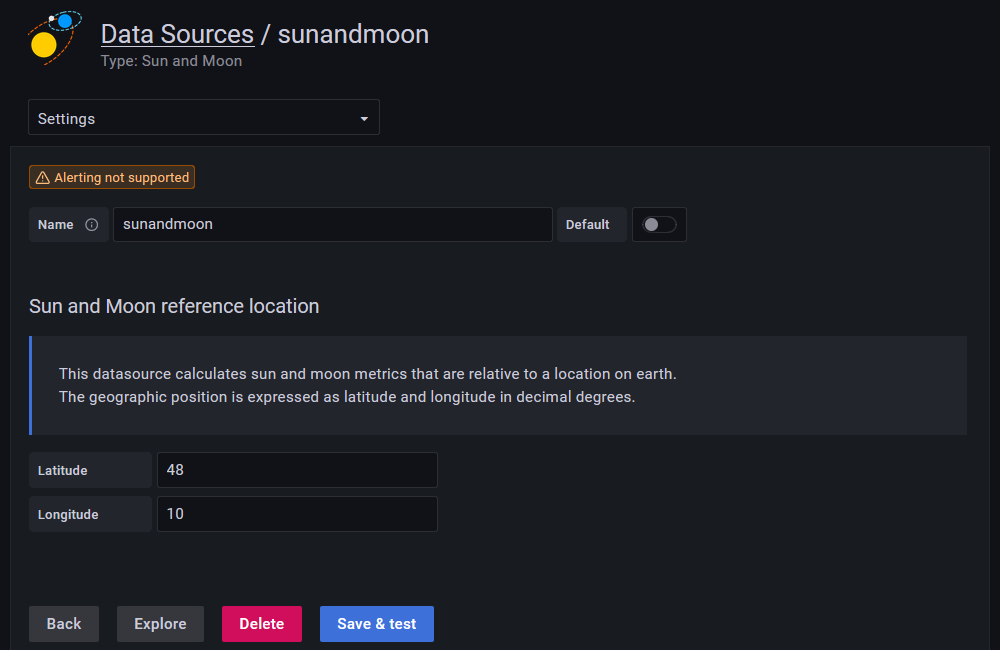
All values are location dependent, the reference location needs to be configured in the datasource settings.

SunAndMoon Configuration

License

This projected is licensed under the terms of the MIT license.

grafana-sunandmoon-datasource's People

Contributors

daniellee avatar fetzerch avatar torkelo avatar twam avatar

Stargazers

 avatar  avatar  avatar  avatar  avatar  avatar  avatar  avatar  avatar  avatar  avatar  avatar  avatar  avatar  avatar  avatar  avatar  avatar  avatar  avatar  avatar  avatar  avatar  avatar  avatar  avatar  avatar  avatar  avatar  avatar  avatar  avatar  avatar  avatar  avatar  avatar  avatar  avatar  avatar  avatar

Watchers

 avatar  avatar  avatar  avatar

grafana-sunandmoon-datasource's Issues

Does not work in public dashboards

Is there any chance we can get the plugin working in public dashboards (i know that the plugin is a data source that is unsupported for public dashboards)?

It gets back with "[plugin.unavailable]" or as a popup: "Internal server error".
Grafana v10.0.3

Moonphase

Hi,
thank you for this cool plugin, but I cannot find the moonphase (which Suncalc supports) :-(

updating to grafana 11 - sun and moon plugin broken.....

Hi,

after udating to Grafana 11 the sun and moon plugin is no longer working.
Had to downgrade to 10.4.3 to get it working again.
Could you ave a look on that, urgenty needed plugin for all solar guys who uses grafana to monitor their PV installations! :-)

Thanks in advance.

Regards,

Christian

Unexpected Error with Grafana v7.3.7

After updating my Grafana Docker und Update to the latest Version of sunandmoon i recognized a problem. The plugins is working but if i click in the menu Datasources on Sun and Moon i got the following Error:

An unexpected error happened
Error: Minified React error #130; visit https://reactjs.org/docs/error-decoder.html?invariant=130&args[]=undefined&args[]= for the full message or use the non-minified dev environment for full errors and additional helpful warnings.

in div
in div
in n
in div
in t
in form
in div
in div
in t
in div
in div
in div
in t
in t
in div
in t
in t
in x
in ConnectWithCleanUp(Connect(t))
in r
in Unknown
in t
in Unknown
in h
in Unknown
in Unknown
in t
in t
in l

I also have an Error in my Panel:

An unexpected error happened
Error: Minified React error #130; visit https://reactjs.org/docs/error-decoder.html?invariant=130&args[]=undefined&args[]= for the full message or use the non-minified dev environment for full errors and additional helpful warnings.

in div
in div
in n
in t
in t
in div
in div
in div
in QueryOperationRow
in div
in t
in t
in div
in div
in div
in div
in div
in t
in t
in t
in div
in Ma
in div
in an
in div
in div
in t
in div
in t
in div
in t
in div
in t
in div
in div
in t
in x
in div
in t
in x
in r
in Unknown
in t
in Unknown
in h
in Unknown
in Unknown
in t
in t
in l

I also tried to deinstall the plugin via cli und reinstall it but got the same behavior.

passing a template variable to the data source would be nice

Currently latitude and longitude are defined at the datasource level, so it's not possible to change them dynamically using user input.
For instance, I'd like to combine this datasource with the worldmap:

  • the user selects a location
  • a map shows the location (worldmap panel)
  • a graph shows daylight information (sunandmoon datasource)

"couldn't find a query runner that matches supplied arguments"

I was hoping to use sunrise and sunset times in my solar energy dashboard to scale the daily graphs to be sunrise-1h to sunset+1hr but when trying to read sunrise and sunset into dashboard variables I get the above error.
I'm no grafana expert by a long shot, but I assume that assigning variables through query is just not implemented in this module?

Compatible with Grafana 4.0.1?

Is the plugin tested with Grafana v4.0.1?
I have been unsuccessful with this setup, but it's my first time using the plugin, so I might be doing something wrong.

I installed it. Added a Data source and specified coordinates. Then I tried making a new panel (graph) and add sun_altitude, but nothing happens. Have I missed something?

Grafana 8

Hi, thank you for your nice plugin!
Since upgrade to grafana 8 I cannot select the "channels" from the datasource anymore. Exiting panels work as expected.
Also the configuration page is missing the location input possibility.
It would be very nice if you could fix this, perhaps it is only a minor problem.

plugin not working with grafana v6.3.0-beta2 (commit: c8740d9)

I've recently updated to grafana v6.30-beta2 on Debian Bullseye using the https://packages.grafana.com/oss/deb beta repo. The installed sun-and-moon plugin is version 0.1.4. Prior to the update the sun-and-moon plugin was working flawlessly. I now get an error for the sun-and-moon panel. The error displayed in the left corner of the panel is:

e.query(...).then is not a function

I can provide more information if it will help troubleshoot if I can be directed to where it might be located.

Messed up graphics

EXPECTED: Sun altitude curve to follow values
REALITY: Curve not following values
When doing certain actions view gets back to normal. (Actions for example: settings: transparant slider off and on again, changing timepicker, sometimes refresh works but not always...)
Grafana-version is Grafana v7.1.3 .
In pictures white filled curve is sun altitude, Both metrics are on different axes.
notok
ok

Overriding the datasource location

Feature request: I use this great plugin to enhance the HVAC graphs of our data centers, but since they are located at very different latitudes I need to be able to override the global datasource location at least per dashboard (even better: per panel).

Extend dashboard query with 'Alias' field

Hi,
This is a really useful Plugin for PV-Monitoring!
Would it be possible to give the user the option to rename Series, like the "Alias by" field does it with InfluxDB?
I know that this isn't a key feature, but it would be very useful, especially if you want to create dashboards that should be understandable for people not speaking English.

Option to not show negative altitude values

I would like an option to not show negative degrees for altitude values. I know I can set the min to zero, however on a dual axis with an inverted graph the zero's don't line up putting the sun line on the bottom instead of above the middle.

I want this, but no visuals below zero:
image

This is not right because the sun is not in the middle:
image

How to show Sunrise (as a curve) ?

hi,
as the plugin is now working for me, i thought to show the sunrise and the sunset as an overlay to my light/lux-data. I managed to get the mixed datasource, but as far as i see/understand: there is no sunset available. am i right?

i checked the suncalc repo at github, and there is a table that has this values.

โ“
are they available at your plugin?
Or is the "altitude" the rise of sun and moon?
can anybody give me a hint to show them up on grafana?

zwischenablage02

Elevation not used in calculations

Sun and moon positions are (to a greater or lesser extent) dependent on elevation as well as latitude/longitude. The suncalc library used accepts an optional height parameter, defaulting to the geodetic surface.

It would be useful if this plugin could additionally store and use an elevation parameter (or estimate it from an elevation model) for more accurate calculations.

Sunrise and sunset per panel option

I use the plugin to display sunrise and sunset on the power day plot generated by a solar plant. Unfortunately the annotations are displayed on all panels of the dashboards messing up monthly and yearly data plots. Is there a way to control the annotations on a per panel basis?

image

Currently this looks ugly and I cannot leave it like this (have to disable the sun and moon plugin if I cannot find a solution)

Plugin fails to load with Grafana 8.0 (403 Forbidden Instantiating / no installed plugin with that id)

I have installed per cli in docker on Grafana 8.0.6

On plugins the plugin doesn't start, its hangs on loading.
on data source under sun and moon there comes

Fetch error: 403 Forbidden Instantiating http://192.168.69.2:3000/public/plugins/fetzerch-sunandmoon-datasource/module.js Loading plugins/fetzerch-sunandmoon-datasource/module

if I click on delete data source there is
Missing valid datasource id

if I uninstall the plugin, the datasource is still there but I can't delete it, because auf missing id

Maximum sun altitude

Would it be possible to add a 'maximum sun altitude of the day' as a value?

Background:

I want to plot the daily yields of my PV together with that maximum sun altitude of that day for a complete year. My first idea was to just calculate the max of the provided values for that day, but by default Grafana sets the interval of this plot to 3h โ€“ so there might be a good chance to miss the actual maximum value. Also it feels kinda wrong to generate/calculate lots of values (to be sure to have the maximum value in the data) and then just search for the maximum.

If you have a better solution instead of adding another value, I'm open to suggestions.

Convert to backend plugin to support Expressions and Alerting

Hi!
Grafana fails to load data when I use Sun And Moon datasource and Math expression on single graph. It fails every single time even if the expression do not reference Sun And Moon data. I tried simple expression like "$A" but the server returns 500:
Screenshot from 2022-11-03 08-50-00
Not sure what root cause is.

Server log:
grafana.log

Grafana version: 8.0.2
Plugin version: 0.2.1

Recommend Projects

  • React photo React

    A declarative, efficient, and flexible JavaScript library for building user interfaces.

  • Vue.js photo Vue.js

    ๐Ÿ–– Vue.js is a progressive, incrementally-adoptable JavaScript framework for building UI on the web.

  • Typescript photo Typescript

    TypeScript is a superset of JavaScript that compiles to clean JavaScript output.

  • TensorFlow photo TensorFlow

    An Open Source Machine Learning Framework for Everyone

  • Django photo Django

    The Web framework for perfectionists with deadlines.

  • D3 photo D3

    Bring data to life with SVG, Canvas and HTML. ๐Ÿ“Š๐Ÿ“ˆ๐ŸŽ‰

Recommend Topics

  • javascript

    JavaScript (JS) is a lightweight interpreted programming language with first-class functions.

  • web

    Some thing interesting about web. New door for the world.

  • server

    A server is a program made to process requests and deliver data to clients.

  • Machine learning

    Machine learning is a way of modeling and interpreting data that allows a piece of software to respond intelligently.

  • Game

    Some thing interesting about game, make everyone happy.

Recommend Org

  • Facebook photo Facebook

    We are working to build community through open source technology. NB: members must have two-factor auth.

  • Microsoft photo Microsoft

    Open source projects and samples from Microsoft.

  • Google photo Google

    Google โค๏ธ Open Source for everyone.

  • D3 photo D3

    Data-Driven Documents codes.