exoclim / aeolus Goto Github PK
View Code? Open in Web Editor NEWAnalysis and visualisation of atmospheric model output powered by iris.
Home Page: https://exoclim.github.io/aeolus
License: GNU Lesser General Public License v3.0
Analysis and visualisation of atmospheric model output powered by iris.
Home Page: https://exoclim.github.io/aeolus
License: GNU Lesser General Public License v3.0


![pre-commit-ci[bot] avatar](https://avatars.githubusercontent.com/in/68672?v=4 "pre-commit-ci[bot]")


@mzamyatina please add a test for each of the functions in synthobs.py and some examples.
test_read_spectral_bands()test_read_normalized_stellar_flux()test_calc_stellar_flux()test_calc_transmission_spectrum_day_night_average()examples/03_Transmission_Spectrum.ipynbaeolus.coord.regrid_3d() fails if dimensional coordinates have slightly different metadata, e.g. var_name, even if the rest of the metadata is the same. The error comes from a supporting function, aeolus.coord.not_equal_coord_axes().
A temporary workaround is to fix or remove the offending attributes, e.g.
for cube in [cube1, cube2]:
    for coord_name in [um.z, um.y, um.x]:
cube.coord(coord_name).var_name = coord_name # or NoneMake the API more flexible: use plain class instead of a dataclass to be able to add/inherit constants dynamically?
As discussed with @mzamyatina, there's a bug in the calculation of the day-night average of the transmission flux, output by the UM. Currently, the averaging function makes one of the flux arrays (e.g. day) mismatch the other (e.g. night), making the average flux higher than individual (day- or night-only) fluxes.
Possible solutions are either
Add __repr__, __str__, _repr_html_ to core.Run and other major classes.
Use the new features in cartopy 0.18 for labelling grid lines
Search doesn't work
While I am trying to run aeolus for generating transmission spectra for UM output (Stash code = 1755), I get the following error while calling calc_transmission_spectrum function :
'''
ValueError: Insufficient matching coordinate metadata to resolve cubes, cannot map dimension (0,) of the RHS cube ((260,), 'stellar_flux') to the LHS cube ((260,), 'Stash code = 1755')
'''
The dimensions of stellar flux and planet_transmn variables are (260,) and (260, 90, 144) respectively.
The file is attached for reference.
Add more example Notebooks...
Would be nice to keep the information about the width of spectral bands used in transmission spectrum calculations.
Currently this information is lost in places like this.
aeolus.synthobs.calc_transmission_spectrum_day_night_average() calculates the average transmission spectrum over the dayside and the nighside. If there is interest in the contribution of the dayside or the nightside to the average spectrum, a separate function is needed.
Make a dictionary of UM-specific variable and coordinate names
Upload to anaconda cloud and pypi
Tag version
Is there a way that I can get data for other exoplanets in the same format as the "planet_transmission_day.nc" and "sp_sw_500ir_bd_hatp11" files? My goal is to try to find a simple way so that I can identify signatures of different molecules in planet atmospheres using the transmission spectrum. The Lines et al. (2018) paper that was mentioned on the synthetic observations page uses a graph for figure 3 in the results section and I'd like to see if I can do something similar.
Thank you for any help you may be able to provide!
Move the functions from lfric_exo_bench_code
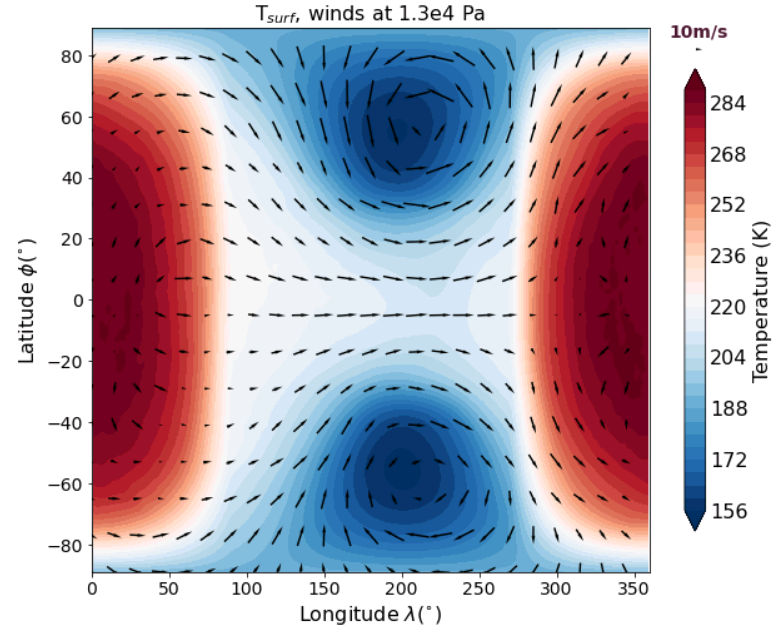
In plotting the transformed wind vectors (not using the divergent component) in tidally-locked coordinates, I can notice some misaligned wind vectors between the two coordinate systems, especially over the gyres. In the first image using geographical coordinates, we can see the gyre structure clearly in the winds. After doing the coordinate transformations and rotating the winds, the second image shows the disappearing of one of the gyre structures. I am currently struggling to find the cause of this. The coordinate transformations rely on the aeolus operations 'rotate_winds_to_tidally_locked_coordinates' and 'regrid_to_tidally_locked_coordinates', and a script to reproduce these plot can be found below. The NetCDF file to test the script can be downloaded from https://github.com/marrickb/netcdf_files.

import iris
import warnings
import numpy as np
import matplotlib.pyplot as plt
import aeolus

import iris
import warnings
import numpy as np
import matplotlib.pyplot as plt
import aeolus

from iris.analysis.cartography import _meshgrid, rotate_pole, rotate_winds

from aeolus.coord import get_xy_coords
from aeolus.calc.tl import regrid_to_tidally_locked_coordinates, regrid_to_rotated_pole_coordinates, rotate_winds_to_tidally_locked_coordinates
from aeolus.calc.stats import spatial
from aeolus.const import init_const
pcb_const=init_const('proxb')
warnings.filterwarnings("ignore")

pcb_2d = iris.load('pcb_winds_2d.nc')

def regrid_cubelist(cubes):
    for cube in cubes:
        if cube.standard_name == 'eastward_wind':
            x_wind = cube[:,:].copy()
        if cube.standard_name == 'northward_wind':
            y_wind = cube[:,:].copy()
        if cube.standard_name == 'surface_temperature':
            tsurf = cube[:,:].copy()
        if cube.standard_name =='air_pressure':
            pressure = cube[:,:].copy()
    x_wind = x_wind.regrid(y_wind, iris.analysis.Linear())
    y_wind.coord('latitude').coord_system = iris.coord_systems.GeogCS(semi_major_axis= pcb_const.radius.data, longitude_of_prime_meridian=0)
    y_wind.coord('longitude').coord_system = iris.coord_systems.GeogCS(semi_major_axis= pcb_const.radius.data, longitude_of_prime_meridian=0)
    x_wind.coord('latitude').coord_system = iris.coord_systems.GeogCS(semi_major_axis= pcb_const.radius.data, longitude_of_prime_meridian=0)
    x_wind.coord('longitude').coord_system = iris.coord_systems.GeogCS(semi_major_axis= pcb_const.radius.data, longitude_of_prime_meridian=0)
    tsurf.coord('latitude').coord_system = iris.coord_systems.GeogCS(semi_major_axis= pcb_const.radius.data, longitude_of_prime_meridian=0)
    tsurf.coord('longitude').coord_system = iris.coord_systems.GeogCS(semi_major_axis= pcb_const.radius.data, longitude_of_prime_meridian=0)

    x_wind, y_wind = rotate_winds_to_tidally_locked_coordinates(x_wind, y_wind, pole_lon=0, pole_lat=0)

    y_wind=regrid_to_tidally_locked_coordinates(y_wind)
    x_wind=regrid_to_tidally_locked_coordinates(x_wind)
    tsurf=regrid_to_tidally_locked_coordinates(tsurf)

    new_cubes = iris.cube.CubeList([tsurf, x_wind, y_wind])
    new_cubes[0].standard_name = 'surface_temperature'
    new_cubes[1].standard_name = 'eastward_wind'
    new_cubes[2].standard_name = 'northward_wind'
    return new_cubes

pcb_2d_regrid=regrid_cubelist(pcb_2d)

def plot_tsurf(cubes, time_mean=False, tl_coord=False):
    for cube in cubes:
        if cube.standard_name == 'eastward_wind':
            x_wind = cube[:,:].copy()
        if cube.standard_name == 'northward_wind':
            y_wind = cube[:,:].copy()
        if cube.standard_name =='surface_temperature':
            temperature = cube[:,:].copy()

    y_wind = y_wind.regrid(x_wind, iris.analysis.Linear())
    xlon = x_wind.coord('longitude')
    ylon = y_wind.coord('longitude')
    print('Minimum temp:', spatial(temperature, 'min').data)
    print('Max temp:', spatial(temperature, 'max').data)

    xe = xlon.points
    ye = y_wind.coord('latitude').points
    ue = x_wind[:, :].data
    ve = y_wind[:, :].data
    #print(temperature[25,:,:].coord(''))

    fig = plt.figure(figsize=(10,8))
    ax = fig.add_subplot(111)
    c=plt.contourf(temperature[:,:].coord('longitude').points,temperature[:,:].coord('latitude').points,
                   temperature[:,:].data, levels=25, extend='both',cmap='RdBu_r')
    c=plt.contourf(temperature[:,:].coord('longitude').points,temperature[:,:].coord('latitude').points,
                   temperature[:,:].data, levels=40, extend='both',cmap='RdBu_r')
    cbar = fig.colorbar(c, shrink=0.85)
    cbar.ax.set_ylabel('Temperature (K)', rotation=90, fontsize=16)
    cbar.ax.tick_params(length=0, labelsize=16)
    qv1=ax.quiver(xe[::6], ye[::6], ue[::6, ::6], ve[::6, ::6], pivot='middle', headwidth=2)
    ax.quiverkey(qv1, 0.8, 0.85, 10, r'10m/s', labelcolor=(0.3, 0.1, .2, 1),
                   labelpos='N', coordinates = 'figure', fontproperties={'size': 14, 'weight': 'bold'})
    plt.title('T$_{surf}$, winds at 1.3e4 Pa', fontsize=16)
    if tl_coord==True:
        plt.ylabel('Tidally-locked Latitude $\phi^{\prime} (^{\circ})$', fontsize=16)
        plt.xlabel('Tidally-locked Longitude $\lambda^{\prime} (^{\circ})$', fontsize=16)
    else:
        plt.ylabel('Latitude $\phi (^{\circ})$', fontsize=16)
        plt.xlabel('Longitude $\lambda (^{\circ})$', fontsize=16)
    plt.xticks(fontsize=14)
    plt.yticks(fontsize=14)
    plt.xlim(0,360)
    plt.ylim(-89,89)
    plt.show()

plot_tsurf(pcb_2d)
plot_tsurf(pcb_2d_regrid)One option is to store already calculated diagnostics as cached attributes of Run, so that they can be reused without calculating them again.
For example, if raw data does not contain air_density, it can be calculated from air_temperature and air_pressure. Then if another variable depends on density, air_density can be invoked from cache.
Merge interp_to_pres_lev() and interp_all_to_pres_lev() and allow cubes as the first argument.
https://github.com/exoclim/aeolus/blob/master/aeolus/calc/diag.py#L39
clear - cloudyA declarative, efficient, and flexible JavaScript library for building user interfaces.
🖖 Vue.js is a progressive, incrementally-adoptable JavaScript framework for building UI on the web.
TypeScript is a superset of JavaScript that compiles to clean JavaScript output.
An Open Source Machine Learning Framework for Everyone
The Web framework for perfectionists with deadlines.
A PHP framework for web artisans
Bring data to life with SVG, Canvas and HTML. 📊📈🎉
JavaScript (JS) is a lightweight interpreted programming language with first-class functions.
Some thing interesting about web. New door for the world.
A server is a program made to process requests and deliver data to clients.
Machine learning is a way of modeling and interpreting data that allows a piece of software to respond intelligently.
Some thing interesting about visualization, use data art
Some thing interesting about game, make everyone happy.
We are working to build community through open source technology. NB: members must have two-factor auth.
Open source projects and samples from Microsoft.
Google ❤️ Open Source for everyone.
Alibaba Open Source for everyone
Data-Driven Documents codes.
China tencent open source team.