Giter Club home page Giter Club logo

evidentlyai / evidently Goto Github PK

View Code? Open in Web Editor NEW
4.7K 45.0 524.0 228.72 MB

Evaluate and monitor ML models from validation to production. Join our Discord: https://discord.com/invite/xZjKRaNp8b

License: Apache License 2.0

Python 14.87% JavaScript 0.01% TypeScript 1.05% Jupyter Notebook 84.02% HTML 0.02% CSS 0.01% Makefile 0.02% Shell 0.01%
data-drift jupyter-notebook pandas-dataframe machine-learning model-monitoring html-report production-machine-learning machine-learning-operations mlops data-science

evidently's Introduction

Evidently

An open-source framework to evaluate, test and monitor ML models in production.

Docs | Discord | User Newsletter | Blog | Twitter | Evidently Cloud

πŸ†• New release

Evidently 0.4.0. Self-host an ML Monitoring interface -> QuickStart

πŸ“Š What is Evidently?

Evidently is an open-source Python library for data scientists and ML engineers. It helps evaluate, test, and monitor ML models from validation to production. It works with tabular, text data and embeddings.

Evidently has a modular approach with 3 components on top of the shared metrics functionality.

1. Tests: batch model checks

Tests example

Tests perform structured data and ML model checks. They verify a condition and return an explicit pass or fail.

You can create a custom Test Suite from 50+ tests or run a preset (for example, Data Drift or Regression Performance). You can get results as a JSON, Python dictionary, exportable HTML, visual report inside Jupyter notebook, or as Evidently JSON snapshot.

Tests are best for automated checks. You can integrate them as a pipeline step using tools like Airflow.

2. Reports: interactive visualizations

Old dashboards API was deprecated in v0.1.59. Here is the migration guide.

Report example

Reports calculate various data and ML metrics and render rich visualizations. You can create a custom Report or run a preset to evaluate a specific aspect of the model or data performance. For example, a Data Quality or Classification Performance report.

You can get an HTML report (best for exploratory analysis and debugging), JSON or Python dictionary output (best for logging, documentation or to integrate with BI tools), or as Evidently JSON snapshot.

3. ML monitoring dashboard

This functionality is available from v0.4.0.

image

You can self-host an ML monitoring dashboard to visualize metrics and test results over time. This functionality sits on top of Reports and Test Suites. You must store their outputs as Evidently JSON snapshots that serve as a data source for the Evidently Monitoring UI.

You can track 100+ metrics available in Evidently, from the number of nulls to text sentiment and embedding drift.

πŸ‘©β€πŸ’» Install Evidently

MAC OS and Linux

Evidently is available as a PyPI package. To install it using pip package manager, run:

pip install evidently

Evidently is also available on Anaconda distribution platform. To install Evidently using conda installer, run:

conda install -c conda-forge evidently

Windows

Evidently is available as a PyPI package. To install it using pip package manager, run:

pip install evidently

To install Evidently using conda installer, run:

conda install -c conda-forge evidently

▢️ Getting started

Option 1: Test Suites

This is a simple Hello World example. Head to docs for a complete Quickstart for Reports and Test Suites.

Prepare your data as two pandas DataFrames. The first is your reference data, and the second is current production data.Β The structure of both datasets should be identical. You need input features only to run some evaluations (e.g., Data Drift). In other cases (e.g., Target Drift, Classification Performance), you need Target and/or Prediction.

After installing the tool, import the Evidently Test Suite and required presets. We'll use a simple toy dataset:

import pandas as pd

from sklearn import datasets

from evidently.test_suite import TestSuite
from evidently.test_preset import DataStabilityTestPreset
from evidently.test_preset import DataQualityTestPreset

iris_data = datasets.load_iris(as_frame='auto')
iris_frame = iris_data.frame

To run the Data Stability Test Suite and display the output in the notebook:

data_stability= TestSuite(tests=[
    DataStabilityTestPreset(),
])
data_stability.run(current_data=iris_frame.iloc[:60], reference_data=iris_frame.iloc[60:], column_mapping=None)
data_stability

You can also save an HTML file. You'll need to open it from the destination folder.

data_stability.save_html("file.html")

To get the output as JSON:

data_stability.json()

Option 2: Reports

After installing the tool, import the Evidently Report and required presets:

import pandas as pd

from sklearn import datasets

from evidently.report import Report
from evidently.metric_preset import DataDriftPreset

iris_data = datasets.load_iris(as_frame='auto')
iris_frame = iris_data.frame

To generate the Data Drift report, run:

data_drift_report = Report(metrics=[
    DataDriftPreset(),
])

data_drift_report.run(current_data=iris_frame.iloc[:60], reference_data=iris_frame.iloc[60:], column_mapping=None)
data_drift_report

Save the report as HTML. You'll later need to open it from the destination folder.

data_drift_report.save_html("file.html")

To get the output as JSON:

data_drift_report.json()

Option 3: ML monitoring dashboard

This will launch a demo project in the Evidently UI. Head to docs for a complete ML Monitoring Quickstart.

Recommended step: create a virtual environment and activate it.

pip install virtualenv
virtualenv venv
source venv/bin/activate

After installing Evidently (pip install evidently), run the Evidently UI with the demo projects:

evidently ui --demo-projects all

Access Evidently UI service in your browser. Go to the localhost:8000.

πŸ’» Contributions

We welcome contributions! Read the Guide to learn more.

πŸ“š Documentation

For more information, refer to a complete Documentation. You can start with the tutorials:

πŸ—‚οΈ Examples

Simple examples on toy datasets to quickly explore what Evidently can do out of the box.

Title Code example Tutorial Contents
QuickStart Tutorial: ML Monitoring Example Tutorial Pre-built ML monitoring dashboard.
QuickStart Tutorial: Tests and Reports Jupyter notebook
Colab
Tutorial Data Stability and custom Test Suites, Data Drift and Target Drift Reports
Evidently Metric Presets Jupyter notebook
Colab
- Data Drift, Target Drift, Data Quality, Regression, Classification Reports
Evidently Metrics Jupyter notebook
Colab
- All individual Metrics
Evidently Test Presets Jupyter notebook
Colab
- NoTargetPerformance, Data Stability, Data Quality, Data Drift Regression, Multi-class Classification, Binary Classification, Binary Classification top-K test suites
Evidently Tests Jupyter notebook
Colab
- All individual Tests

There are more example in the Community Examples repository.

Integrations

Explore Integrations to see how to integrate Evidently in the prediction pipelines and with other tools.

How-to guides

Explore the How-to guides to understand specific features in Evidently, such as working with text data.

☎️ User Newsletter

To get updates on new features, integrations and code tutorials, sign up for the Evidently User Newsletter.

βœ… Discord Community

If you want to chat and connect, join our Discord community!

evidently's People

Contributors

0lgaf avatar aadral avatar alex-zenml avatar antoniscst avatar burkovae avatar c0t0ber avatar dimaamega avatar duncan-hunter avatar elenasamuylova avatar emeli-dral avatar guilhermesdrf avatar inderpreetsingh01 avatar jameslamb avatar jenoovchi avatar liraim avatar magdalenakuhn17 avatar mike0sv avatar mnrozhkov avatar mou avatar nathnx avatar natoshir avatar neokish avatar provinzkraut avatar radionbik avatar rfsan avatar sangamswadik avatar strickvl avatar svetleo-evidently avatar tapot avatar ujwalkumar1995 avatar

Stargazers

 avatar  avatar  avatar  avatar  avatar  avatar  avatar  avatar  avatar  avatar  avatar  avatar  avatar  avatar  avatar  avatar  avatar  avatar  avatar  avatar  avatar  avatar  avatar  avatar  avatar  avatar  avatar  avatar  avatar  avatar  avatar  avatar  avatar  avatar  avatar  avatar  avatar  avatar  avatar  avatar  avatar  avatar  avatar  avatar  avatar  avatar  avatar  avatar  avatar  avatar  avatar  avatar  avatar  avatar  avatar  avatar  avatar  avatar  avatar  avatar  avatar  avatar  avatar  avatar  avatar  avatar  avatar  avatar  avatar  avatar  avatar  avatar  avatar  avatar  avatar  avatar  avatar  avatar  avatar  avatar  avatar  avatar  avatar  avatar  avatar  avatar  avatar  avatar  avatar  avatar  avatar  avatar  avatar  avatar  avatar  avatar  avatar  avatar  avatar  avatar

Watchers

 avatar  avatar  avatar  avatar  avatar  avatar  avatar  avatar  avatar  avatar  avatar  avatar  avatar  avatar  avatar  avatar  avatar  avatar  avatar  avatar  avatar  avatar  avatar  avatar  avatar  avatar  avatar  avatar  avatar  avatar  avatar  avatar  avatar  avatar  avatar  avatar  avatar  avatar  avatar  avatar  avatar  avatar  avatar  avatar  avatar

evidently's Issues

Error in running example- CatTargetDrift

The example with CatTargetDrift in the README seems to lead to an error. Although the code with just DataDriftTab works. Just not CatTargetDriftTab. Any ideas as to what might be going on? Attached the example below with the error statement

import pandas as pd
from sklearn import datasets

from evidently.dashboard import Dashboard
from evidently.tabs import DataDriftTab
from evidently.tabs.cat_target_drift_tab import CatTargetDriftTab

iris = datasets.load_iris()
iris_frame = pd.DataFrame(iris.data, columns = iris.feature_names)

iris_data_and_target_drift_report = Dashboard(tabs=[DataDriftTab, CatTargetDriftTab])
iris_data_and_target_drift_report.calculate(iris_frame[:100], iris_frame[100:], column_mapping = None)
iris_data_and_target_drift_report.save("reports/my_report_with_2_tabs.html")

Traceback:

---------------------------------------------------------------------------
ValueError                                Traceback (most recent call last)
<ipython-input-1-817b60d42b2c> in <module>
     11 iris_data_and_target_drift_report = Dashboard(tabs=[DataDriftTab, CatTargetDriftTab])
     12 iris_data_and_target_drift_report.calculate(iris_frame[:100], iris_frame[100:], column_mapping = None)
---> 13 iris_data_and_target_drift_report.save("reports/my_report_with_2_tabs.html")

~/miniconda3/lib/python3.8/site-packages/evidently/dashboard/dashboard.py in save(self, filename)
    207             os.makedirs(parent_dir, exist_ok=True)
    208         with open(filename, 'w', encoding='utf-8') as out_file:
--> 209             out_file.write(self.html())

~/miniconda3/lib/python3.8/site-packages/evidently/dashboard/dashboard.py in html(self)
    200 
    201     def html(self):
--> 202         return self.__render(file_html_template)
    203 
    204     def save(self, filename):

~/miniconda3/lib/python3.8/site-packages/evidently/dashboard/dashboard.py in __render(self, template)
    156     def __render(self, template: typing.Callable[[TemplateParams], str]):
    157         dashboard_id = "evidently_dashboard_" + str(uuid.uuid4()).replace("-", "")
--> 158         tab_widgets = [t.info() for t in self.tabs_data]
    159 
    160         dashboard_info = DashboardInfo(dashboard_id, [item for tab in tab_widgets for item in tab if item is not None])

~/miniconda3/lib/python3.8/site-packages/evidently/dashboard/dashboard.py in <listcomp>(.0)
    156     def __render(self, template: typing.Callable[[TemplateParams], str]):
    157         dashboard_id = "evidently_dashboard_" + str(uuid.uuid4()).replace("-", "")
--> 158         tab_widgets = [t.info() for t in self.tabs_data]
    159 
    160         dashboard_info = DashboardInfo(dashboard_id, [item for tab in tab_widgets for item in tab if item is not None])

~/miniconda3/lib/python3.8/site-packages/evidently/tabs/base_tab.py in info(self)
     31 
     32     def info(self) -> List[BaseWidgetInfo]:
---> 33         return [w.get_info() for w in self.widgets]
     34 
     35     @abc.abstractmethod

~/miniconda3/lib/python3.8/site-packages/evidently/tabs/base_tab.py in <listcomp>(.0)
     31 
     32     def info(self) -> List[BaseWidgetInfo]:
---> 33         return [w.get_info() for w in self.widgets]
     34 
     35     @abc.abstractmethod

~/miniconda3/lib/python3.8/site-packages/evidently/widgets/widget.py in get_info(self)
     30         if self.wi:
     31             return self.wi
---> 32         raise ValueError(f"[Widget {self.title}] self.wi is None, no data available (forget to set it in widget?)")
     33 
     34     @abc.abstractmethod

ValueError: [Widget Target (Prediction) Behavior By Feature] self.wi is None, no data available (forget to set it in widget?)

Contribution Guidelines

Hi there,

I think it is really a good package, and I want to ask about how contributions can be made to this project?

Thanks.

Keyword Error

facing object 'dashboard' is not J-Son serializable

evidently.model_profile.Profile.calculate not populating default float values for 'confidence' or 'drift_share'

Hi, when running through the mlflow integration tutorial, the Profile.calculate function fails with TypeError exceptions, stating that mathematical operations are not supported between floats and NoneTypes.

The point where this is failing is in the dataset_drift_evaluation function when comparing the calculated drift statistics with the default thresholds, as shown in the attached traceback screenshot:
conf_level_unsupported_operands

If I explicitly specify:
column_mapping['drift_conf_level'] = 0.95
column_mapping['drift_features_share'] = 0.5

then everything works as expected.

(evidently version == 0.1.23.dev0)

Some errors in quick start docs

https://docs.evidentlyai.com/quick-start#generating-dashboards-and-html-reports

iris_data_and_target_drift_report = Dashboard(tabs=[DataDriftTab, CatTargetDriftTab])
iris_data_and_target_drift_report.calculate(iris_frame[:75], iris_frame[:75], 
    column_mapping=None)
iris_data_drift_report.save("reports/my_report_with_2_tabs.html")

you got same reference and current data here, and exported the same report without target drift

I guess it might be:

iris_data_and_target_drift_report = Dashboard(tabs=[DataDriftTab, CatTargetDriftTab])
iris_data_and_target_drift_report.calculate(iris_frame[:75], iris_frame[75:], 
    column_mapping=None)
iris_data_and_target_drift_report.save("reports/my_report_with_2_tabs.html")

Custom binning showing error

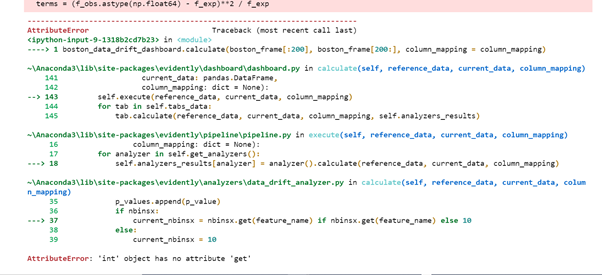
By default custom binning value(nbinsx) is 10. I tried to change the default value by passing below values to column mapping.

column_mapping['nbinsx'] = 15

It is showing error. I am also attaching the error images.

Is there any other way to give the custom binning value.

image
image

ProbClassificationPerformanceTab - Report not getting displayed

Hey,

I was following the documentation to try out Evidently. I save the reports as html and open them up to analyze. I recently tried out the "ProbClassificationPerformanceTab" as it proved to be useful for my problem. The code runs fine but when I open the output HTML file, I am just able to see "Loading..." and not any Visualizations. But I have used the drift report and cat target drift report and both of them worked fine.

Can you please help with this?

handling of dtype object

I am getting an exception due to columns having the type object.

After converting to type "category", the exception is gone.

Expected behavior:

  • do conversion under the hood or do dtype check and error message

"---------------------------------------------------------------------------
TypeError Traceback (most recent call last)
in
1 report = Dashboard(tabs=[DataDriftTab])
2 report.calculate(df_feb[MODEL_COLS].sample(10000), march_df[MODEL_COLS].sample(10000),
----> 3 column_mapping = None)

redacted/evidently/dashboard/dashboard.py in calculate(self, reference_data, current_data, column_mapping)
140 current_data: pandas.DataFrame,
141 column_mapping: dict = None):
--> 142 self.execute(reference_data, current_data, column_mapping)
143 for tab in self.tabsData:
144 tab.calculate(reference_data, current_data, column_mapping, self.analyzers_results)
redacted/evidently/pipeline/pipeline.py in execute(self, reference_data, current_data, column_mapping)
16 column_mapping: dict = None):
17 for analyzer in self.get_analyzers():
---> 18 self.analyzers_results[analyzer] = analyzer().calculate(reference_data, current_data, column_mapping)

redacted/evidently/analyzers/data_drift_analyzer.py in calculate(self, reference_data, current_data, column_mapping)
81
82 for feature_name in cat_feature_names:
---> 83 ref_feature_vc = reference_data[feature_name][np.isfinite(reference_data[feature_name])].value_counts()
84 current_feature_vc = current_data[feature_name][np.isfinite(current_data[feature_name])].value_counts()
85

redacted/pandas/core/series.py in array_ufunc(self, ufunc, method, *inputs, **kwargs)
724
725 inputs = tuple(extract_array(x, extract_numpy=True) for x in inputs)
--> 726 result = getattr(ufunc, method)(*inputs, **kwargs)
727
728 name = names[0] if len(set(names)) == 1 else None

TypeError: ufunc 'isfinite' not supported for the input types, and the inputs could not be safely coerced to any supported types according to the casting rule ''safe''

Hist bins and explicit zero customization

Add explicit hist bins customization in form of i.e. dict in mapping section:
column_mapping['numerical_features'] = {'feature1: {hist_bins: 5}, feature2: (hist_bins:10)}

Also it is common than some features have preavailing 0 values (i.e. product counts within clients purchases). Currently auto binning combines theese zeros with another counts to make bins like 0-4, 5-9 etc. But theese zeros need to be shown separately.

My suggestion is to include this config in mapping section:
column_mapping['numerical_features'] = {'feature1: {hist_bins: 5, explicit_zero: True}, feature2: {hist_bins:10, explicit_zero: False}}

installation and quickstart docs

It might be easy to miss that a plugin is required to run evidently in jupyter, e.g.

Website is only listing "pip install": https://evidentlyai.com/
Users are used to to type "pip install packagename" and jump to the quickstart of the docs (skipping the installation part)

Possible solution:

  • add the installation of the plugin to the website instructions as optional
  • add a warning to the jupyter part of the quickstart that the plugin must be installed

Parallel backend support

Hi there

Thank you for a great package. I would like to request whether a parallel backend could be supported when running drift calculations across large numbers of features.

Regards

chisquare error for Boston Dataset

Thanks for your work.

I'm going through Target and Data Drift Dashboard for Boston Dataset Notebook and getting this error:

/lib/python3.8/site-packages/evidently/pipeline/pipeline.py in execute(self, reference_data, current_data, column_mapping)
     16                 column_mapping: dict = None):
     17         for analyzer in self.get_analyzers():
---> 18             self.analyzers_results[analyzer] = analyzer().calculate(reference_data, current_data, column_mapping)

/lib/python3.8/site-packages/evidently/analyzers/data_drift_analyzer.py in calculate(self, reference_data, current_data, column_mapping)
     75 
     76             # CHI2 to be implemented for cases with different categories
---> 77             p_value = chisquare(f_exp, f_obs)[1]
     78 
     79             result['metrics'][feature_name] = dict(

/lib/python3.8/site-packages/scipy/stats/stats.py in chisquare(f_obs, f_exp, ddof, axis)
   6850 
   6851     """
-> 6852     return power_divergence(f_obs, f_exp=f_exp, ddof=ddof, axis=axis,
   6853                             lambda_="pearson")
   6854 

/lib/python3.8/site-packages/scipy/stats/stats.py in power_divergence(f_obs, f_exp, ddof, axis, lambda_)
   6692                    f"of {rtol}, but the percent differences are:\n"
   6693                    f"{relative_diff}")
-> 6694             raise ValueError(msg)
   6695 
   6696     else:

ValueError: For each axis slice, the sum of the observed frequencies must agree with the sum of the expected frequencies to a relative tolerance of 1e-08, but the percent differences are:
0.53

I have scipy=1.7.0. Can you please have a look. Thanks

Exception on Get started code execution

Hello.

If I try to run code from Get started as is:

import pandas as pd
from sklearn import datasets

from evidently.dashboard import Dashboard
from evidently.tabs import DriftTab, CatTargetDriftTab

iris = datasets.load_iris()
iris_frame = pd.DataFrame(iris.data, columns = iris.feature_names)

iris_data_drift_report = Dashboard(iris_frame[:100], iris_frame[100:], tabs = [DriftTab])
iris_data_drift_report.save("reports/my_report.html")

iris_data_drift_report = Dashboard(iris_frame[:100], iris_frame[100:], tabs = [DriftTab, CatTargetDriftTab])
iris_data_drift_report.save("reports/my_report_with_2_tabs.html")

I get error:

Traceback (most recent call last):
  File "get_started.py", line 15, in <module>
    iris_data_drift_report.save("reports/my_report_with_2_tabs.html")
  File "/home/alex/Dev/venv/lib/python3.8/site-packages/evidently/dashboard/dashboard.py", line 161, in save
    f.write(self.__render(file_html_template))
  File "/home/alex/Dev/venv/lib/python3.8/site-packages/evidently/dashboard/dashboard.py", line 141, in __render
    tab_widgets = [t.info() for t in self.tabsData]
  File "/home/alex/Dev/venv/lib/python3.8/site-packages/evidently/dashboard/dashboard.py", line 141, in <listcomp>
    tab_widgets = [t.info() for t in self.tabsData]
  File "/home/alex/Dev/venv/lib/python3.8/site-packages/evidently/tabs/base_tab.py", line 27, in info
    return [w.get_info() for w in self.widgets]
  File "/home/alex/Dev/venv/lib/python3.8/site-packages/evidently/tabs/base_tab.py", line 27, in <listcomp>
    return [w.get_info() for w in self.widgets]
  File "/home/alex/Dev/venv/lib/python3.8/site-packages/evidently/widgets/cat_target_pred_feature_table_widget.py", line 29, in get_info
    raise ValueError("neither target nor prediction data provided")
ValueError: neither target nor prediction data provided

As I understood, CatTargetDriftTab requires target column. So, if I add the target column everything is ok:

import pandas as pd
from sklearn import datasets

from evidently.dashboard import Dashboard
from evidently.tabs import DriftTab, CatTargetDriftTab

iris = datasets.load_iris()
iris_frame = pd.DataFrame(iris.data, columns = iris.feature_names)
iris_frame['target'] = iris.target

iris_data_drift_report = Dashboard(iris_frame[:100], iris_frame[100:], tabs = [DriftTab])
iris_data_drift_report.save("reports/my_report.html")

iris_data_drift_report = Dashboard(iris_frame[:100], iris_frame[100:], tabs = [DriftTab, CatTargetDriftTab])
iris_data_drift_report.save("reports/my_report_with_2_tabs.html")

(Line added: iris_frame['target'] = iris.target)


Please fix Get started section.


Regargs, Alex.

Integrating in Prediction pipeline

This package really helps the Data Science Team to find out the data drift . Please let me know is there any way we can integrate into prediction pipeline to generate the metrics.
Is there any way we can generate the json file with this metrics ?

Production data without label column

In case of target feature is missing in production data, gives "'TargetNameWidget' object has no attribute 'wi'"
Which metrics are supported incase the labels are missing for production data

RegressionPerfomanceTab not working !

regression_model_performance = Dashboard(tabs=[RegressionPerfomanceTab]) 
regression_model_performance.calculate(reference_data, current_data, column_mapping = column_mapping) 

NameError Traceback (most recent call last)
/usr/local/bin/kernel-launchers/python/scripts/launch_ipykernel.py in
----> 1 regression_model_performance = Dashboard(tabs=[RegressionPerfomanceTab])
2 regression_model_performance.calculate(reference_data, current_data, column_mapping = column_mapping)

NameError: name 'RegressionPerfomanceTab' is not defined


**Second part**

iris_data_and_target_drift_report = Dashboard(tabs=[DataDriftTab, CatTargetDriftTab])
iris_data_and_target_drift_report.calculate(iris_frame[:100], iris_frame[100:], column_mapping = None)
iris_data_and_target_drift_report.save("reports/my_report_with_2_tabs.html")


---------------------------------------------------------------------------
ValueError                                Traceback (most recent call last)
/usr/local/bin/kernel-launchers/python/scripts/launch_ipykernel.py in <module>
      1 iris_data_and_target_drift_report = Dashboard(tabs=[DataDriftTab, CatTargetDriftTab])
      2 iris_data_and_target_drift_report.calculate(iris_frame[:100], iris_frame[100:], column_mapping = None)
----> 3 iris_data_and_target_drift_report.save("reports/my_report_with_2_tabs.html")

~/.local/lib/python3.6/site-packages/evidently/dashboard/dashboard.py in save(self, filename)
    182             os.makedirs(parent_dir, exist_ok=True)
    183         f = open(filename, 'w')
--> 184         f.write(self.html())
    185         # f.write(self.__render(file_html_template))

~/.local/lib/python3.6/site-packages/evidently/dashboard/dashboard.py in html(self)
    175 
    176     def html(self):
--> 177         return self.__render(file_html_template)
    178 
    179     def save(self, filename):

~/.local/lib/python3.6/site-packages/evidently/dashboard/dashboard.py in __render(self, template)
    146     def __render(self, template: typing.Callable[[TemplateParams], str]):
    147         dashboard_id = "evidently_dashboard_" + str(uuid.uuid4()).replace("-", "")
--> 148         tab_widgets = [t.info() for t in self.tabsData]
    149 
    150         di = DashboardInfo(dashboard_id, [item for tab in tab_widgets for item in tab if item is not None])

~/.local/lib/python3.6/site-packages/evidently/dashboard/dashboard.py in <listcomp>(.0)
    146     def __render(self, template: typing.Callable[[TemplateParams], str]):
    147         dashboard_id = "evidently_dashboard_" + str(uuid.uuid4()).replace("-", "")
--> 148         tab_widgets = [t.info() for t in self.tabsData]
    149 
    150         di = DashboardInfo(dashboard_id, [item for tab in tab_widgets for item in tab if item is not None])

~/.local/lib/python3.6/site-packages/evidently/tabs/base_tab.py in info(self)
     31 
     32     def info(self) -> List[BaseWidgetInfo]:
---> 33         return [w.get_info() for w in self.widgets]
     34 
     35     @abc.abstractmethod

~/.local/lib/python3.6/site-packages/evidently/tabs/base_tab.py in <listcomp>(.0)
     31 
     32     def info(self) -> List[BaseWidgetInfo]:
---> 33         return [w.get_info() for w in self.widgets]
     34 
     35     @abc.abstractmethod

~/.local/lib/python3.6/site-packages/evidently/widgets/cat_target_pred_feature_table_widget.py in get_info(self)
     31         if self.wi:
     32             return self.wi
---> 33         raise ValueError("neither target nor prediction data provided")
     34 
     35     def calculate(self,

ValueError: neither target nor prediction data provided

Dependency Issue: 'sklearn'

Hi, Evidently Team! Thanks for the great package! Very very useful.

I had an issue installing evidently==0.1.14.dev0:

Traceback (most recent call last):
  File "main.py", line 8, in <module>
    from evidently.dashboard import Dashboard
  File "/usr/local/lib/python3.6/site-packages/evidently/dashboard/__init__.py", line 4, in <module>
    from .dashboard import Dashboard
  File "/usr/local/lib/python3.6/site-packages/evidently/dashboard/dashboard.py", line 17, in <module>
    from evidently.tabs.base_tab import Tab
  File "/usr/local/lib/python3.6/site-packages/evidently/tabs/__init__.py", line 8, in <module>
    from .classification_performance_tab import ClassificationPerformanceTab
  File "/usr/local/lib/python3.6/site-packages/evidently/tabs/classification_performance_tab.py", line 8, in <module>
    from evidently.widgets.class_ref_quality_metrics_widget import ClassRefQualityMetricsWidget
  File "/usr/local/lib/python3.6/site-packages/evidently/widgets/class_ref_quality_metrics_widget.py", line 11, in <module>
    from sklearn import metrics
ModuleNotFoundError: No module named 'sklearn'

I've already solved this by installing scikit-learn==0.23.2.

So, I don't know if this is a real bug and scikit needs to be a dependency of evidently or not. It's up to you!

πŸ˜„

Dashboards and Profiles customization

To make Dashboards and Profiles customisable we perform the following refactoring:

  • add an Options entity to set some changeable parameters in Tabs/Sections and Widgets
  • create verbose parameter for Tabs/Sections in order to specify the amount of the details in the reports
  • create include_widgets parameter for Tabs/Sections in order to specify the list of the widgets to show in report
  • add verbose , include_widgets parameters and Options support for CLI interface
  • add verbose , include_widgets parameters and Options support for monitoring_service

Additionally, to demonstrate how Options`` works we need to specify drift_conf_level, drift_features_share, xbins, nbinsx``` options for all data_drift reports (Tab, Section, Monitor)

Distribution plots of prediction score for binary classifiers

Hi would be nice to extend the binary classifier probabilistic report to include distribution plots (in addition to the scatter plot) of the prediction score grouped by the positive/negative true class. This way it will help identify the right cut-off point.
For the multi-label problem we can do multiple plots using 1-vs-all modeling.

data missing in the report

Hi

I was trying to generate a classification dashboard. The "reference" dataframe has 128770 rows, however, the dashboard only shows that it has 122 rows (number of objects). And for "current" dataframe, it has 632337 rows, but the dashboard only shows it has 1079 rows. I am not sure what went wrong.

Yang

Fail to generate the html drift report

Running the following command on python 3.7.7 on windows 10 in a virtualenv

data_drift_report = Dashboard(training_data_raw_w1, training_data_raw_w3, column_mapping=column_mapping, tabs = [DriftTab])
data_drift_report.save("reports/data_drift.html")

Encountered this error

TypeError                                 Traceback (most recent call last)
<ipython-input-37-743b30a1199c> in <module>
----> 1 data_drift_report.save("reports/data_drift.html")

c:\users\yanhong.zhao\ef\nga-china-bidding-prototype\venv\lib\site-packages\evidently\dashboard\dashboard.py in save(self, filename)
    173             os.makedirs(parent_dir, exist_ok=True)
    174         f = open(filename, 'w')
--> 175         f.write(self.html())
    176         #f.write(self.__render(file_html_template))

c:\users\yanhong.zhao\ef\nga-china-bidding-prototype\venv\lib\site-packages\evidently\dashboard\dashboard.py in html(self)
    166 
    167     def html(self):
--> 168         return self.__render(file_html_template)
    169 
    170     def save(self, filename):

c:\users\yanhong.zhao\ef\nga-china-bidding-prototype\venv\lib\site-packages\evidently\dashboard\dashboard.py in __render(self, template)
    146             for graph in widget.additionalGraphs:
    147                 additional_graphs[graph.id] = graph.params
--> 148         return template(TemplateParams(dashboard_id, di, additional_graphs))
    149 
    150     def _json(self):

c:\users\yanhong.zhao\ef\nga-china-bidding-prototype\venv\lib\site-packages\evidently\dashboard\dashboard.py in file_html_template(params)
    105 </script>
    106 </body>
--> 107 """
    108 
    109 

c:\users\yanhong.zhao\ef\nga-china-bidding-prototype\venv\lib\site-packages\evidently\dashboard\dashboard.py in __dashboard_info_to_json(di)
     26 
     27 def __dashboard_info_to_json(di: DashboardInfo):
---> 28     return json.dumps(asdict(di))
     29 
     30 

~\.pyenv\pyenv-win\versions\3.7.7\lib\json\__init__.py in dumps(obj, skipkeys, ensure_ascii, check_circular, allow_nan, cls, indent, separators, default, sort_keys, **kw)
    229         cls is None and indent is None and separators is None and
    230         default is None and not sort_keys and not kw):
--> 231         return _default_encoder.encode(obj)
    232     if cls is None:
    233         cls = JSONEncoder

~\.pyenv\pyenv-win\versions\3.7.7\lib\json\encoder.py in encode(self, o)
    197         # exceptions aren't as detailed.  The list call should be roughly
    198         # equivalent to the PySequence_Fast that ''.join() would do.
--> 199         chunks = self.iterencode(o, _one_shot=True)
    200         if not isinstance(chunks, (list, tuple)):
    201             chunks = list(chunks)

~\.pyenv\pyenv-win\versions\3.7.7\lib\json\encoder.py in iterencode(self, o, _one_shot)
    255                 self.key_separator, self.item_separator, self.sort_keys,
    256                 self.skipkeys, _one_shot)
--> 257         return _iterencode(o, 0)
    258 
    259 def _make_iterencode(markers, _default, _encoder, _indent, _floatstr,

~\.pyenv\pyenv-win\versions\3.7.7\lib\json\encoder.py in default(self, o)
    177 
    178         """
--> 179         raise TypeError(f'Object of type {o.__class__.__name__} '
    180                         f'is not JSON serializable')
    181 

TypeError: Object of type float32 is not JSON serializable

Think it has something to do with the saving dashboard data into JSON @emeli-dral so I tested it out this way (the dashboard class is generated but it can't be saved)

from dataclasses import asdict
import uuid
from evidently.model.dashboard import DashboardInfo
dashboard_id = "evidently_dashboard_" + str(uuid.uuid4()).replace("-", "")
tab_widgets = [t.info() for t in data_drift_report.tabsData]
di = DashboardInfo(dashboard_id, [item for tab in tab_widgets for item in tab if item is not None])

and calling any of the objects in tab_widgets/di/asdict(di) crashes the jupyter notebook instance

Different bins for reference and current distribution and minor ideas

hey I saw your presentation at pydata global and really appreciate your work and played around with the data-drift report a little.

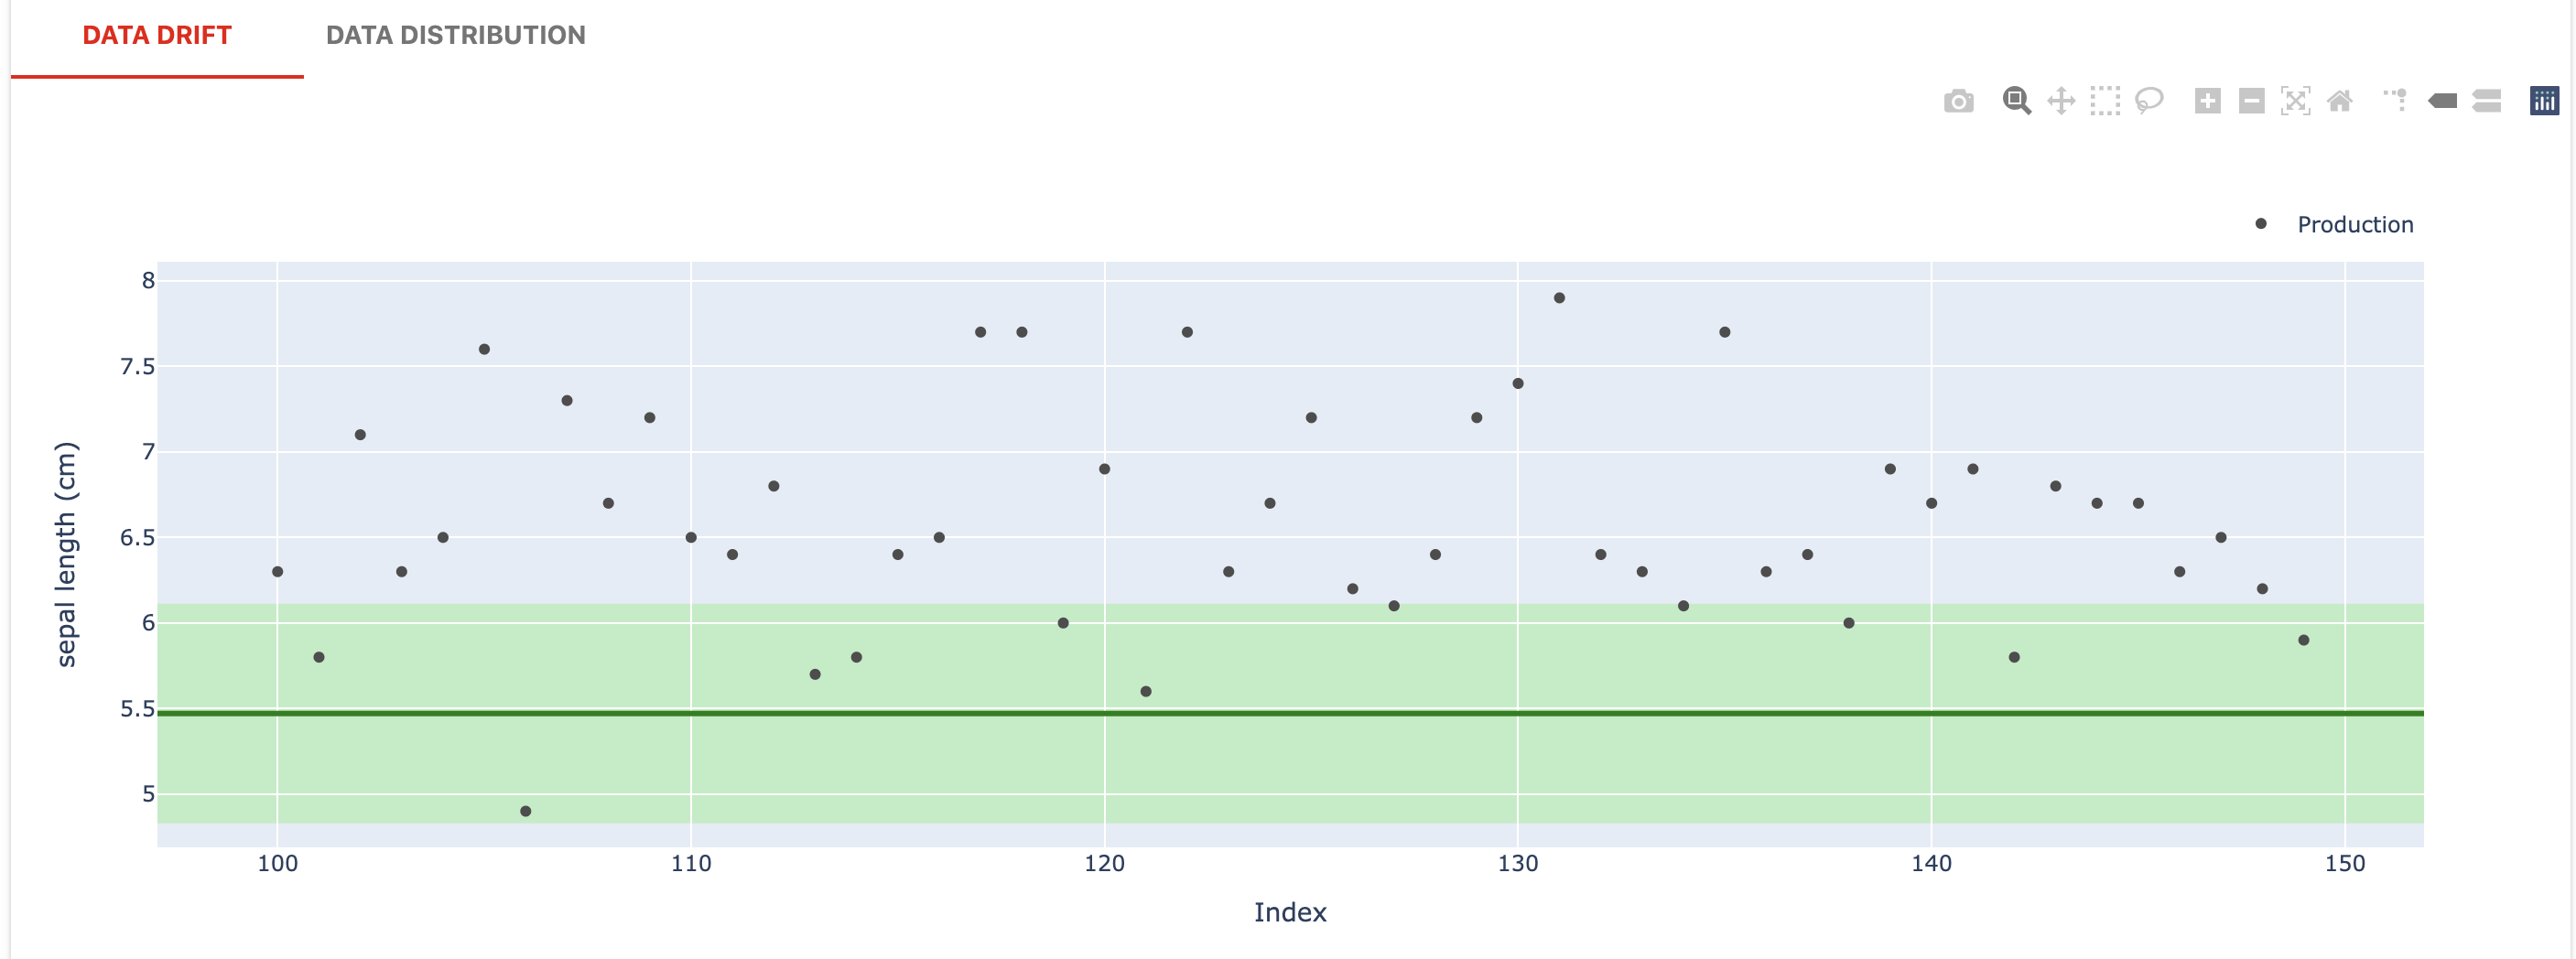
  1. My main problem is, that different bins are used for reference an current distribiton, so i find the diagrams somewhat misleading
    image

image

  1. is there a way to disable the data drift plot at all? because in my case with a lot of data points with high deviation this plot takes a lot of memory/performance but is rarly useful

  2. what i would find useful is a quick overview of the means and standard deviations in the overview of all features, maybe this could be added as a feature :)

And again thank you for your work. This really helps me a lot since i only tracked shifts in the means in the past.

data drifts results depends on data size

If I pass let's say 5% of the its show that there is no data drift. But with all data almost all features became drifted. I believe its because of statistic test. I suggest you to give options to choose PSI test as an option

Chi-square fails on categorical data

I tried using the chi-squared test, but I observed that it only works on numerical columns. When I try using categoricals, it fails. Here's how to reproduce.

def synthetic_interaction_data(n, yintercept = 10):
    df = pd.DataFrame()
    df["id"] = range(n)
    df[f'x1'] = np.random.random(size=n)*10
    df[f'x2'] = np.random.random(size=n)*10
    df[f'x3'] = np.random.random(size=n)*10
    df['target'] = (df['x1']**2 + df['x1']*df['x2'] + 5*df['x1']*np.sin(3*df['x2'])  + yintercept).astype("int16") % 2
    return df

df = synthetic_interaction_data(2000)
df["odd"] = "even"
df.loc[np.floor(df["x1"]) % 2 == 1, "odd"] = "odd"
df['target'] = df['target'].astype(np.object)

df2 = synthetic_interaction_data(2000)
df2["odd"] = "even"
df2.loc[np.floor(df2["x1"]) % 2 == 1, "odd"] = "odd"
df2['target'] = df2['target'].astype(np.object)

ddp = Profile(sections=[DataDriftProfileSection])
ddp.calculate(df, df2, column_mapping = None)

Shows the error below:

---------------------------------------------------------------------------
TypeError                                 Traceback (most recent call last)
<ipython-input-70-92e6117fd55f> in <module>
      1 ddp = Profile(sections=[DataDriftProfileSection])
----> 2 ddp.calculate(df, df2, column_mapping = None)

/opt/conda/lib/python3.8/site-packages/evidently/model_profile/model_profile.py in calculate(self, reference_data, current_data, column_mapping)
     20                   current_data: pandas.DataFrame,
     21                   column_mapping: dict = None):
---> 22         self.execute(reference_data, current_data, column_mapping)
     23 
     24     def get_analyzers(self):

/opt/conda/lib/python3.8/site-packages/evidently/pipeline/pipeline.py in execute(self, reference_data, current_data, column_mapping)
     16                 column_mapping: dict = None):
     17         for analyzer in self.get_analyzers():
---> 18             self.analyzers_results[analyzer] = analyzer().calculate(reference_data, current_data, column_mapping)

/opt/conda/lib/python3.8/site-packages/evidently/analyzers/data_drift_analyzer.py in calculate(self, reference_data, current_data, column_mapping)
     57 
     58         for feature_name in cat_feature_names:
---> 59             ref_feature_vc = reference_data[feature_name][np.isfinite(reference_data[feature_name])].value_counts()
     60             current_feature_vc = current_data[feature_name][np.isfinite(current_data[feature_name])].value_counts()
     61 

/opt/conda/lib/python3.8/site-packages/pandas/core/generic.py in __array_ufunc__(self, ufunc, method, *inputs, **kwargs)
   1934         self, ufunc: Callable, method: str, *inputs: Any, **kwargs: Any
   1935     ):
-> 1936         return arraylike.array_ufunc(self, ufunc, method, *inputs, **kwargs)
   1937 
   1938     # ideally we would define this to avoid the getattr checks, but

/opt/conda/lib/python3.8/site-packages/pandas/core/arraylike.py in array_ufunc(self, ufunc, method, *inputs, **kwargs)
    356         # ufunc(series, ...)
    357         inputs = tuple(extract_array(x, extract_numpy=True) for x in inputs)
--> 358         result = getattr(ufunc, method)(*inputs, **kwargs)
    359     else:
    360         # ufunc(dataframe)

TypeError: ufunc 'isfinite' not supported for the input types, and the inputs could not be safely coerced to any supported types according to the casting rule ''safe''

Hope you can help me with this, or if there's something I did incorrectly. Thanks.

AttributeError when trying to save report

When saving a report using

data_drift_report.save("/dbfs/FileStore/drift/drift_report.html")

I get

AttributeError: 'DataDriftTableWidget' object has no attribute 'wi'

caused by

/databricks/python/lib/python3.8/site-packages/evidently/widgets/data_drift_table_widget.py in get_info(self)
25
26 def get_info(self) -> BaseWidgetInfo:
---> 27 if self.wi:
28 return self.wi
29 raise ValueError("no widget info provided")

I'm using azure databricks, and can save the json profile, and get the same error if I use data_drift_report.show(), though I never installed nbextension.

I can save the iris report, and am using numerical and categorical feature mappings.

Unable to view the dashboard on Jupyter notebook.

I am trying to generate the data drift report on jupyter notebook but it shows just loading and no graphs like it's showing in your examples notebooks. However I can write it to HTML file and see the report.

So does this requires any package or setting changes?

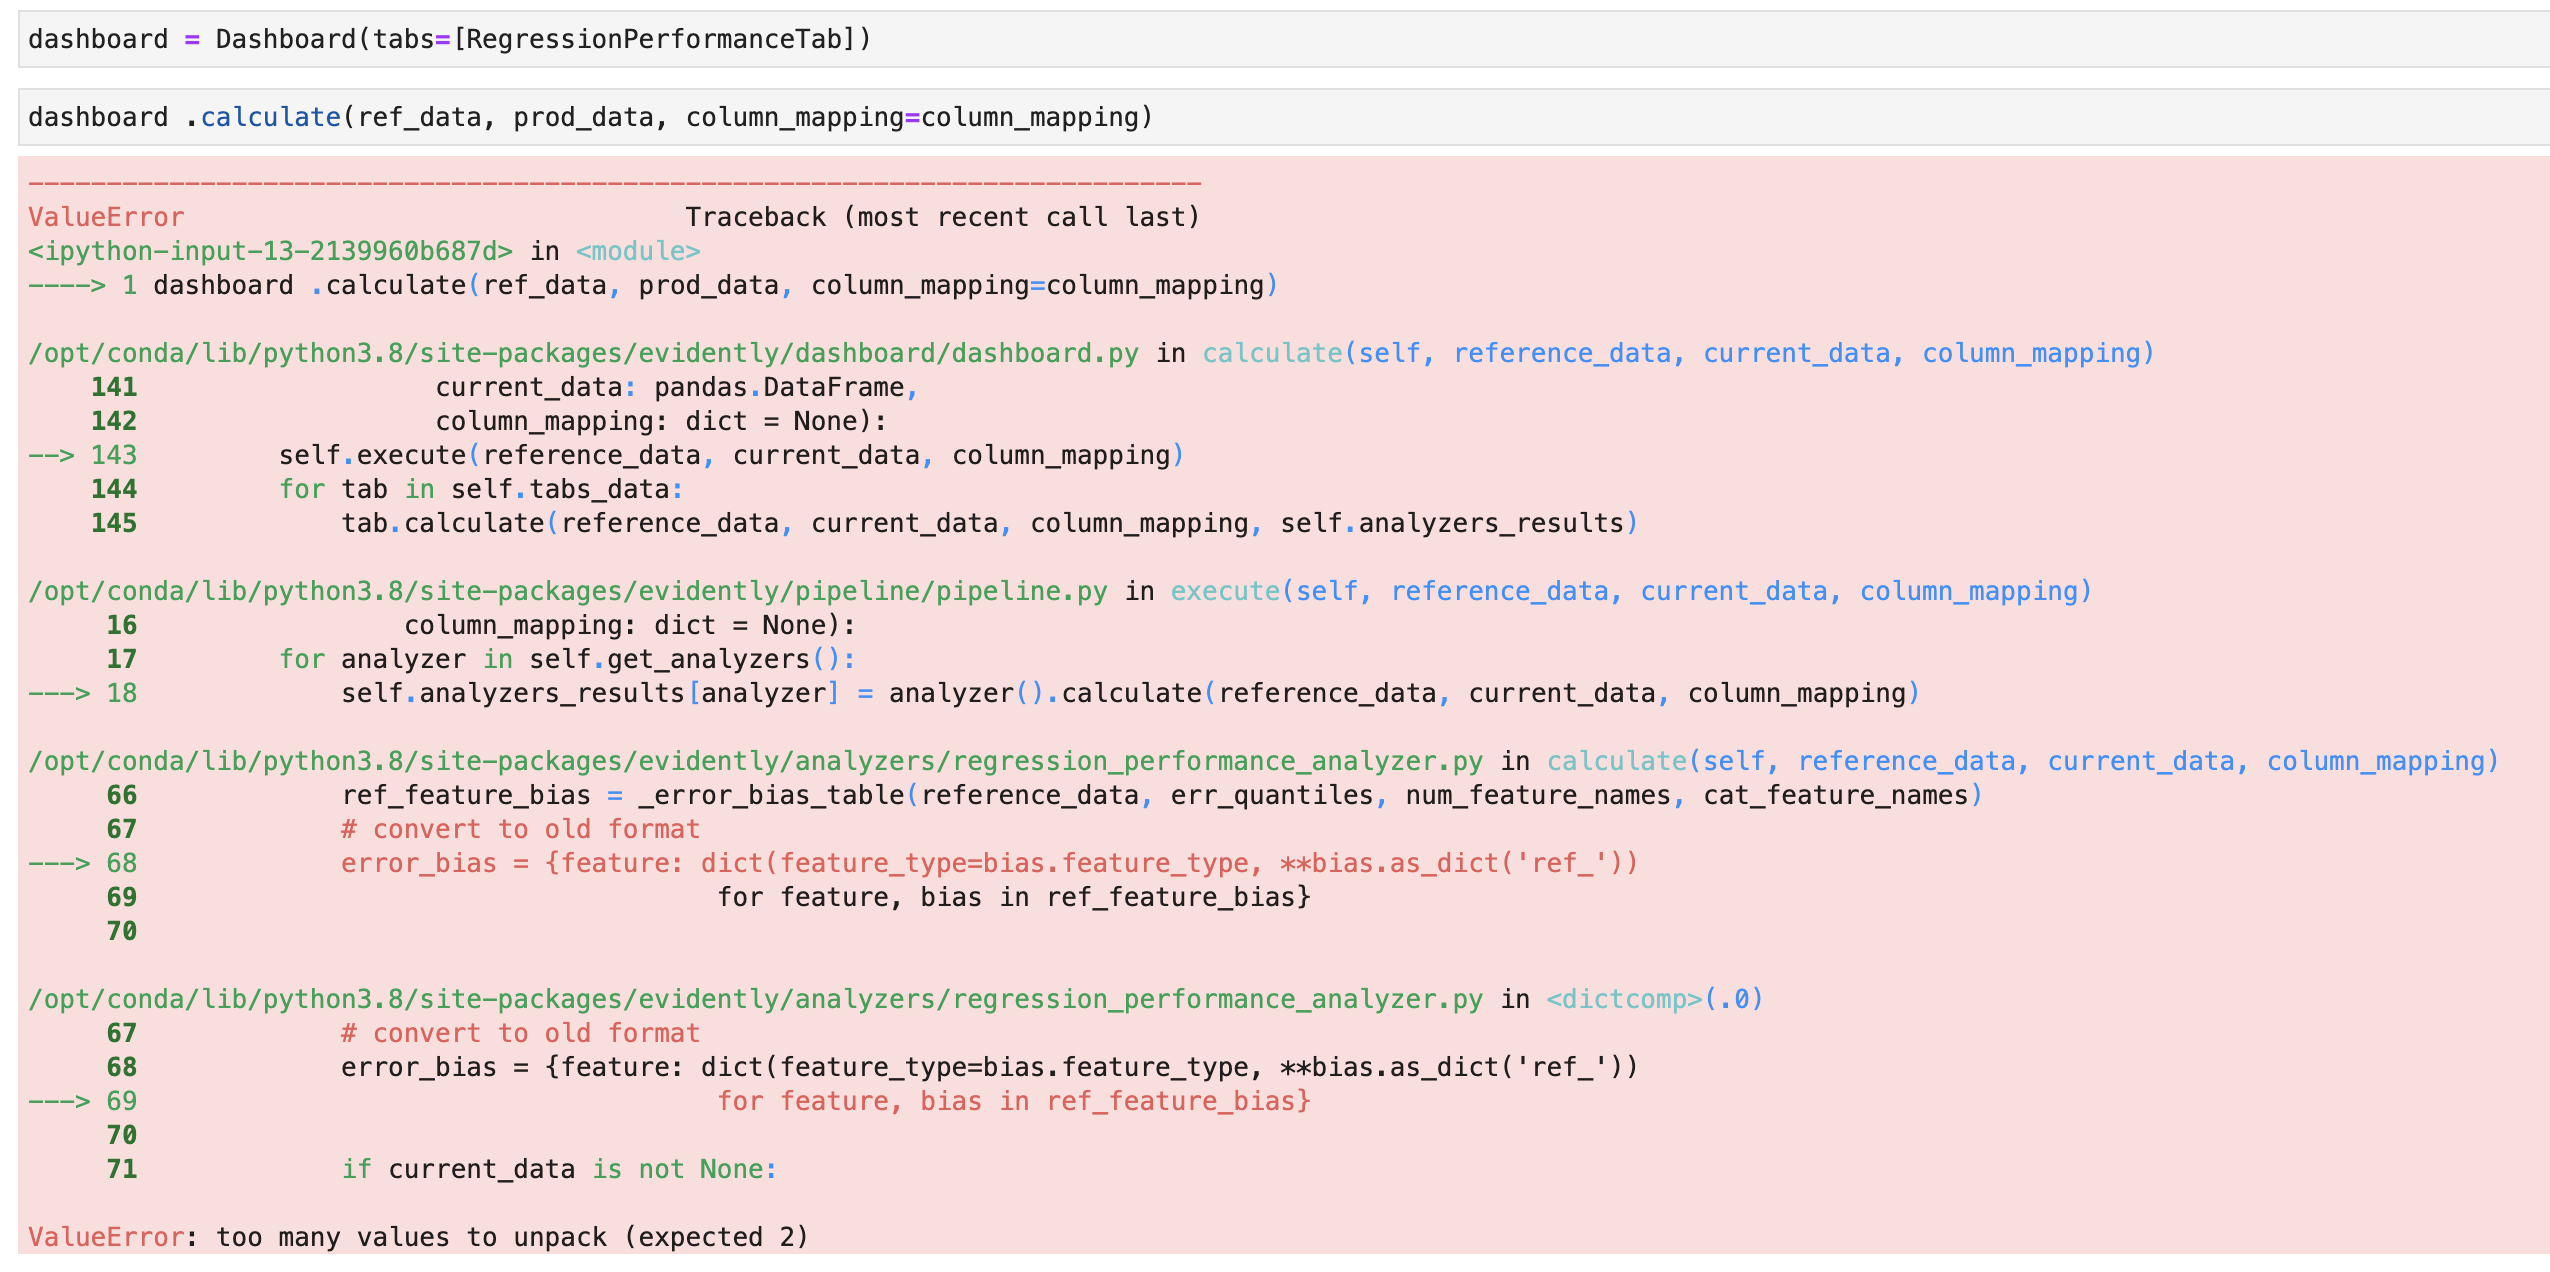
Calculate Function throws unpacking error

Hi Team,
I ran the example notebook provided on git on my local machine but getting the following error when I call the "calculate" function on the Dashboard or Profile object.
image

Can someone help me to understand why this is happening?
Thanks!

report now showing when using a bit more data

Hey,

I wanted to run against a production dataset of small-mid size:

65 columns, 150K points in each dataframe.

If I reduce the dataset to one feature, the report shows. If I use all features, the report goes from 16MB to 600 MB and is not displaying (saved or in jupyter).

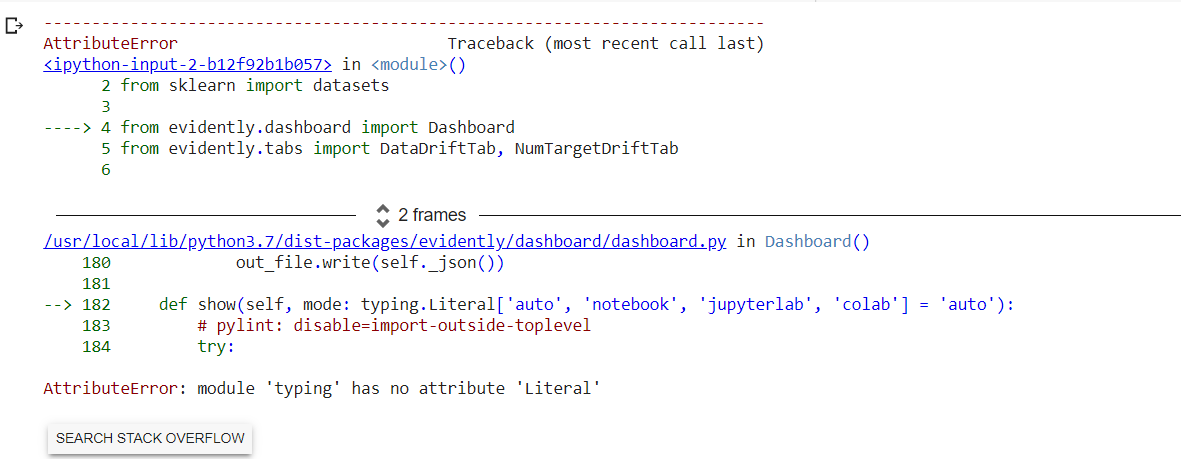
Issue with importing Dashboard after latest release 0.1.28.dev0 ?

I am exploring evidently and I am new to the tool. I was trying to use it on google colab. It worked fine until today, but when I tried using it today the following import statement started throwing error.

'from evidently.dashboard import Dashboard'

The error is :
image

When I revert to the older version using "pip install evidently==0.1.27.dev0" , the import works well again.
Has the new version stopped supporting any particular python version?

Column mapping not working

Column mapping is not working in the system, I get "TypeError: unsupported operand type(s) for -: 'float' and 'NoneType'" or Zero Division Error when I try to use.
OS : Windows
Python 3.7
Even I tried in Google Colab, still its not working

Trace 0 on charts of RegressionPerformanceTab

Hi,

I am having problems trying to understand if trace 0 on graphs has any meaning or if it just a trace on y = 0.

Is it possible to remove this trace? My graph outputs doesnt scale well with it.

Thank you!

Regression Performance Tab has ZeroDvisionError when target values have zero values

I have a dataset with some zeros values in target and this line is throwing error the Zero division zero

abs_perc_err = list(map(lambda x : 100*abs(x[0] - x[1])/x[0], zip(reference_data[target_column], reference_data[prediction_column])))
ZeroDivisionError: float division by zero

I was thinking since the datasets are already in DataFrame can't we do something like this

abs_perc_err = ((reference_data[target_column]-reference_data[prediction_column])/reference_data[target_column]*100).abs()

and the zero target values will now be returned with -inf instead

Incorrect AUC ROC score and log loss.

The probability classification report gives wrong values for the above mentioned metrics. Also when I looked into this code - prob_class_ref_quality_metrics_widget.py.
the lines where auc and log_loss were calculated are mentioned in comments as problem

Data Drift by Feature standard deviation from mean

Hi,

I was using the Data Drift Tab by Feature.

Is it possible to change the green area that covers one standard deviation from the mean? I wanted it to be 2 std deviation making it less sensible to data drift

Thank you

No module named 'evidently.dashboard'; 'evidently' is not a package

Hi @elenasamuylova and @emeli-dral ,

Hope you guys are fine.

We were trying evidently for the first time in a Windows machine, and after installing it using command pip install evidently and trying to run it (on jupyter and also on VSCode), we got the following error:

'evidently.dashboard'; 'evidently' is not a package

See the print screen below:
image

We also found that the installed package, when I tried pip list was: evidently 0.1.22.dev0

Hope the above information can help you to help me.

All the best,
Edu

cases with a lot of objects

Hey! Thanks for a great product!
I ran into the following problem: the Kolmogorov-Smirnov test becomes too sensitive when the number of objects is really large. It would be nice to have a tool for such cases.

Request for feature - Transformer models/ Clustering/ Pandas Data-frame descriptions

Do we have the flexibility to create dashboard for NLP related tasks from Hugging face libraries https://huggingface.co/.

Example1: Comparing two classification models using NLP models like BERT and Roberta. Compare metrics and show them in dashboards. Also show their loss in the dashboard.

Example2: Comparing two Clustering models using on text data. Compare metrics such as Silhouette score and show them in dashboards. Also plot the clustering result for 3D and 2D by using Tsne

A friendly comment

Hi developersπŸ‘‹ , thank you so much for developing the amazing package :) It is easy to use and really useful!
I have an idea of making a small change. In real business, we usually use historical data as the "reference" and the current period data as "current". That is to say, we are likely to have a much larger amount of data for "reference" comparing to "current".
For the CatTargetDrift, I think it would be better if you could add histnorm='probability density' to the Target (Predict) By Feature plots.
Thank you for your time and consideration.

Recommend Projects

  • React photo React

    A declarative, efficient, and flexible JavaScript library for building user interfaces.

  • Vue.js photo Vue.js

    πŸ–– Vue.js is a progressive, incrementally-adoptable JavaScript framework for building UI on the web.

  • Typescript photo Typescript

    TypeScript is a superset of JavaScript that compiles to clean JavaScript output.

  • TensorFlow photo TensorFlow

    An Open Source Machine Learning Framework for Everyone

  • Django photo Django

    The Web framework for perfectionists with deadlines.

  • D3 photo D3

    Bring data to life with SVG, Canvas and HTML. πŸ“ŠπŸ“ˆπŸŽ‰

Recommend Topics

  • javascript

    JavaScript (JS) is a lightweight interpreted programming language with first-class functions.

  • web

    Some thing interesting about web. New door for the world.

  • server

    A server is a program made to process requests and deliver data to clients.

  • Machine learning

    Machine learning is a way of modeling and interpreting data that allows a piece of software to respond intelligently.

  • Game

    Some thing interesting about game, make everyone happy.

Recommend Org

  • Facebook photo Facebook

    We are working to build community through open source technology. NB: members must have two-factor auth.

  • Microsoft photo Microsoft

    Open source projects and samples from Microsoft.

  • Google photo Google

    Google ❀️ Open Source for everyone.

  • D3 photo D3

    Data-Driven Documents codes.