euroargodev / argodmqc_owc Goto Github PK
View Code? Open in Web Editor NEWArgo float salinity calibration software
License: Apache License 2.0
Argo float salinity calibration software
License: Apache License 2.0
![dependabot[bot] avatar](https://avatars.githubusercontent.com/in/29110?v=4 "dependabot[bot]")


The cal2dec function reads:
def cal2dec(pa_month, pa_day, pa_hour=0, pa_minute=0):
    """ Converts a calendar date (month, day, hour, minute) to a decimal date (float)

        Parameters
        ----------
        pa_month: Month in the year (where 0 is Janurary and 11 is Decemeber)
        pa_day: Day in the month
        pa_hour: Hour in the day
        pa_minute: Minute in the hour

        Returns
        -------
        decimalised version of the date
    """

    ln_cumulative_months = np.cumsum([0, 31, 28, 31, 30, 31, 30, 31, 31, 30, 31, 30, 31])

    try:
        dec_date = float(
            ln_cumulative_months[pa_month] + pa_day - 1 + pa_hour / 24 + pa_minute / 60 / 24
        )
        if dec_date > 366:
            raise ValueError("Day is out of scope of the year")
        return dec_date

    except IndexError:
        raise ValueError('Month is out of scope')
and the decimal year is then computed in change_dates with:
day = year + (cal2dec(month - 1, day, hour, minute) / 365)But I'm not sure this function is robust to leap years.
For instance here we can find this implementation:
from datetime import datetime as dt
import time

def toYearFraction(date):
    def sinceEpoch(date): # returns seconds since epoch
        return time.mktime(date.timetuple())
    s = sinceEpoch

    year = date.year
    startOfThisYear = dt(year=year, month=1, day=1)
    startOfNextYear = dt(year=year+1, month=1, day=1)

    yearElapsed = s(date) - s(startOfThisYear)
    yearDuration = s(startOfNextYear) - s(startOfThisYear)
    fraction = yearElapsed/yearDuration

    return date.year + fraction
which takes the year into account, contrary to cal2dec.
So the difference will read:
date = pd.to_datetime('20200301')
print(toYearFraction(date))
# 2020.1639344262296

dec = cal2dec(int(date.strftime("%m"))-1, int(date.strftime("%d")), int(date.strftime("%H")), int(date.strftime("%M")))
int(date.strftime("%Y")) + dec / 365
# 2020.1616438356164
This may not be very significant for the calibration, but this is simply not right and we should fix this.
I have noticed that currently in Matlab and Python version of OWC there is no warning/throw an error to prevent DMQC operator to enter swapped values in small and large: Lon, Lat, Age parts of the Objective Mapping Parameters section. I run Python and Matlab OWC software with swapped values and in both cases, codes are running and producing map_.mat file.
Should we introduce in the OWC code some kind of e.g warning/throw an error, to prevent users to accidentally enter swapped values?
I run the analysis for very long float including 269 profiles. At profile 265, I received an error message that there has been no good climatology data. That is kind of error that we expect. However, Python code is not generating map_.mat file for the profiles that were sucesfully analysed before crash.
It would be worth to set in the code for lack of coog climtology data python should skip that profile and continue analysis for another one. If there is no other good data code should stop analysis and produce the map_.mat file for those profile that climatology is sufficient.
Error message:
UPDATE_SALINITY_MAPPING: Working on profile 265 Warning: found 1 all NaNs in your dataset. These water columns have been removed Traceback (most recent call last): File "L:/users/argo/kamwal/OWC_Python_Test_1/owc-software-python/owc_calibration.py", line 73, in <module> update_salinity_mapping("/", FLOAT_NAME, USER_CONFIG) File "L:\users\argo\kamwal\OWC_Python_Test_1\owc-software-python\ow_calibration\update_salinity_mapping\update_salinity_mapping.py", line 351, in update_salinity_mapping hist_interp_sal, hist_interp_pres = interp_climatology(best_hist_sal, File "L:\users\argo\kamwal\OWC_Python_Test_1\owc-software-python\ow_calibration\interp_climatology\interp_climatology.py", line 78, in interp_climatology raise ValueError("No good climatological data has been found") ValueError: No good climatological data has been found
WMO: 4901464
Reference data: CTD_for_DMQC_2019v01.m
WMO boxes: wmo_boxes_ctd.mat
Objective mapping parameters:
`% Objective Mapping Parameters
%
% max number of historical casts used in objective mapping
CONFIG_MAX_CASTS=300
% 1=use PV constraint, 0=don't use PV constraint, in objective mapping
MAP_USE_PV=0
% 1=use SAF separation criteria, 0=don't use SAF separation criteria, in objective mapping
MAP_USE_SAF=0
% spatial decorrelation scales, in degrees
MAPSCALE_LONGITUDE_LARGE=8
MAPSCALE_LONGITUDE_SMALL=4
MAPSCALE_LATITUDE_LARGE=4
MAPSCALE_LATITUDE_SMALL=2
% cross-isobath scales, dimensionless, see BS(2005)
MAPSCALE_PHI_LARGE=0.1
MAPSCALE_PHI_SMALL=0.02
% temporal decorrelation scale, in years
MAPSCALE_AGE=5
MAPSCALE_AGE_LARGE=20
% exclude the top xxx dbar of the water column
MAP_P_EXCLUDE=100
% only use historical data that are within +/- yyy dbar from float data
MAP_P_DELTA=200`
It goes without saying that this is low priority, for now.
Some functions, such as update_salinity mapping, are doing far too much leg work for a single function. Because of this, they require numerous local variable definitions, and require a huge amount branches (nested for and if statements).
Not only does this make them somewhat difficult to test (as the testing suite to hit all possible branches would be huge), it makes them difficult to maintain for anyone approaching the code without a huge amount of background knowledge.
I propose a reasonably simple, but potentially time consuming refactor whereby we split these routines into even smaller chunks, separating out data manipulation areas (ie converting from 0 < x < 360 latitude to -180 < x < 180) and sections after "if" and "for" statements into their own easily testable functions, if they aren't already.
This will
Let's talk about refactoring ideas
This is the most important feature to properly control what's being done, so it requires a nice and flexible UI
This is the most time consuming step, so it requires optimization to improve perf
update_salinity_mapping function (500 hundreds line !) by identifying recurrent patterns and affecting inner loop work to specific functionsupdate_salinity_mapping has 2 main loop levels: on profile and on vertical levels. If inner loop work is delegated to functions and if data structure is clarified (with dictionaries or even better: xarray.DataSet), make these loops work in parallel will be much easier and a game changer in terms of performances.This is a key component of the software, fetching float but more importantly reference data.
update_salinity_mapping the longitude values wrapping between -180/180 for get_topo_grid is done outside of get_topo_grid, adding 4 lines and 1 variable to the code. It it this function inner responsibility to check for longitude values, must not be done outside.Most of the code for the Potential Vorticity has actually been merged in (though I do need to double check this). However, we still need to merge in the code that allows an operator to filter out data around the South Antarctic Front.
I noticed that some of the pyowc functions do not use the same options order policy !
For instance:
# Calculate mapped values needed for the analysis
owc.calibration.update_salinity_mapping("", USER_CONFIG, FLOAT_NAME)
while we have:
# Set the calseries parameters for analysis and line fitting
owc.configuration.set_calseries("", FLOAT_NAME, USER_CONFIG)
see how USER_CONFIG comes first and then second ...
when refactoring the code, this must be addressed.
Hi,
I've rushed a little bit yesterday when migrating the repo
I think we should tag a release 0.1.0 with the initial state, the version that is being tested by expert users.
So I propose to strip the code from my commits yesterday, and tag a release with this initial state
It should be easier to work with for debugging the testers
Are you ok @edsmall-bodc @matdon17 ?
Currently, in the setup.py code including the general information about the software the author email is [email protected]
Ed Small is not working in BODC and it would be good to change this email to more general such as [email protected] or any other
In order to migrate the repository from NOC to github servers at EUROARGODEV:
@edsmall-bodc, @matdon17 : I'll be happy to do this if you want me to.
I found relatively large differences (~40 seconds) in speed per profile in the update salinity mapping calulations. This potentially could be related with a capability of my computer or there is something that could be improved in Python code.
Did anyone have a simmilar Python code behaviour?
WMO num: 1901847
WMO boxes: wmo_boxes_ctd.mat
Refence data: CTD_for_DMQC_2019V01
Code evaliation times for Matlab and Python:
Matlab 1901847.docx
Python 1901847.docx
Config_file:
`% ===============================
%
% Objective Mapping Parameters
%
% max number of historical casts used in objective mapping
CONFIG_MAX_CASTS=300
% 1=use PV constraint, 0=don't use PV constraint, in objective mapping
MAP_USE_PV=0
% 1=use SAF separation criteria, 0=don't use SAF separation criteria, in objective mapping
MAP_USE_SAF=0
% spatial decorrelation scales, in degrees
MAPSCALE_LONGITUDE_LARGE=8
MAPSCALE_LONGITUDE_SMALL=4
MAPSCALE_LATITUDE_LARGE=4
MAPSCALE_LATITUDE_SMALL=2
% cross-isobath scales, dimensionless, see BS(2005)
MAPSCALE_PHI_LARGE=0.1
MAPSCALE_PHI_SMALL=0.02
% temporal decorrelation scale, in years
MAPSCALE_AGE=5
MAPSCALE_AGE_LARGE=20
% exclude the top xxx dbar of the water column
MAP_P_EXCLUDE=100
% only use historical data that are within +/- yyy dbar from float data
MAP_P_DELTA=200`
Currently, the amount of displayed plots (from 1 to 10) can be set in dashboard.py function. The default option is 2.
def plot_diagnostics(float_dir, float_name, config, levels=2)
Maybe instead of going inside this function and looking for the line where to set the number of displayed theta levels, it would be worth to have that setup in the configuration.py ?
Data used as an example in master branchare different than the source data in my source file.
Below I am including the source file matrix:
I have found that for many floats Python code is not displying coastline contours of continents in trajectory plot.
Left plot -Python verion; Right plot- Matlab version
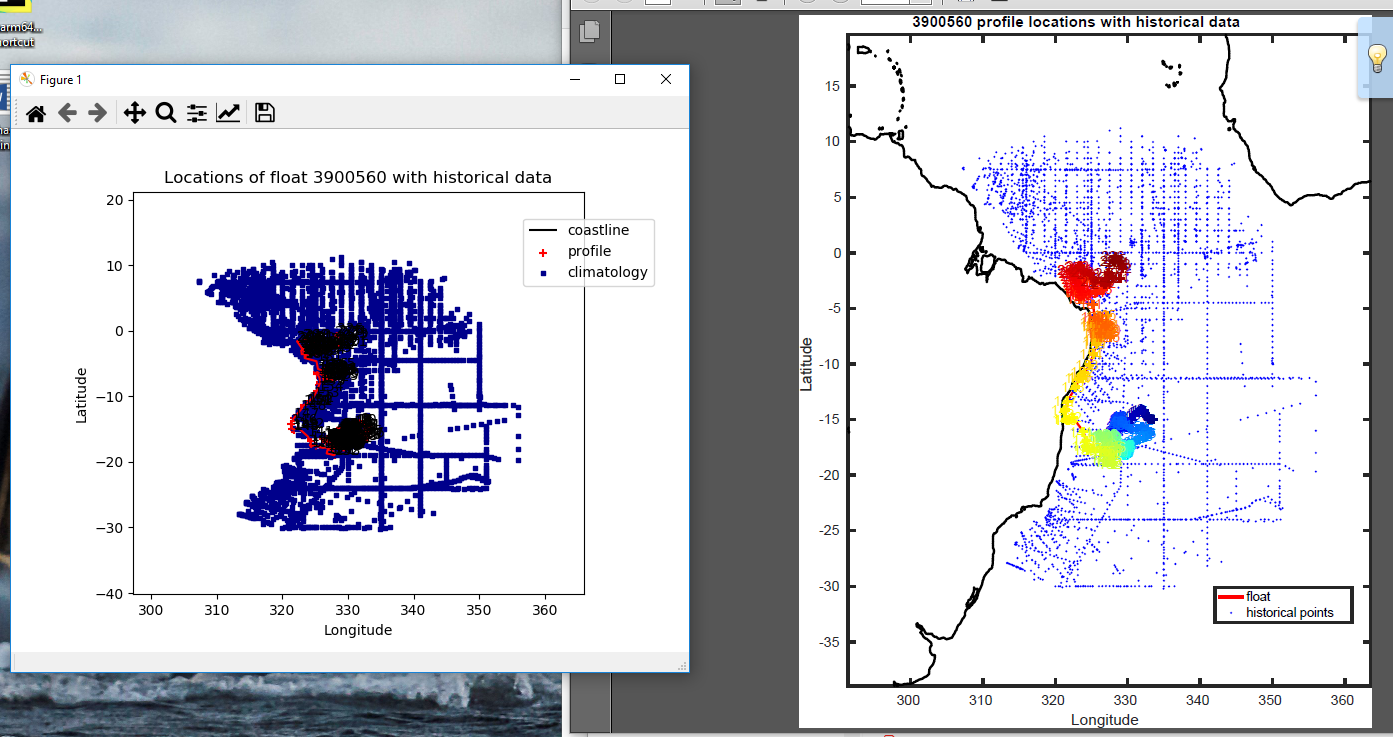

WMO: 3900560; 3901531; 3901985; 4901464; 6901121
Reference data: CTD_for_DMQC_2019V01
WMO boxes: wmo_boxes_ctd.mat
Cal series:
breaks = [] max_breaks = 4 # 0 for linear trend, -1 for offset calseries = np.ones((1, no_profiles)).flatten() # example for splitting time series at profile 33 # calseries = np.concatenate((np.ones((1, 33)), 2 * np.ones(1,no_profiles - 33))) calib_profile_no = profile_no use_percent_gt = 0.5 use_theta_lt = 0 use_theta_gt = 0 use_pres_lt = 0 use_pres_gt = 0
At this point, the python software still relies on Matlab or user own function to create the crucial float_source/<WMO>.mat file file.
For users who want to try or use the Python software, we need to provide a function that read the netcdf file and produce that OWC specific file !
This should not be too complicated, I see that the file the test "3901960.mat" file has the following arrays:
__header__ : b'MATLAB 5.0 MAT-file, Platform: GLNXA64, Created on: Mon Feb 25 13:18:03 2019'
__version__ : 1.0
__globals__ : []
PROFILE_NO : [[ 1  2  3  4  5  6  7  8  9 10 11 12 13 14 15 16 17 18 19 20 21 22 23 24
  25 26 27 35 36 37 38 39 40 41 42]]
LAT : (1, 35)
LONG : (1, 35)
DATES : (1, 35)
PRES : (205, 35)
TEMP : (205, 35)
PTMP : (205, 35)
SAL : (205, 35)I see that pyowc is using 2 libraries to read Matlab mat files:
The former is used only once, the latter basically everywhere else.
I see from #52 that pymatreader was added to fix #30 , so in fact we can't get rid of this dependency
So why using 2 dependencies for the same task ?
Should pyowc use only 1 reader ? pymatreader only
ps: This is not considering the fact that all external data should be accessible in other formats than Matlab (eg: #53)
As pointed out by @edsmall-bodc in #23 :
Currently the user has to define many things for the OWC toolbox to run:
For the update salinity mapping, they need to define:
That brings variables for salinity mapping to 15, which is somewhat tricky to manage in a usable way. Either we will need to group some of these variables together (into classes or dictionaries?), OR we can split the update salinity mapping routine up into separate routines that can be called?
We may want to consider a set of options (as a dictionary) used throughout the package that users can set or change within context and in their script.
Most of the time, users will only need to modify a subset of the parameters.
This is a mechanism used in matplotlib (they also use files) and xarray that I implemented in http://www.github.com/euroargodev/argopy as well
It is very easy to manage and I think is rather elegant and intuitive in terms of user experience:
Optional parameters can be set 3 ways:
argopy.set_options(src='erddap')with argopy.set_options(src='erddap'):
loader = ArgoDataFetcher().profile(6902746, 34)I love this one, because it will make very easy for users to test different parameters in a single script
loader = ArgoDataFetcher(src='erddap').profile(6902746, 34)As an additional improvement that would be nice to have it so allow the Python code to automatic display all generated plots in the Pycharm. At the moment, to display and generate another plot in PyCharm I need to manually close the previously displayed plot.
Currently, the find_besthist function requires 18 arguments to run. This is far too many, looks a bit messy, and can make using the function rather difficult.
I suggest taking some of the arguments out and placing them in a class, especially where the same class can be used for differing data.
Create a class for containing float data. This class can contain the latitudes, longitudes, z vales, and dates of different data points. We can either create two objects (one being the float, and the second being all the historical points), or we can create an array of objects, where each object is a single data point. This class could also contain some functions that are exclusively used on the data (i.e. calculating potential vorticity).
We could also create a class for calculating the ellipse that inherits from the other class to remove even more arguments.
I also think we should just pass in the struct containing all the configuration variables into the function, rather than dropping them in one by one.
Doing all the above will reduce the argument count from 18 to 3. I would be much more manageable.
Durring running the OWC analysis using Argo referenced data only, I encountered the below error:
` UPDATE_SALINITY_MAPPING: Working on profile 3
Traceback (most recent call last):
File "L:\users\argo\kamwal\OWC_Python_SSH\owc-software-python\ow_calibration\get_region\get_region_data.py", line 172, in get_region_data
grid_long = wrap_longitude(grid_long)
File "L:\users\argo\kamwal\OWC_Python_SSH\owc-software-python\ow_calibration\get_region\data_functions\wrap_longitude.py", line 27, in wrap_longitude
neg_long = np.argwhere(grid_long < 0)
TypeError: '<' not supported between instances of 'list' and 'int'
During handling of the above exception, another exception occurred:
Traceback (most recent call last):
File "L:/users/argo/kamwal/OWC_Python_SSH/owc-software-python/owc_calibration.py", line 73, in
update_salinity_mapping("/", FLOAT_NAME, USER_CONFIG)
File "L:\users\argo\kamwal\OWC_Python_SSH\owc-software-python\ow_calibration\update_salinity_mapping\update_salinity_mapping.py", line 330, in update_salinity_mapping
best_hist_lat, best_hist_long, best_hist_dates] = get_region_data(wmo_numbers,
File "L:\users\argo\kamwal\OWC_Python_SSH\owc-software-python\ow_calibration\get_region\get_region_data.py", line 198, in get_region_data
raise Exception("NO DATA FOUND")
Exception: NO DATA FOUND
Process finished with exit code 1
`
In running the same analysis for (1) ctd+ argo and (2) CTD only, there was not such error.
FLOAT SOURCE NUMBER: 3901960
REFERENCE DATA: ARGO_for_DMQC_2020V01.mat
WMO boxes: wmo_boxes_argo.mat
OBJECTIVE MAPPING PARAMETERS:
` # ===============================
#
# Objective Mapping Parameters
#
    # max number of historical casts used in objective mapping
    'CONFIG_MAX_CASTS': 300,

    # 1=use PV constraint, 0=don't use PV constraint, in objective mapping
    'MAP_USE_PV': 0,

    # 1=use SAF separation criteria, 0=don't use SAF separation criteria, in objective mapping
    'MAP_USE_SAF': 0,

    # spatial decorrelation scales, in degrees
    'MAPSCALE_LONGITUDE_LARGE': 8,
    'MAPSCALE_LONGITUDE_SMALL': 2,
    'MAPSCALE_LATITUDE_LARGE': 4,
    'MAPSCALE_LATITUDE_SMALL': 1,

    # cross-isobath scales, dimensionless, see BS(2005)
    'MAPSCALE_PHI_LARGE': 0.1,
    'MAPSCALE_PHI_SMALL': 0.02,

    # temporal decorrelation scale, in years
    'MAPSCALE_AGE_LARGE': 20,
    'MAPSCALE_AGE_SMALL': 10,

    # exclude the top xxx dbar of the water column
    'MAP_P_EXCLUDE': 100,

    # only use historical data that are within +/- yyy dbar from float data
    'MAP_P_DELTA': 200`
In the plots-diagnostics function of python code there is available only uncalibrated version of sal_anom_plot. The task is to include the code in plot_diagnostics and dashboard with calibrated version of this plot.
It's probably still too early, but argopy is able to fetch and return data from the Argo reference dataset !
from argopy import DataFetcher as ArgoDataFetcher
loader = ArgoDataFetcher(src='erddap', ds='ref')
ds1 = loader.region([-85, -45, 10, 20, 0, 1000, ‘2012-01’, ‘2012-02’]).to_xarray()
we could develop an access point that would work with owc, ie using distances instead of a rectangular space/time domain
Originally posted by @gmaze in #30 (comment)
While working on euroargodev/argopy/issues/141 and euroargodev/argopy/pull/142 I found that the following pyowc float_source matlab files:
are incorrect !
They appear to have been generated with an old version of the Matlab routine create_float_source.m.
The last version uses another method to sub-select vertical pressure levels (floor instead of round),
It can be seen here: euroargodev/dm_floats@7497874#diff-a7f153565065c547918a043959d1efd54b042a8d75edbf7fcef1c8bd6f76ec72
So I guess these files must be updated
The most recent version of the create_float_source.m routine is here:
https://github.com/euroargodev/dm_floats/blob/master/src/ow_source/create_float_source.m
For standard users of the software, they should not need to clone the repository to be able to run it, but rather simply install it using pip or conda.
This implies 2 things:
This is also to let you known that when this will be ready to publish euroargodev python softwares on pypi, I created a euroargodev account at https://test.pypi.org/user/euroargodev/ and https://www.pypi.org/user/euroargodev/
(don't be fulled by the picture, this is retrieved automatically from my email but will change soon, so that it is the EA logo).
When selecting historical data for comparison, 1/3 of this data is selected randomly. The rest are selected by how well the remaining historical data matches the current float profile (space and time).
The randomly selected data are specifically selected to avoid choosing only data from one area because of strong correlations. We want to ensure we use strongly correlated data AND enough data to cover the area generally.
However, if we select 1/3 of our data points randomly, we are sill at risk of selecting a poor spatial/temporal distribution (though this probability is very small). We can increase our chances of getting a good distribution by splitting up the ellipse into N parts and randomly selecting data in each of these parts.
We need to discuss how we should go about splitting up the ellipse into chunks. We should try and do this dynamically, so that DMQC operators can decide themselves how many areas the ellipse should be split into.
Also need to decide how to allocate the amount of selection for each segment. Eg, what if we want 20 random data points from each section, but one section only contains 5 data points? How do we allocate the work to pick up the slack?
I've added some diagrams to visualise what we are trying to achieve.
Yellow dot is the current profile.
Green dots are selected data
Red dots are data that fall outside our spatial/temporal parameters.


A declarative, efficient, and flexible JavaScript library for building user interfaces.
🖖 Vue.js is a progressive, incrementally-adoptable JavaScript framework for building UI on the web.
TypeScript is a superset of JavaScript that compiles to clean JavaScript output.
An Open Source Machine Learning Framework for Everyone
The Web framework for perfectionists with deadlines.
A PHP framework for web artisans
Bring data to life with SVG, Canvas and HTML. 📊📈🎉
JavaScript (JS) is a lightweight interpreted programming language with first-class functions.
Some thing interesting about web. New door for the world.
A server is a program made to process requests and deliver data to clients.
Machine learning is a way of modeling and interpreting data that allows a piece of software to respond intelligently.
Some thing interesting about visualization, use data art
Some thing interesting about game, make everyone happy.
We are working to build community through open source technology. NB: members must have two-factor auth.
Open source projects and samples from Microsoft.
Google ❤️ Open Source for everyone.
Alibaba Open Source for everyone
Data-Driven Documents codes.
China tencent open source team.