Giter Club home page Giter Club logo

flutter_echarts's Introduction

中文

A Flutter widget to use Apache ECharts in a reactive way.

Note:

Since it is based on webview, this library has some inextricable instability and performance issues. We recommend the Flutter charting library Graphic as an alternative.

Features

Reactive Updating

The most exciting feature of Flutter widgets and React components is that the view can update reactively when data changes. Thanks to ECharts' data driven architecture, flutter_echarts implements a reactive way to connect charts with data. The charts automatically re-render when data in the option property changes.

Two Way Communication

The onMessage and extraScript properties provide a way to set two-way event communication between Flutter and JavaScript.

Configurable Extensions

ECharts has a lot of extensions. The extensions property allows you to inject the extension scripts as raw strings. In this way, you can copy these scripts to your source code without being confusing by assets dirs.

Installing

Add this to your package's pubspec.yaml file:

dependencies:
  flutter_echarts: #latest version

Now in your Dart code, you can use:

import 'package:flutter_echarts/flutter_echarts.dart';  

Details see pub.dev.

Usage

The flutter_echarts package itself is very simple to use, just like a common statelessWidget:

Details about the option object is in the Echarts docs or Echarts examples.

Container(
  child: Echarts(
  option: '''
    {
      xAxis: {
        type: 'category',
        data: ['Mon', 'Tue', 'Wed', 'Thu', 'Fri', 'Sat', 'Sun']
      },
      yAxis: {
        type: 'value'
      },
      series: [{
        data: [820, 932, 901, 934, 1290, 1330, 1320],
        type: 'line'
      }]
    }
  ''',
  ),
  width: 300,
  height: 250,
)

See the full flutter_echarts_example.

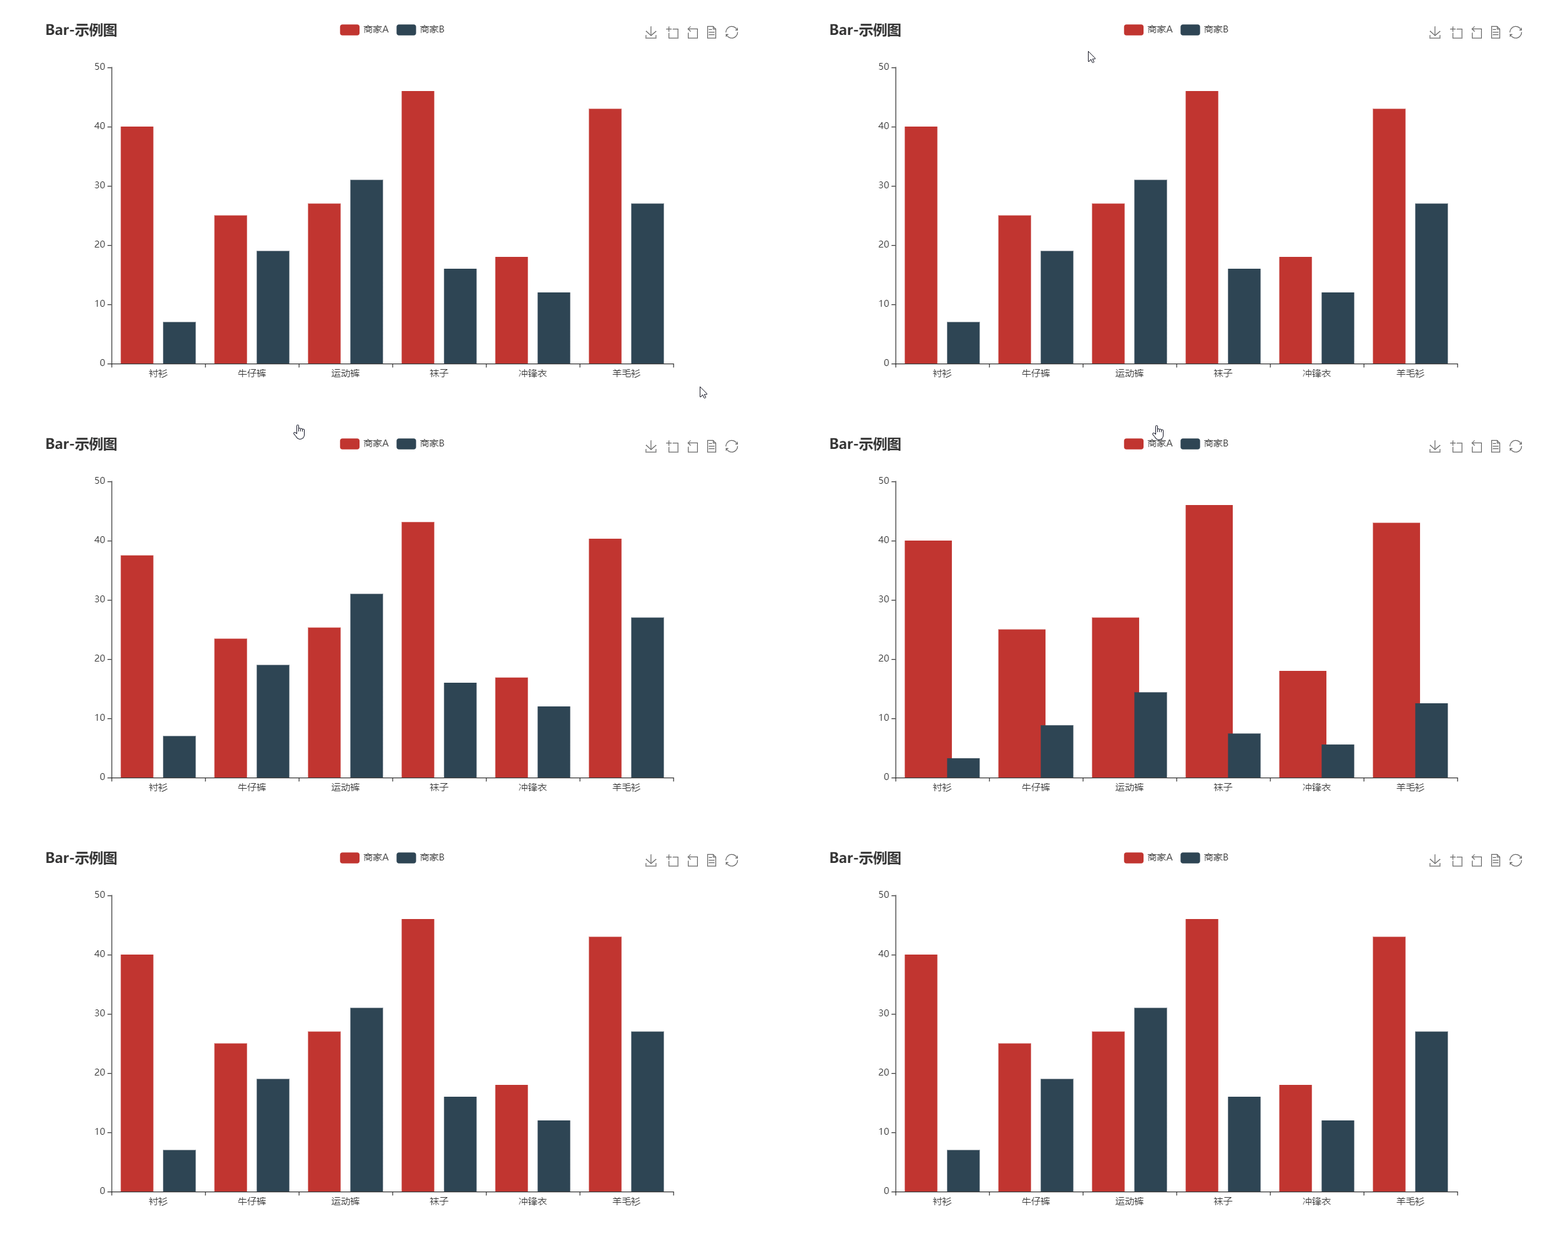
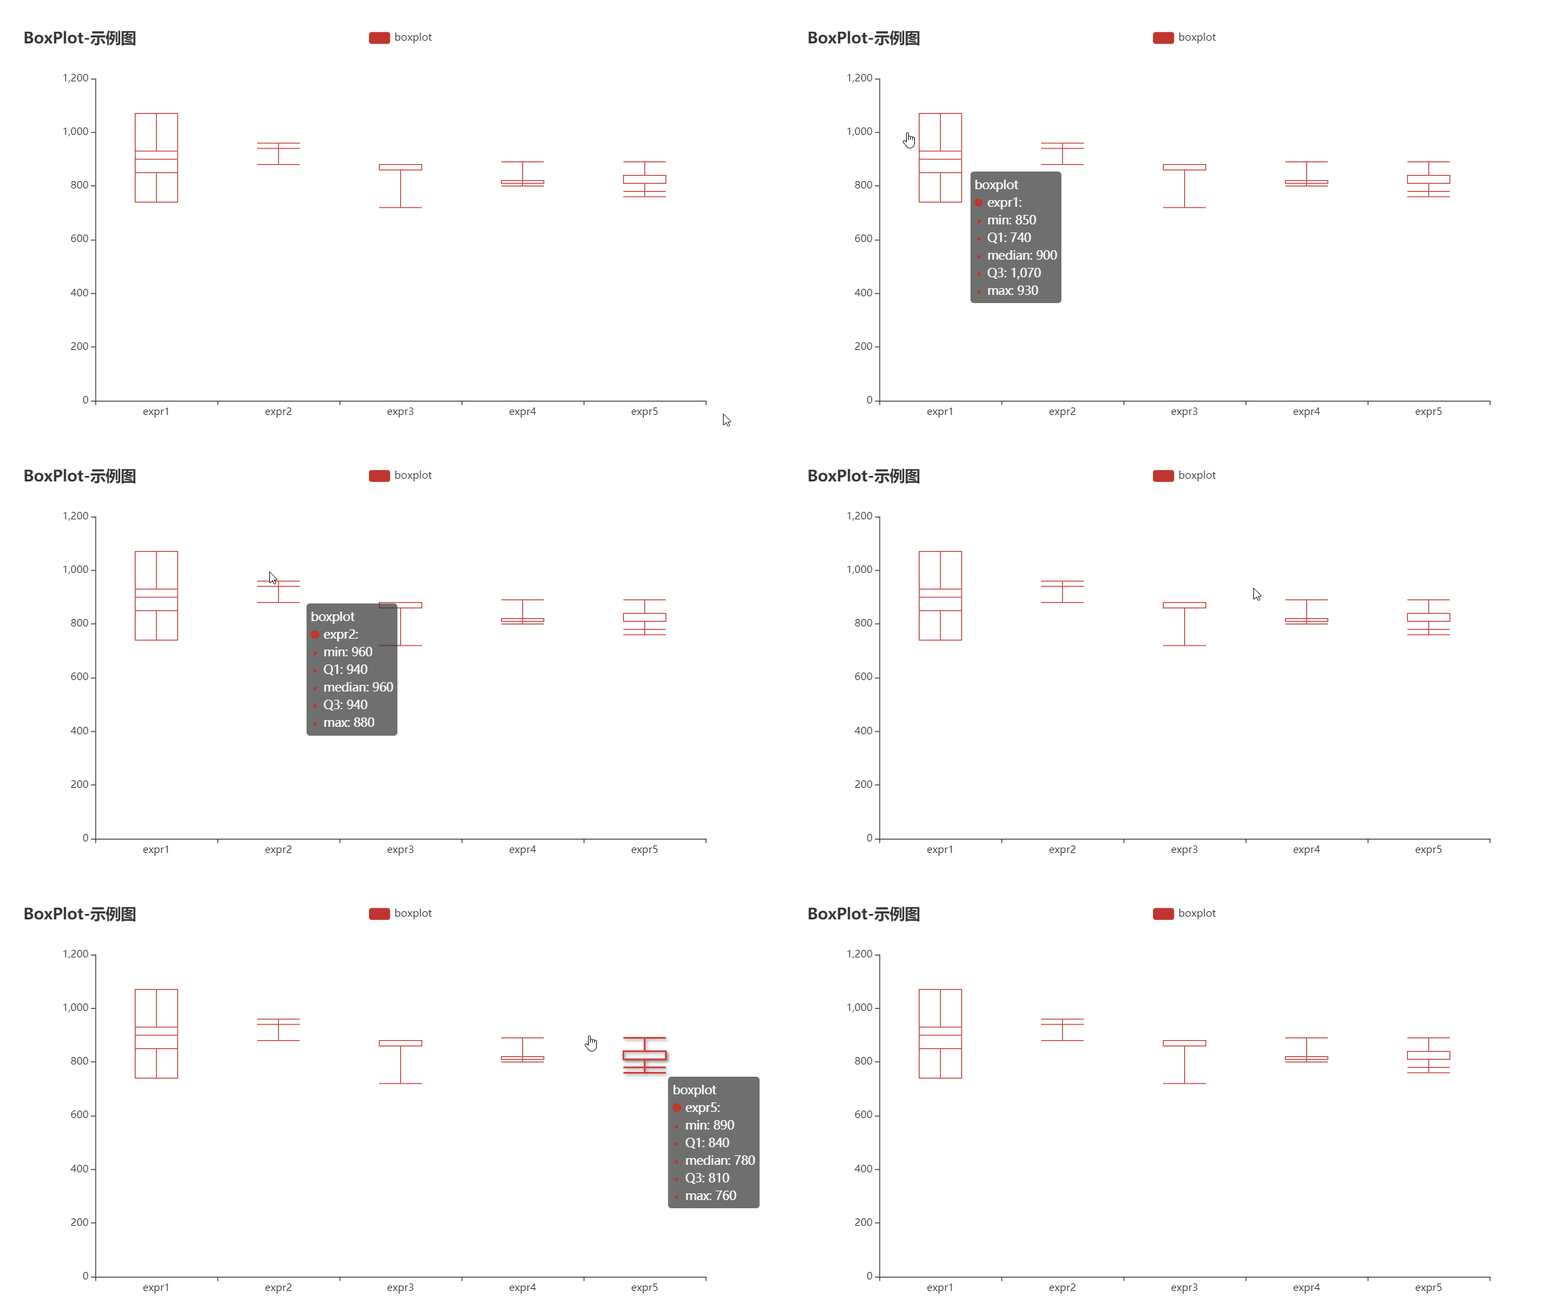
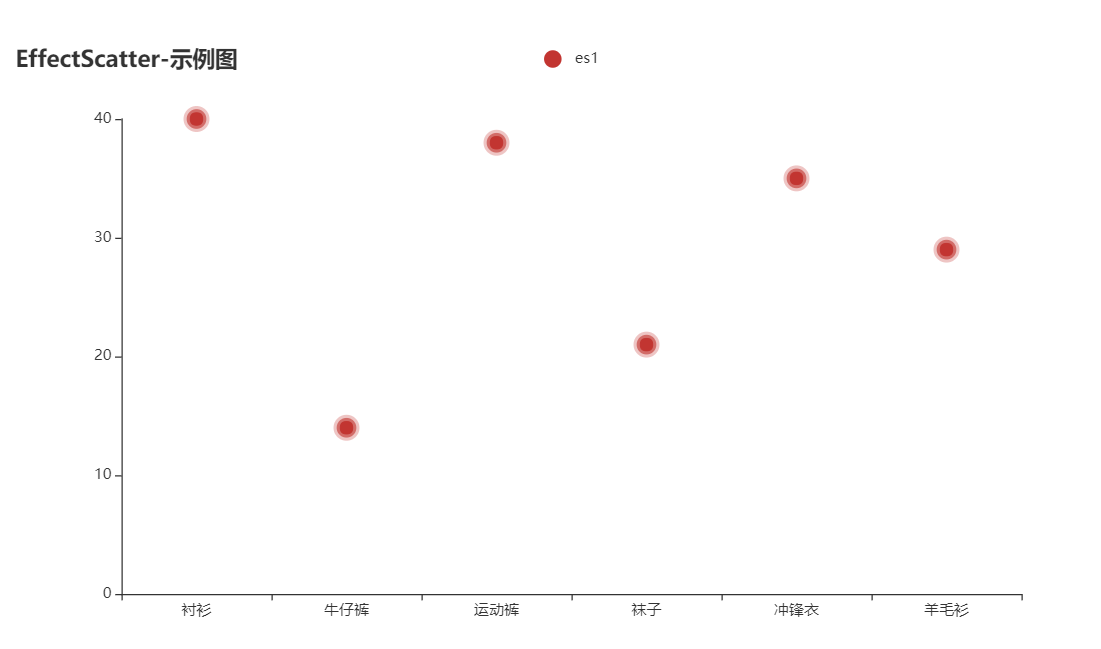
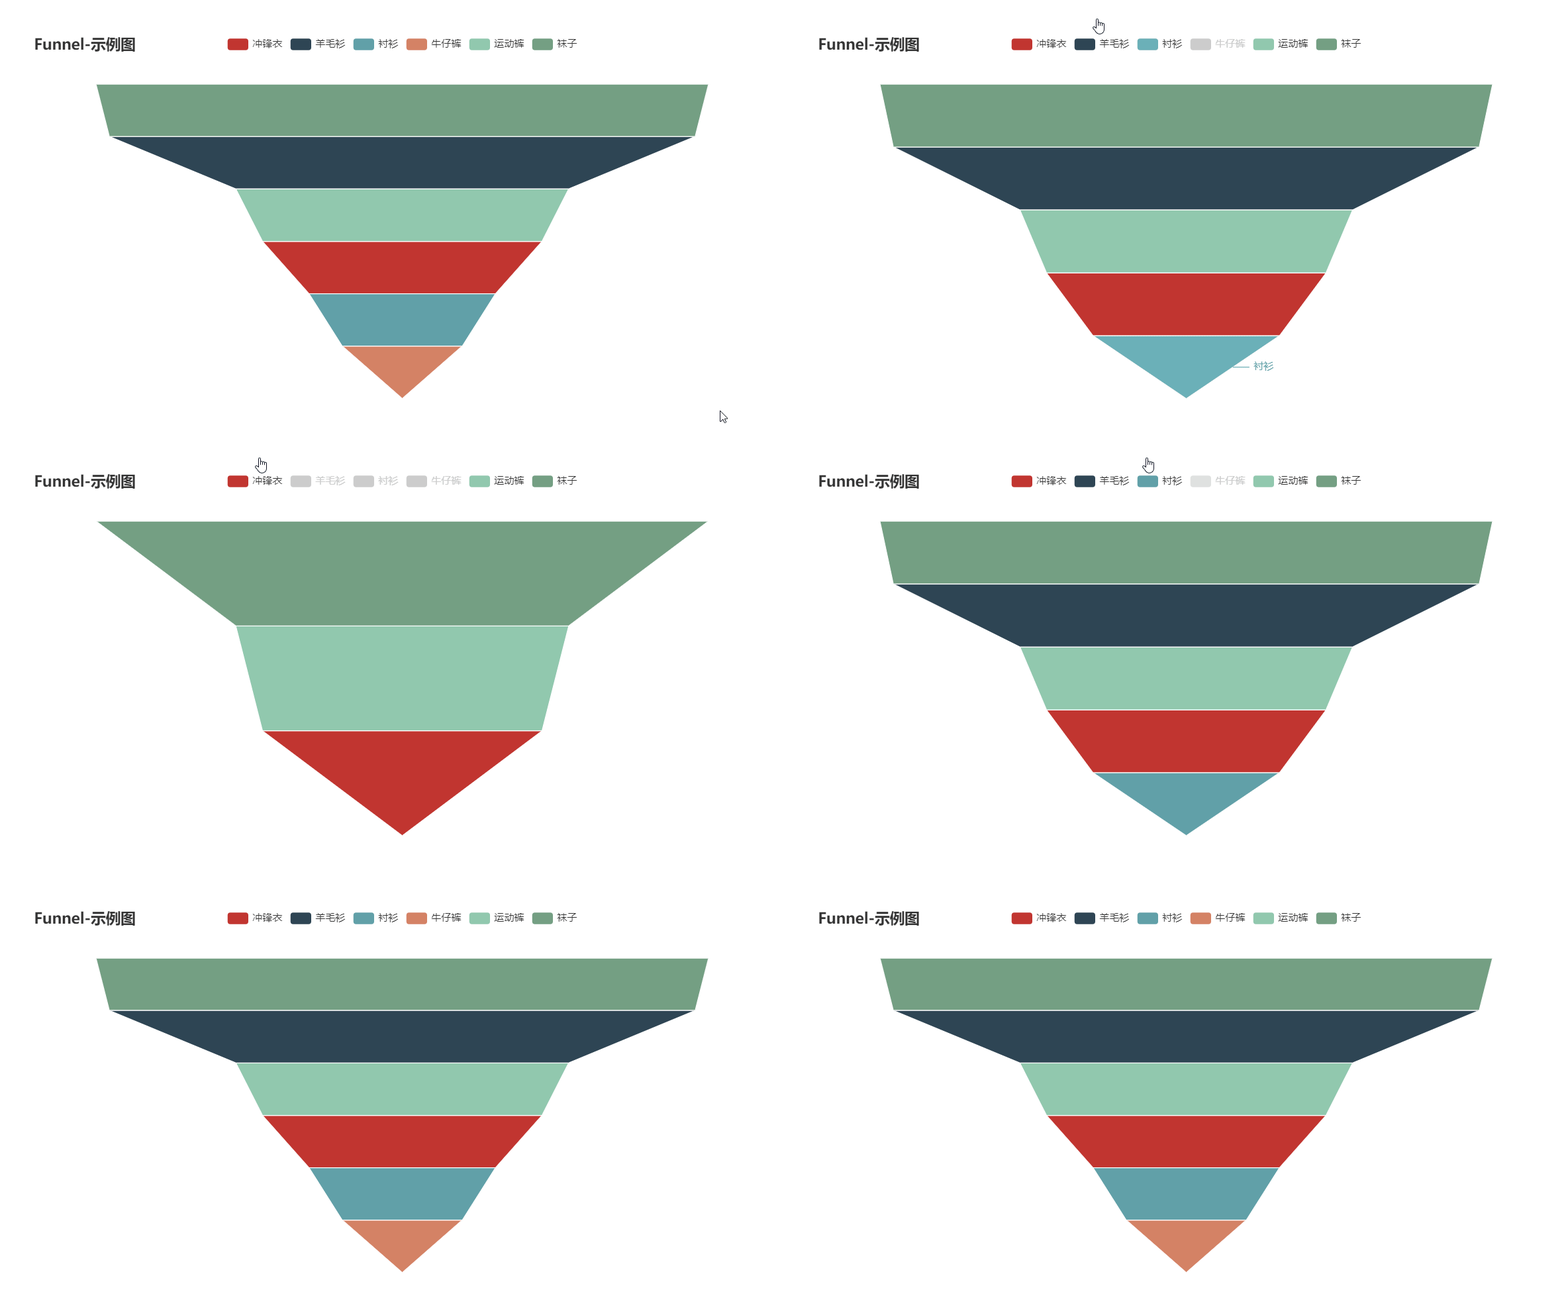
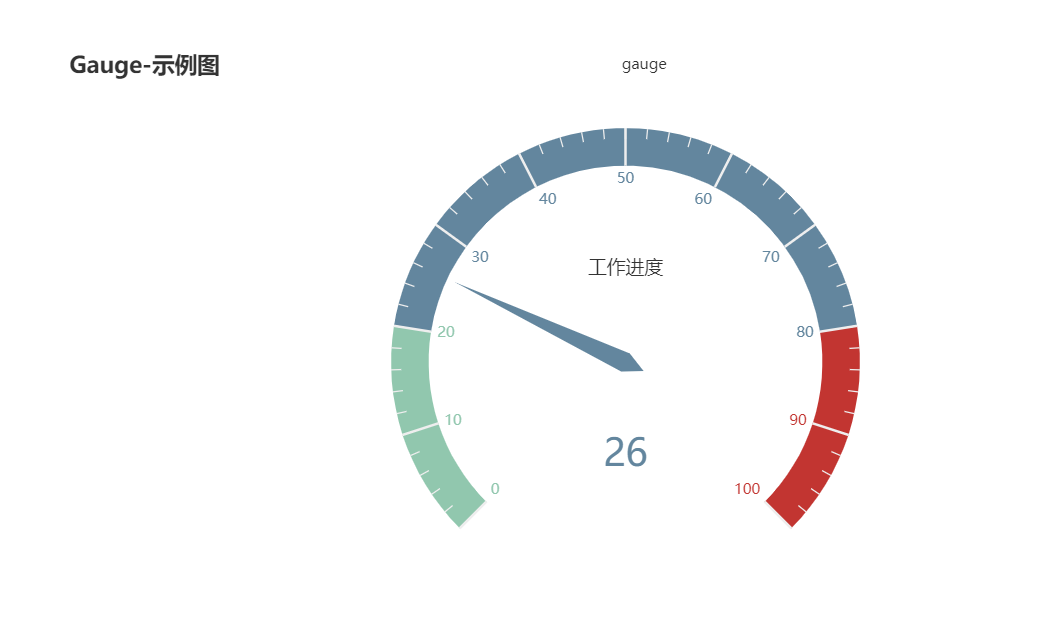
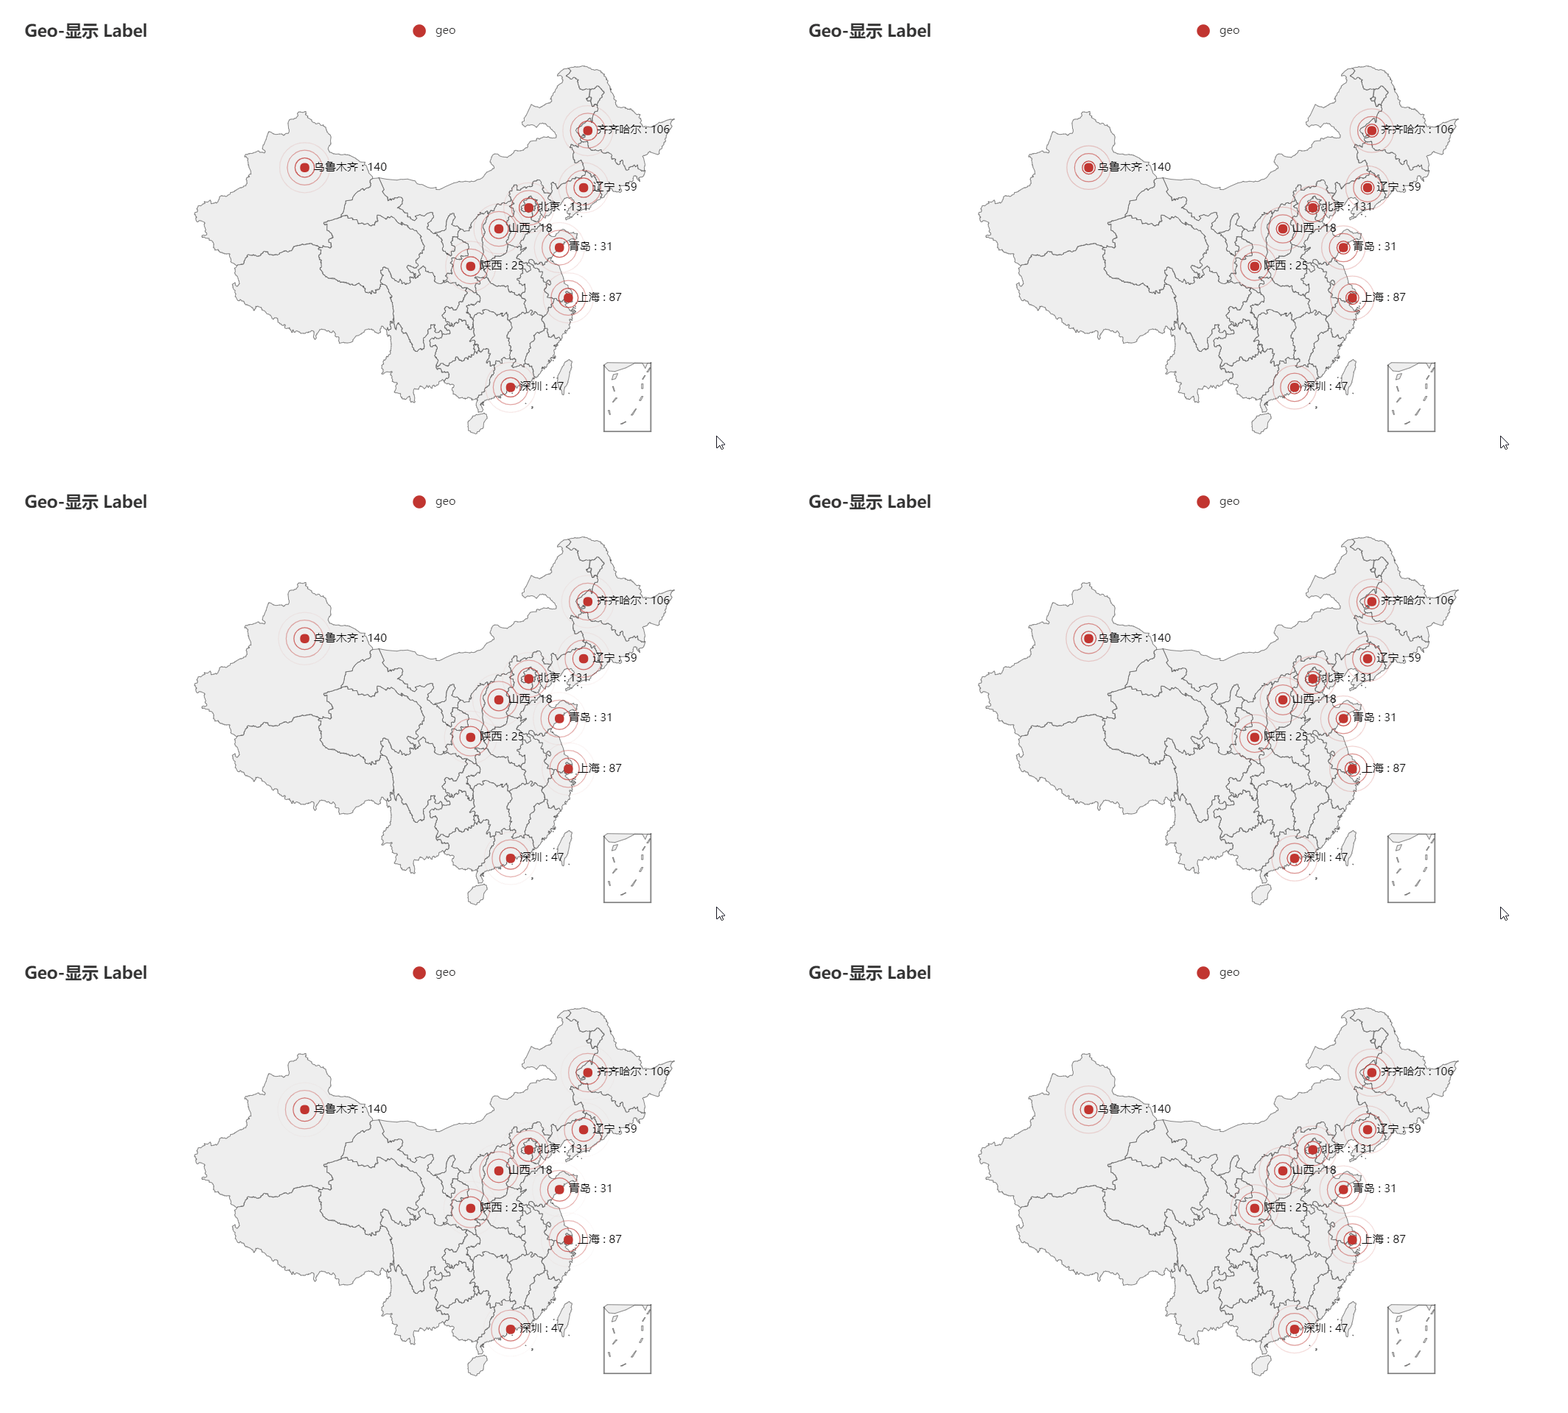
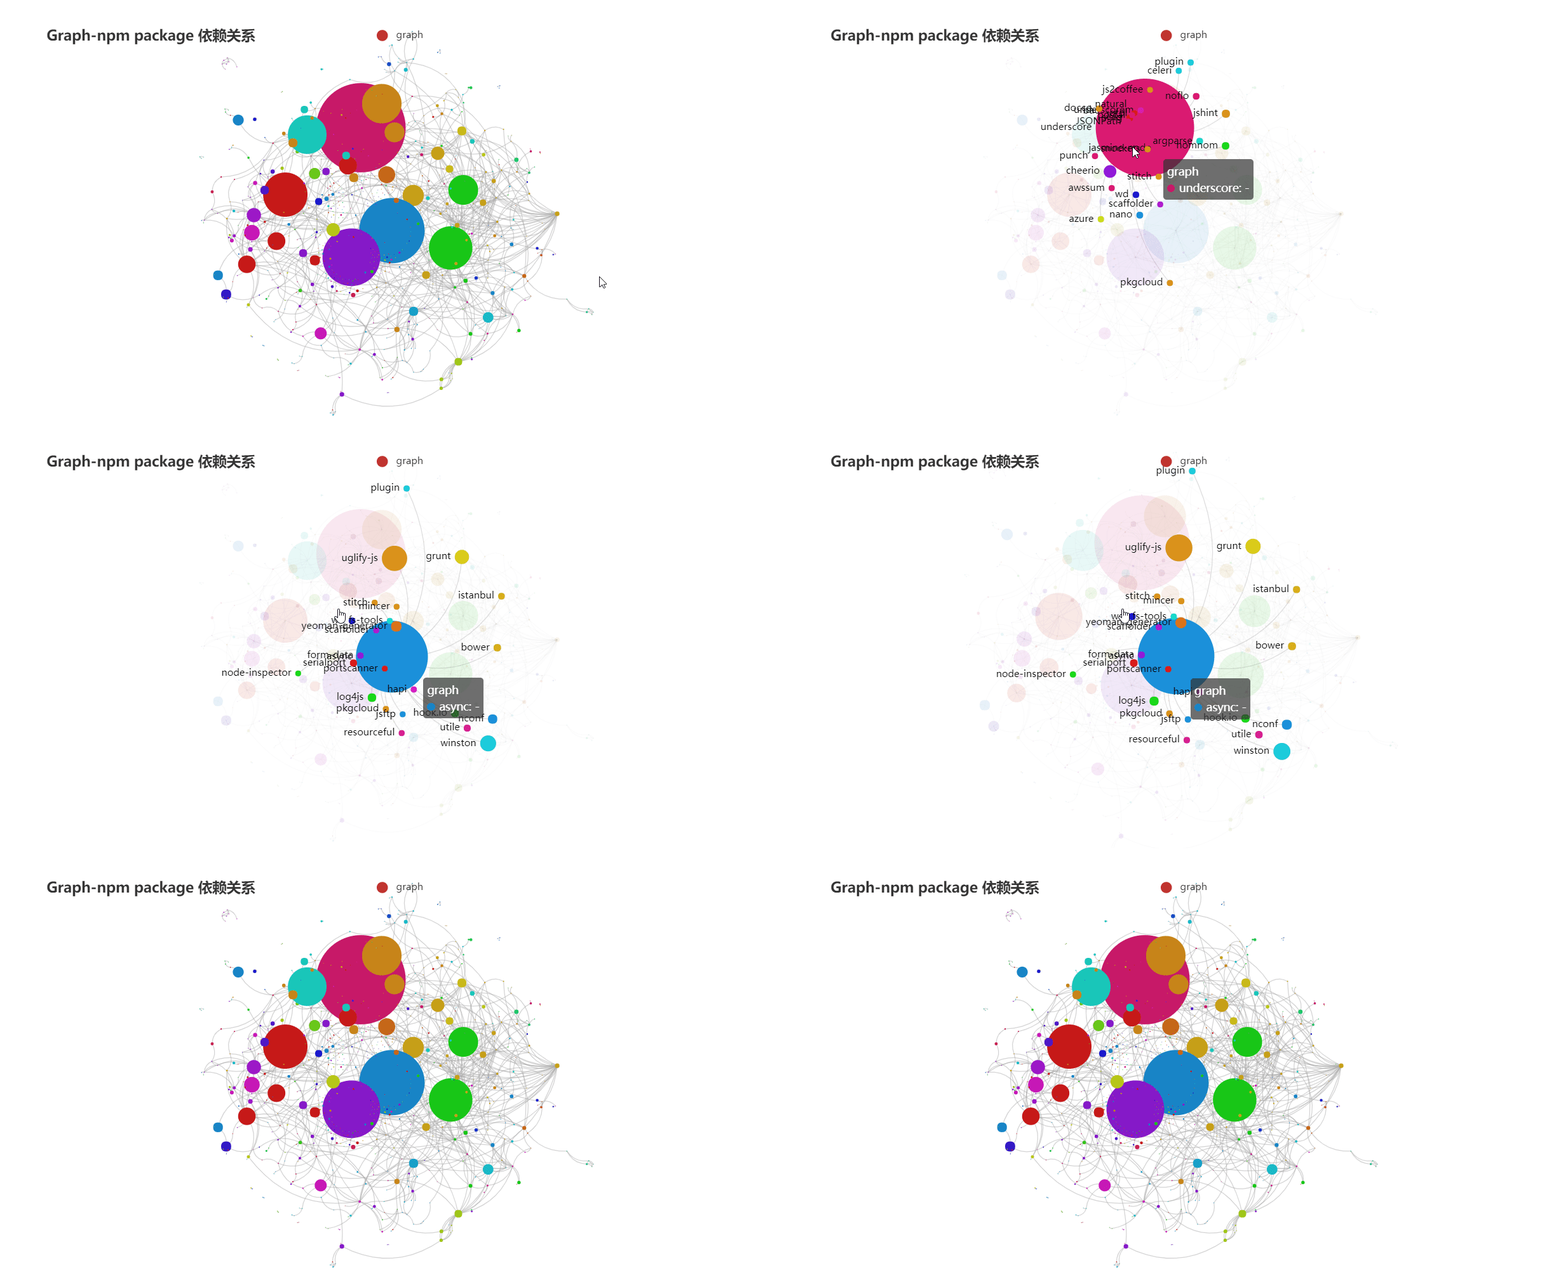
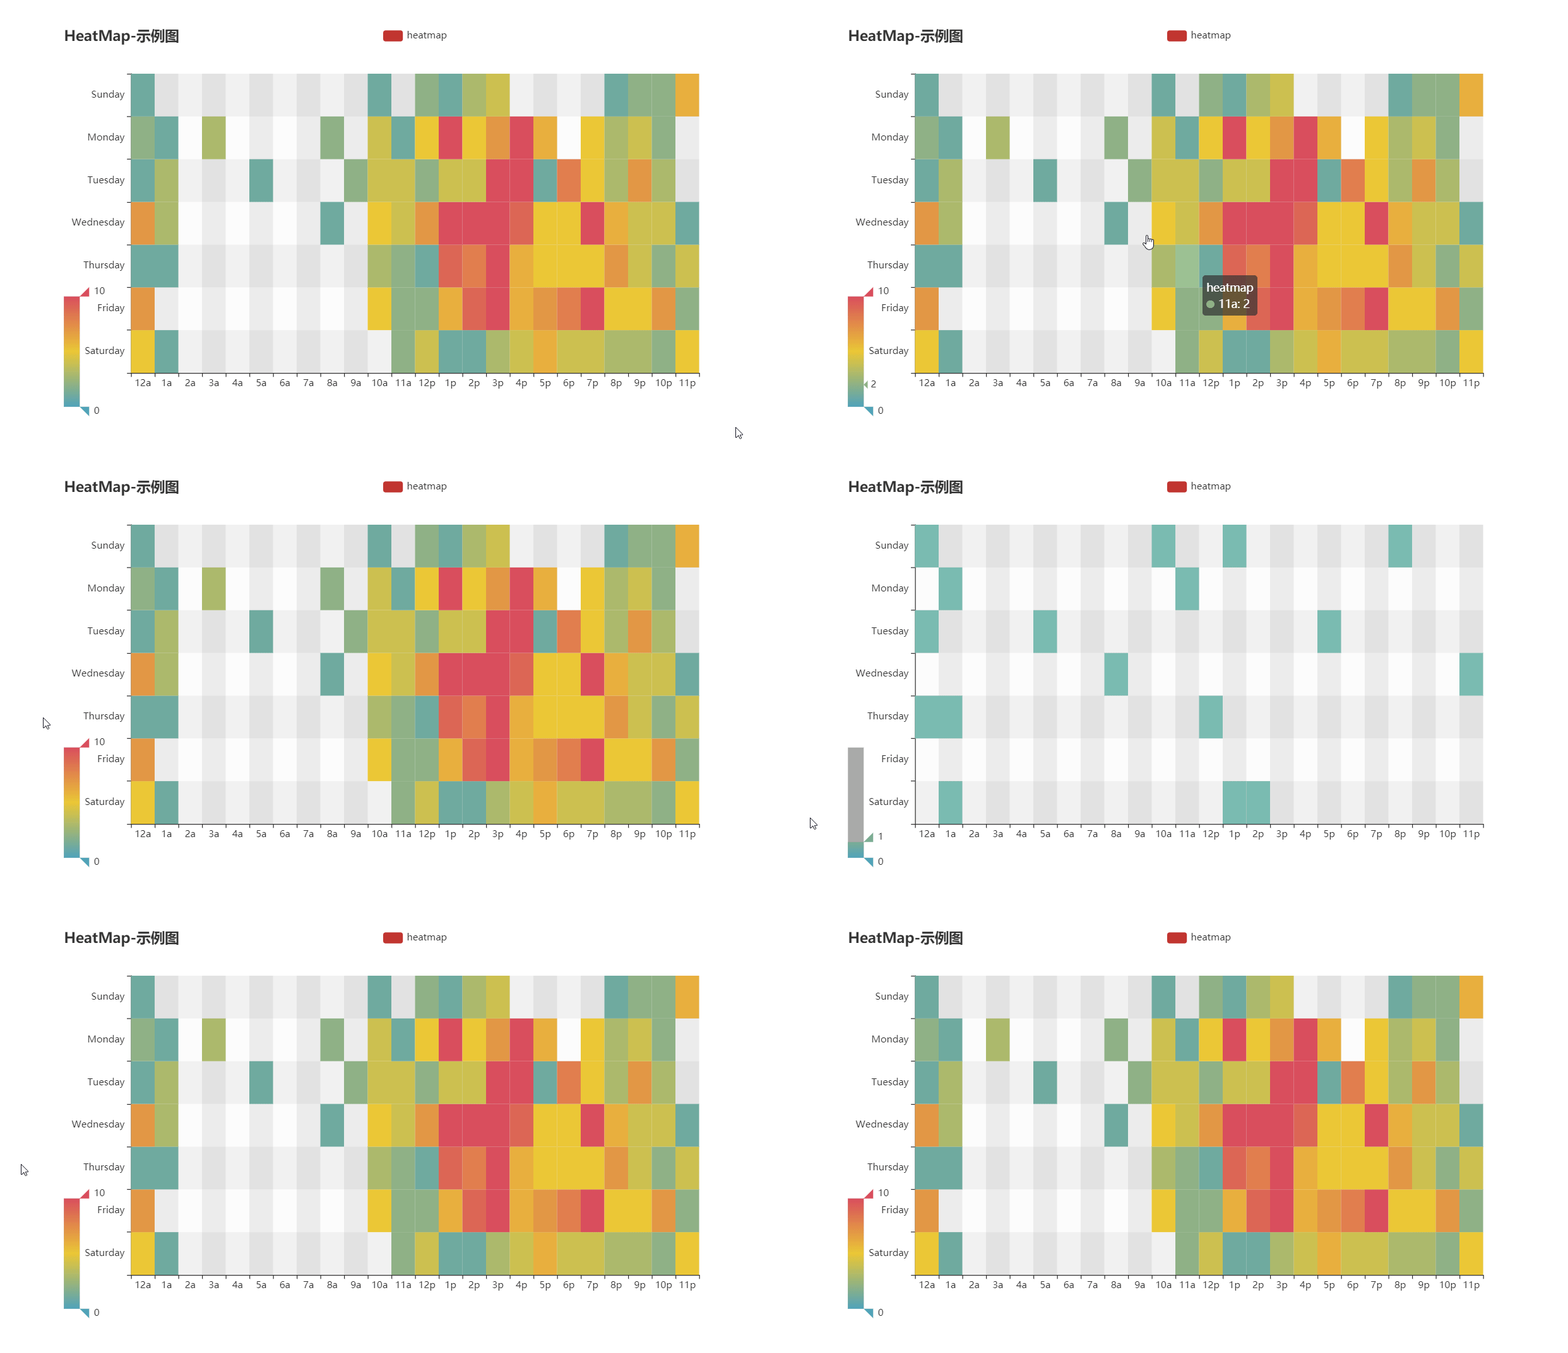
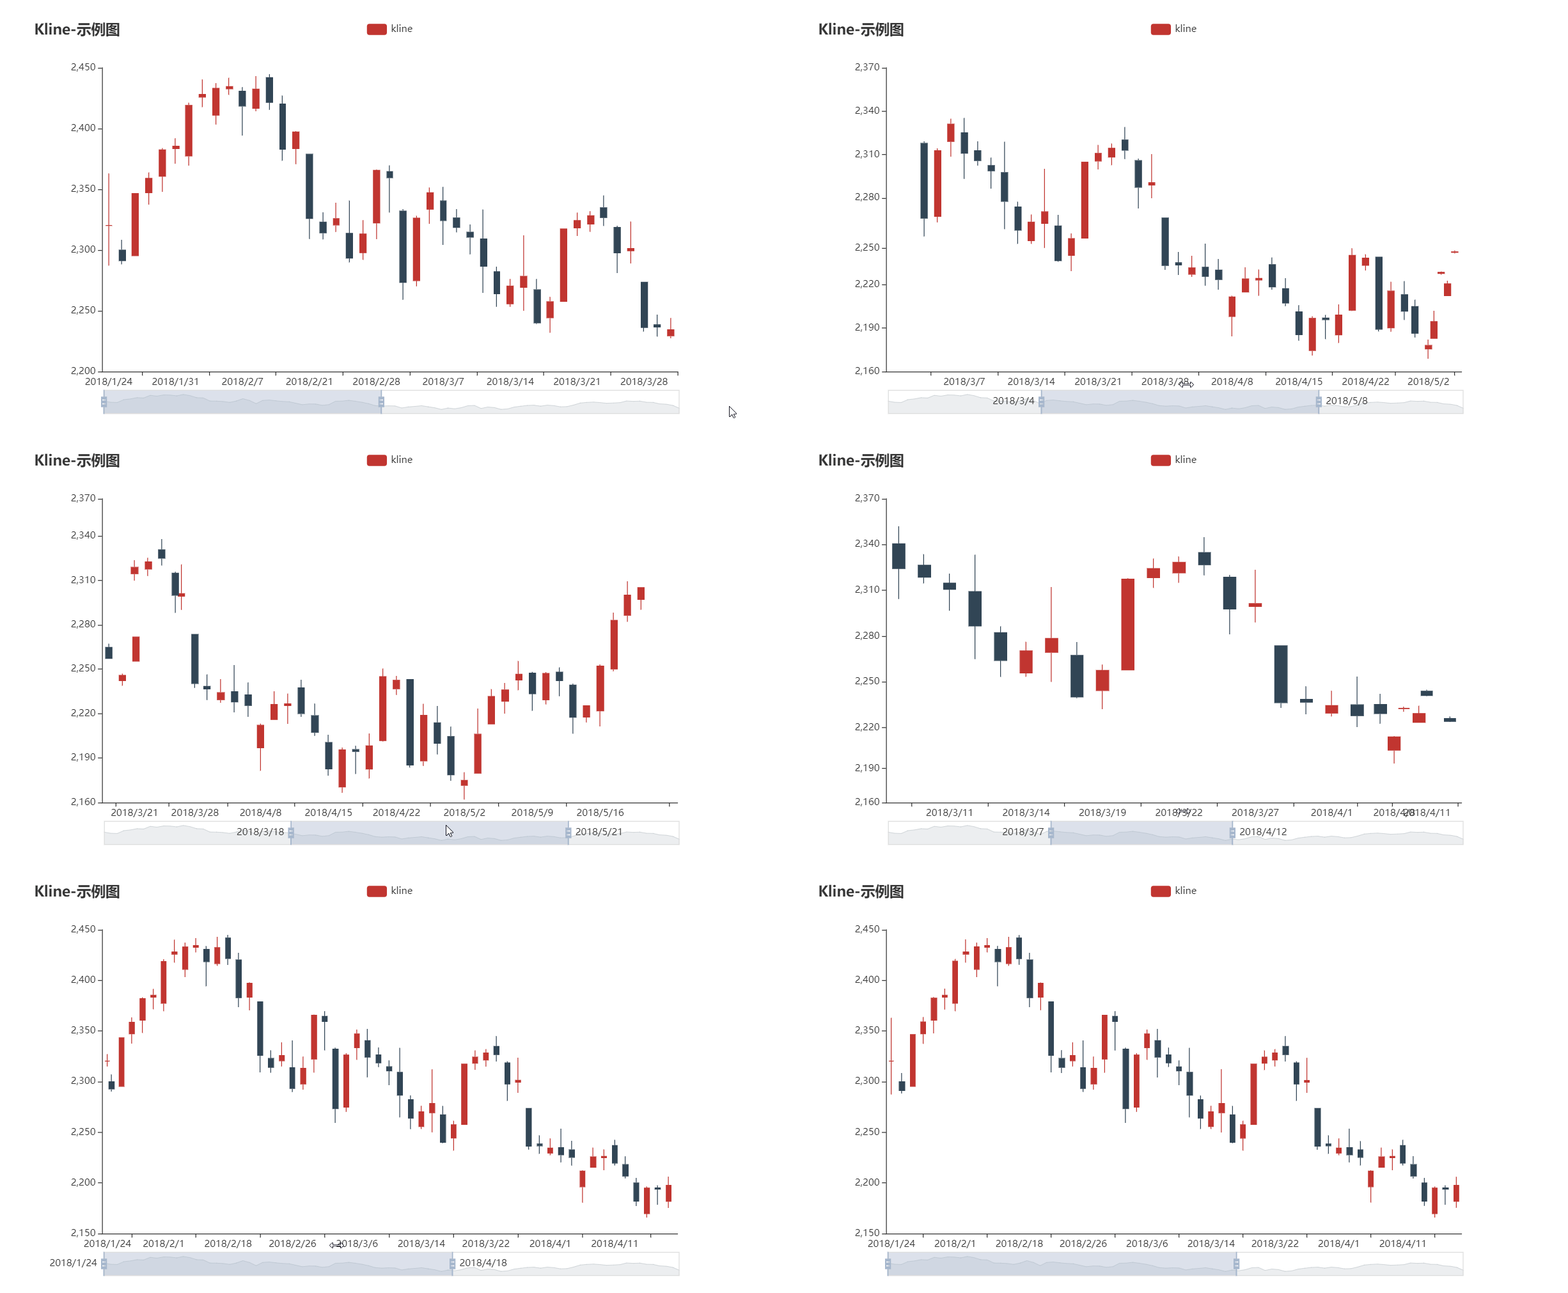
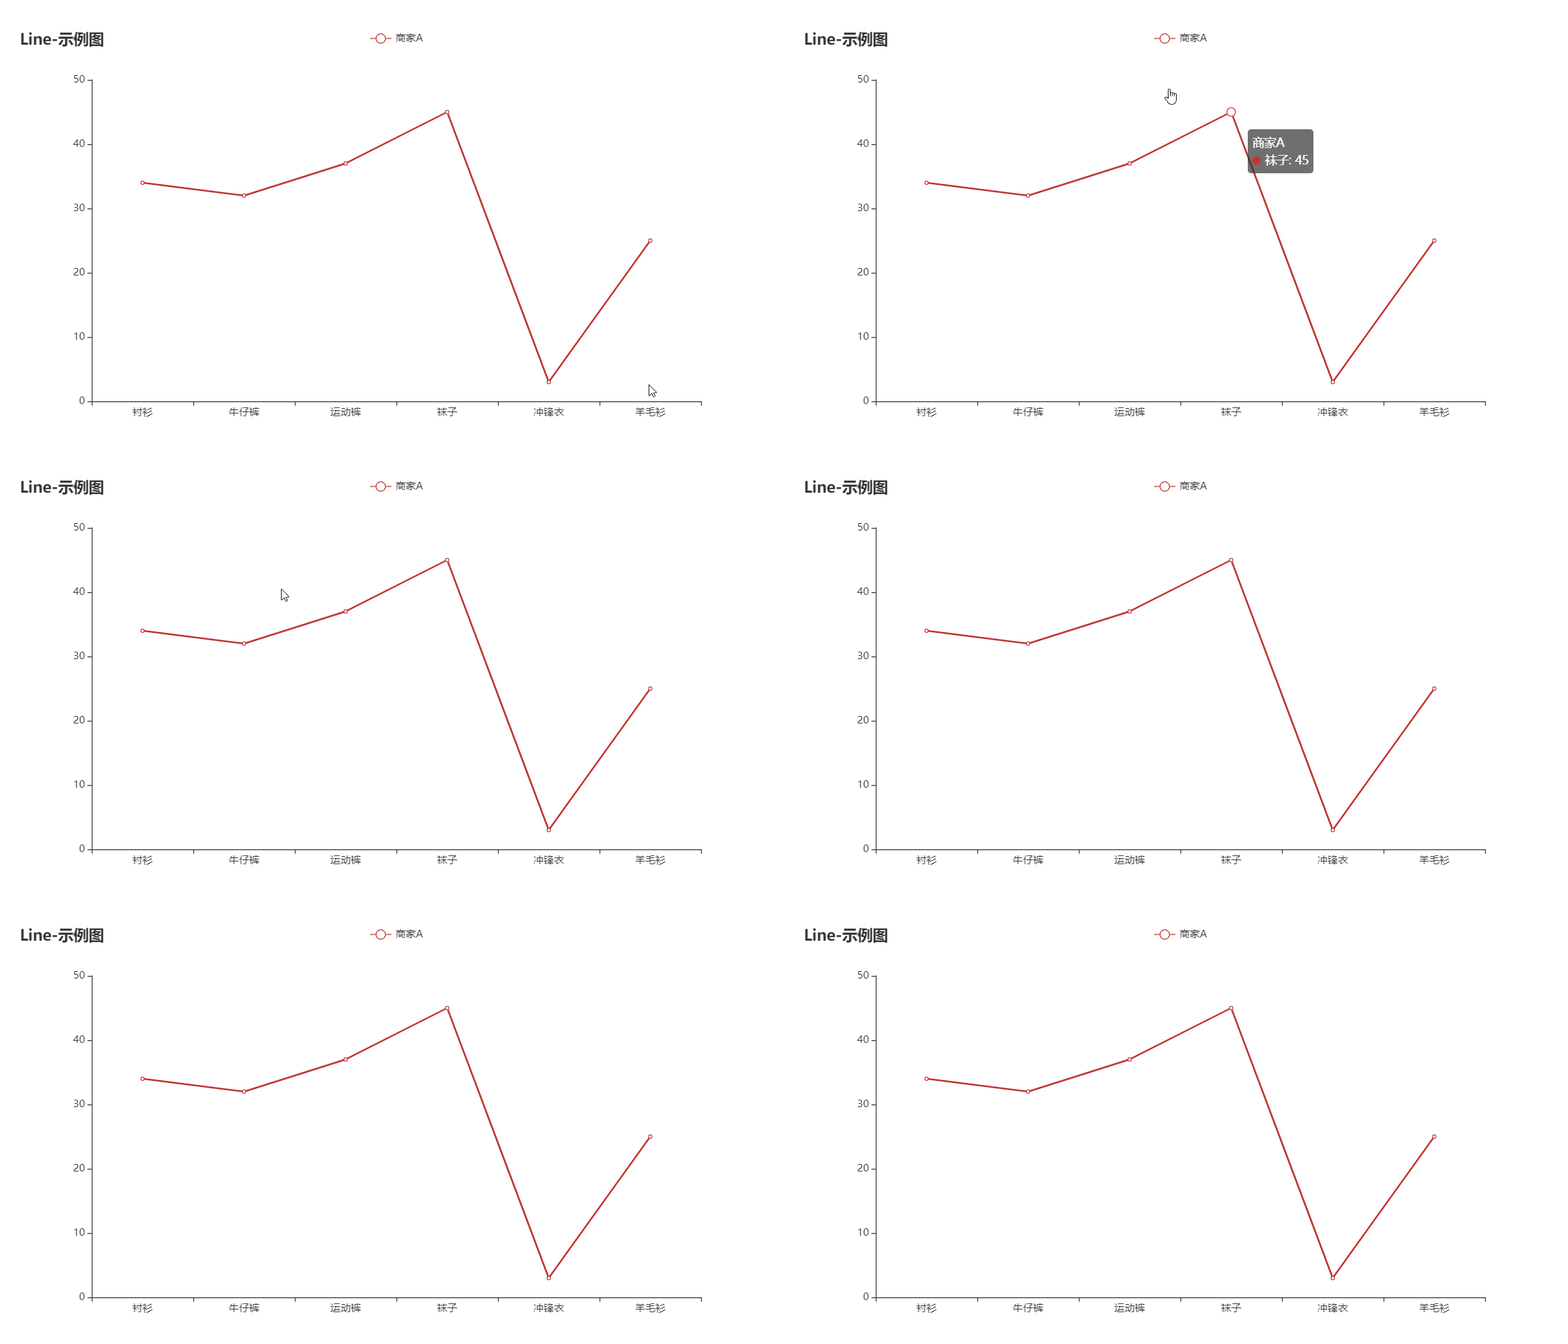
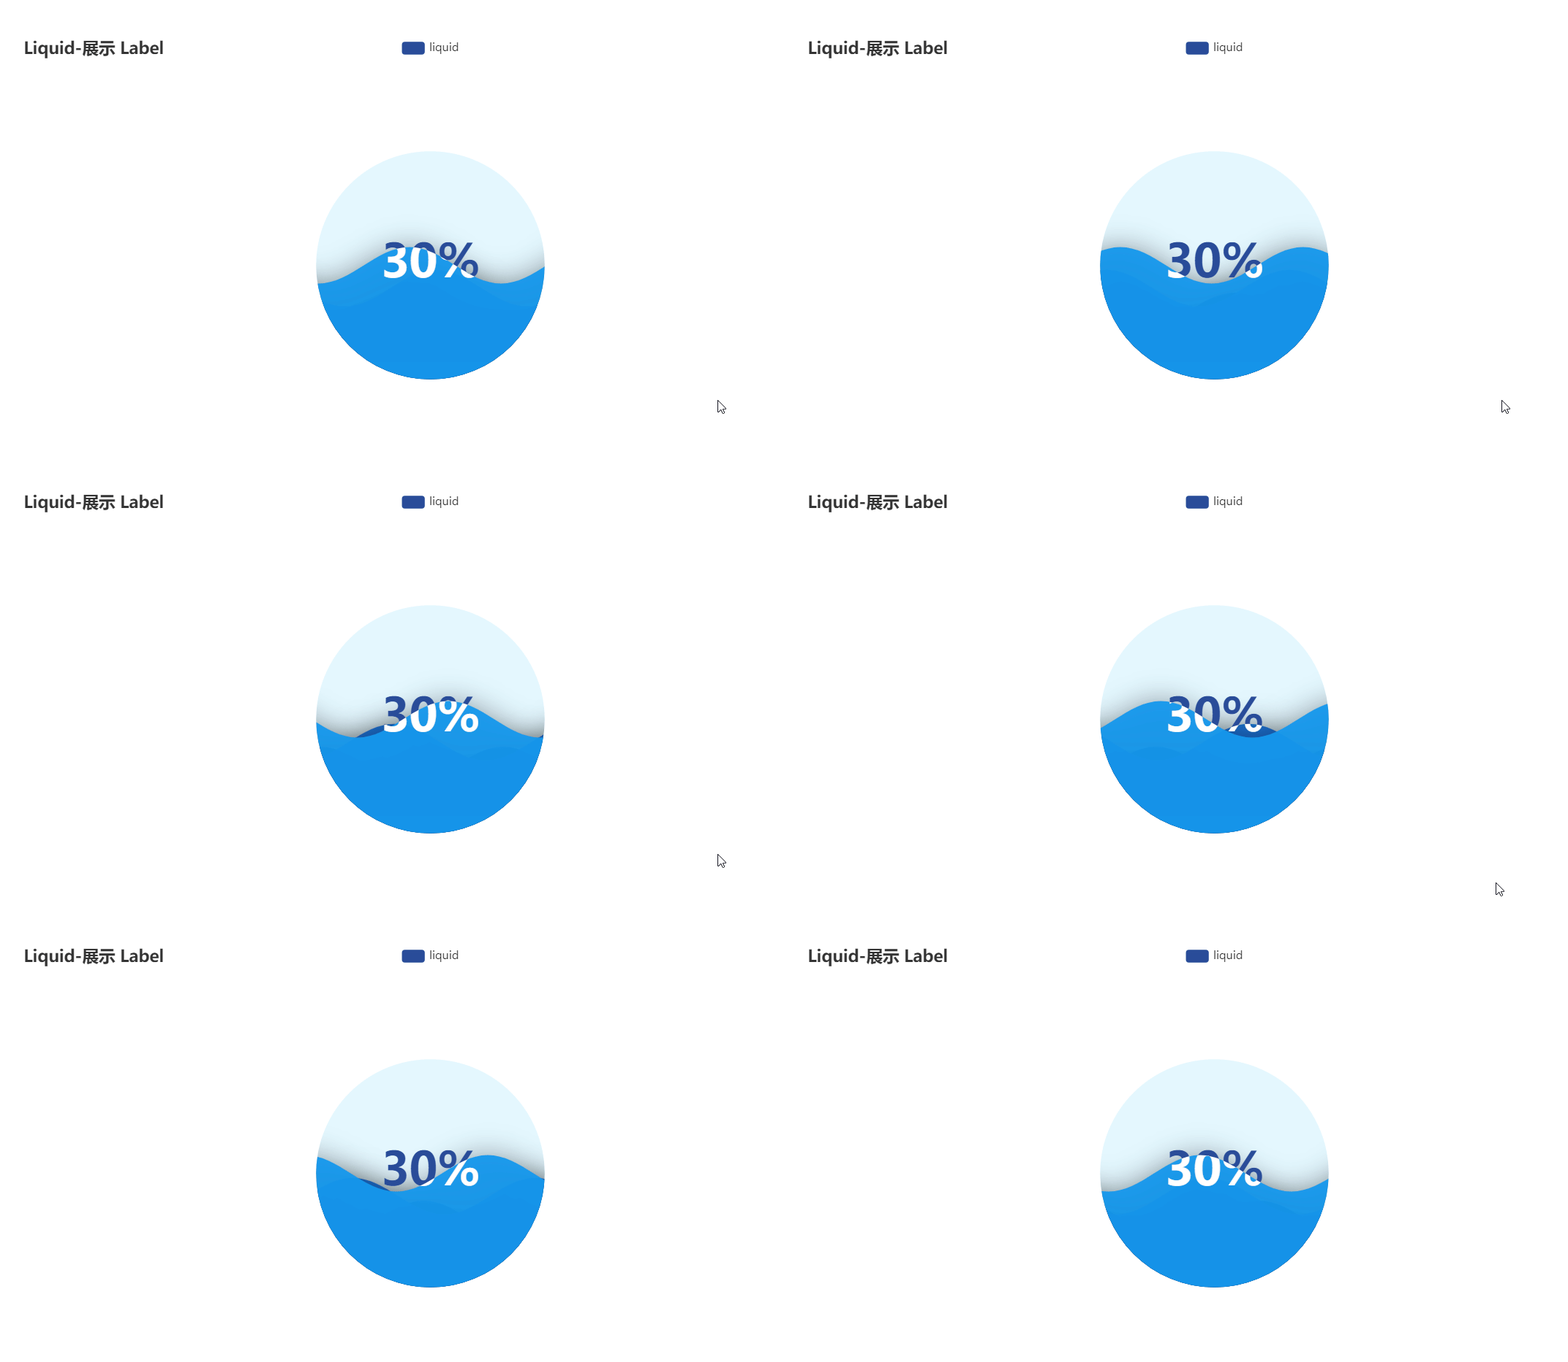
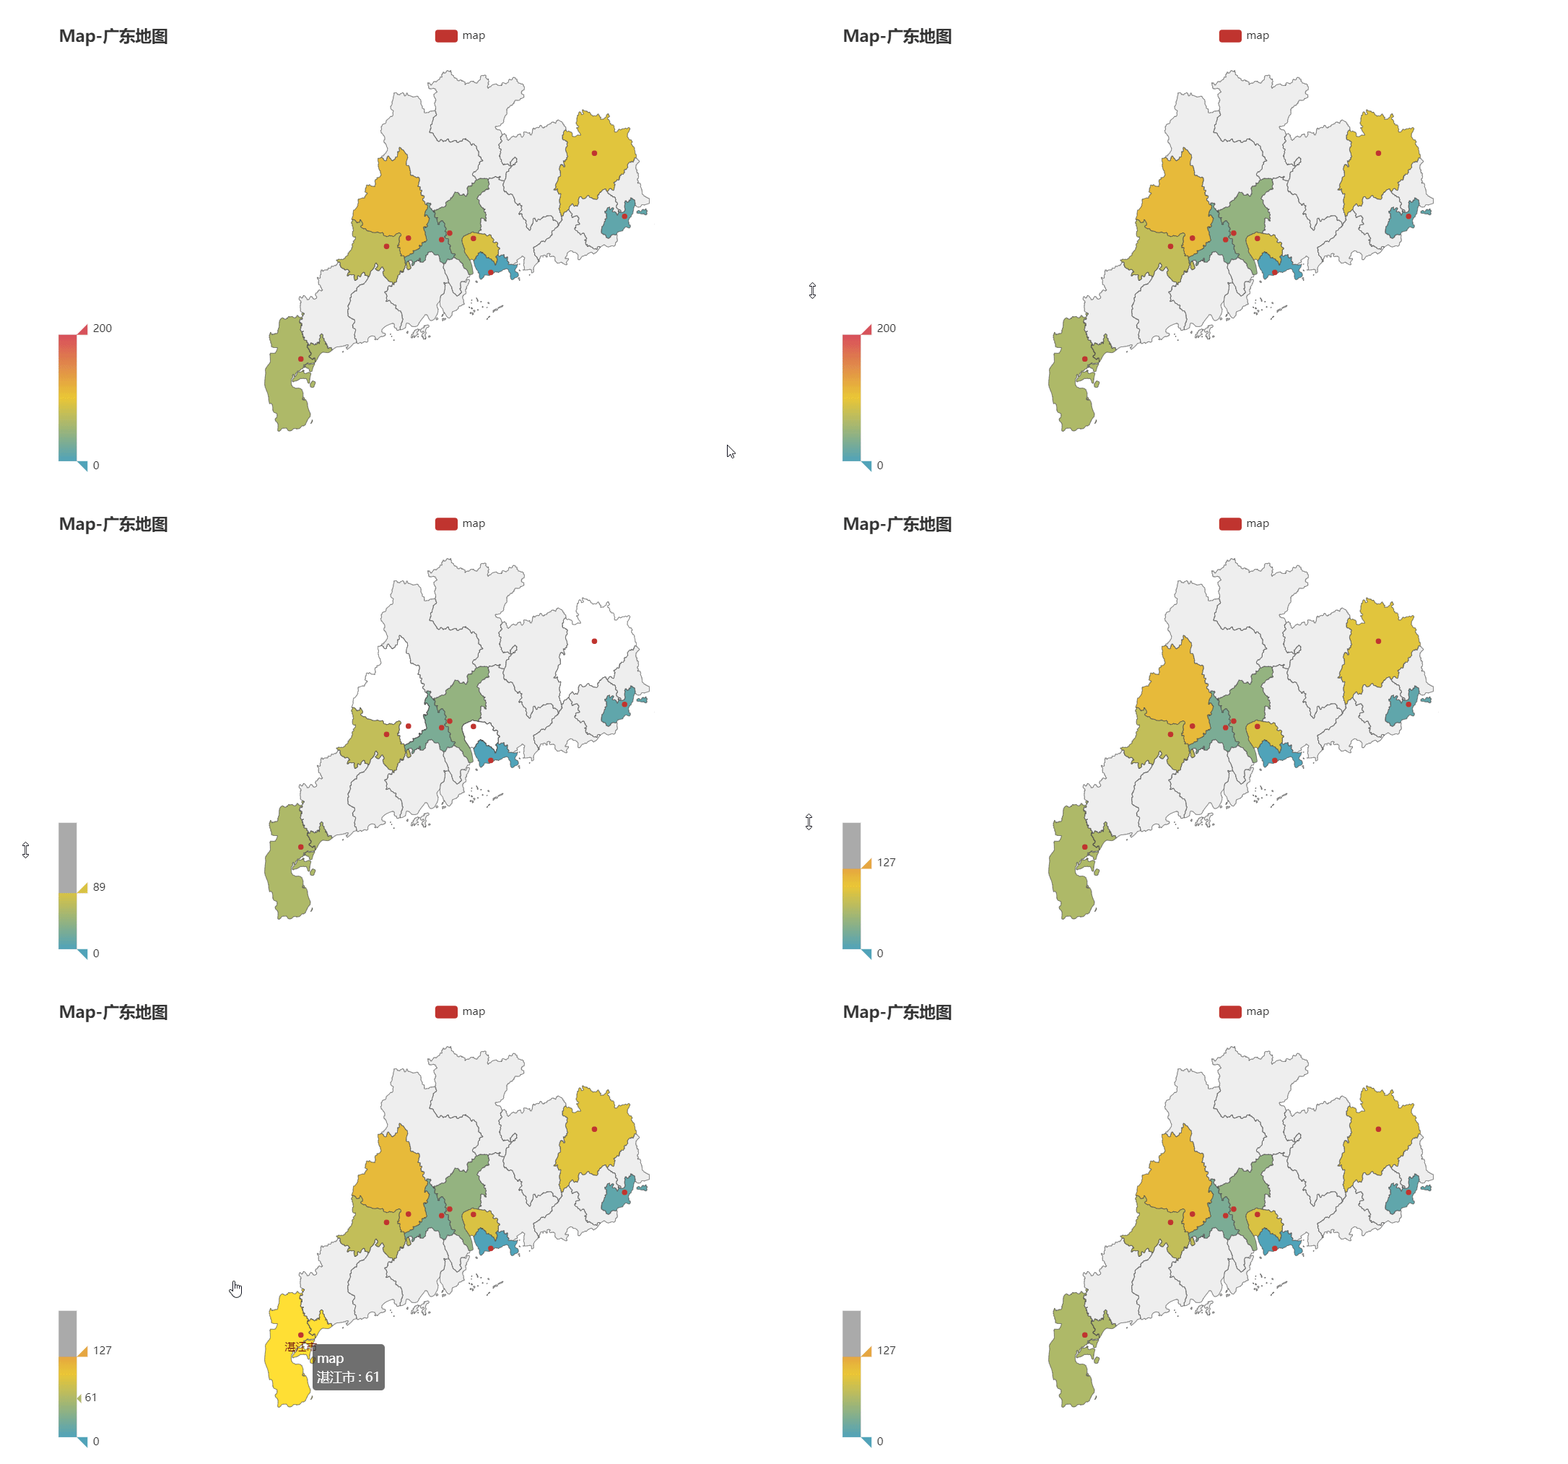
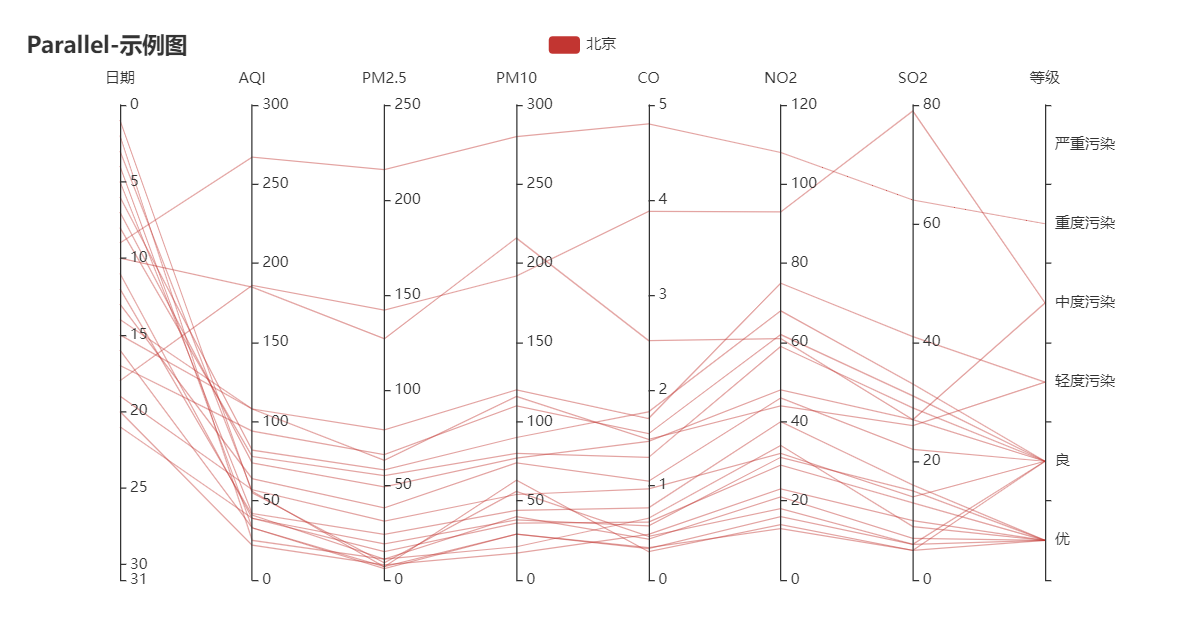
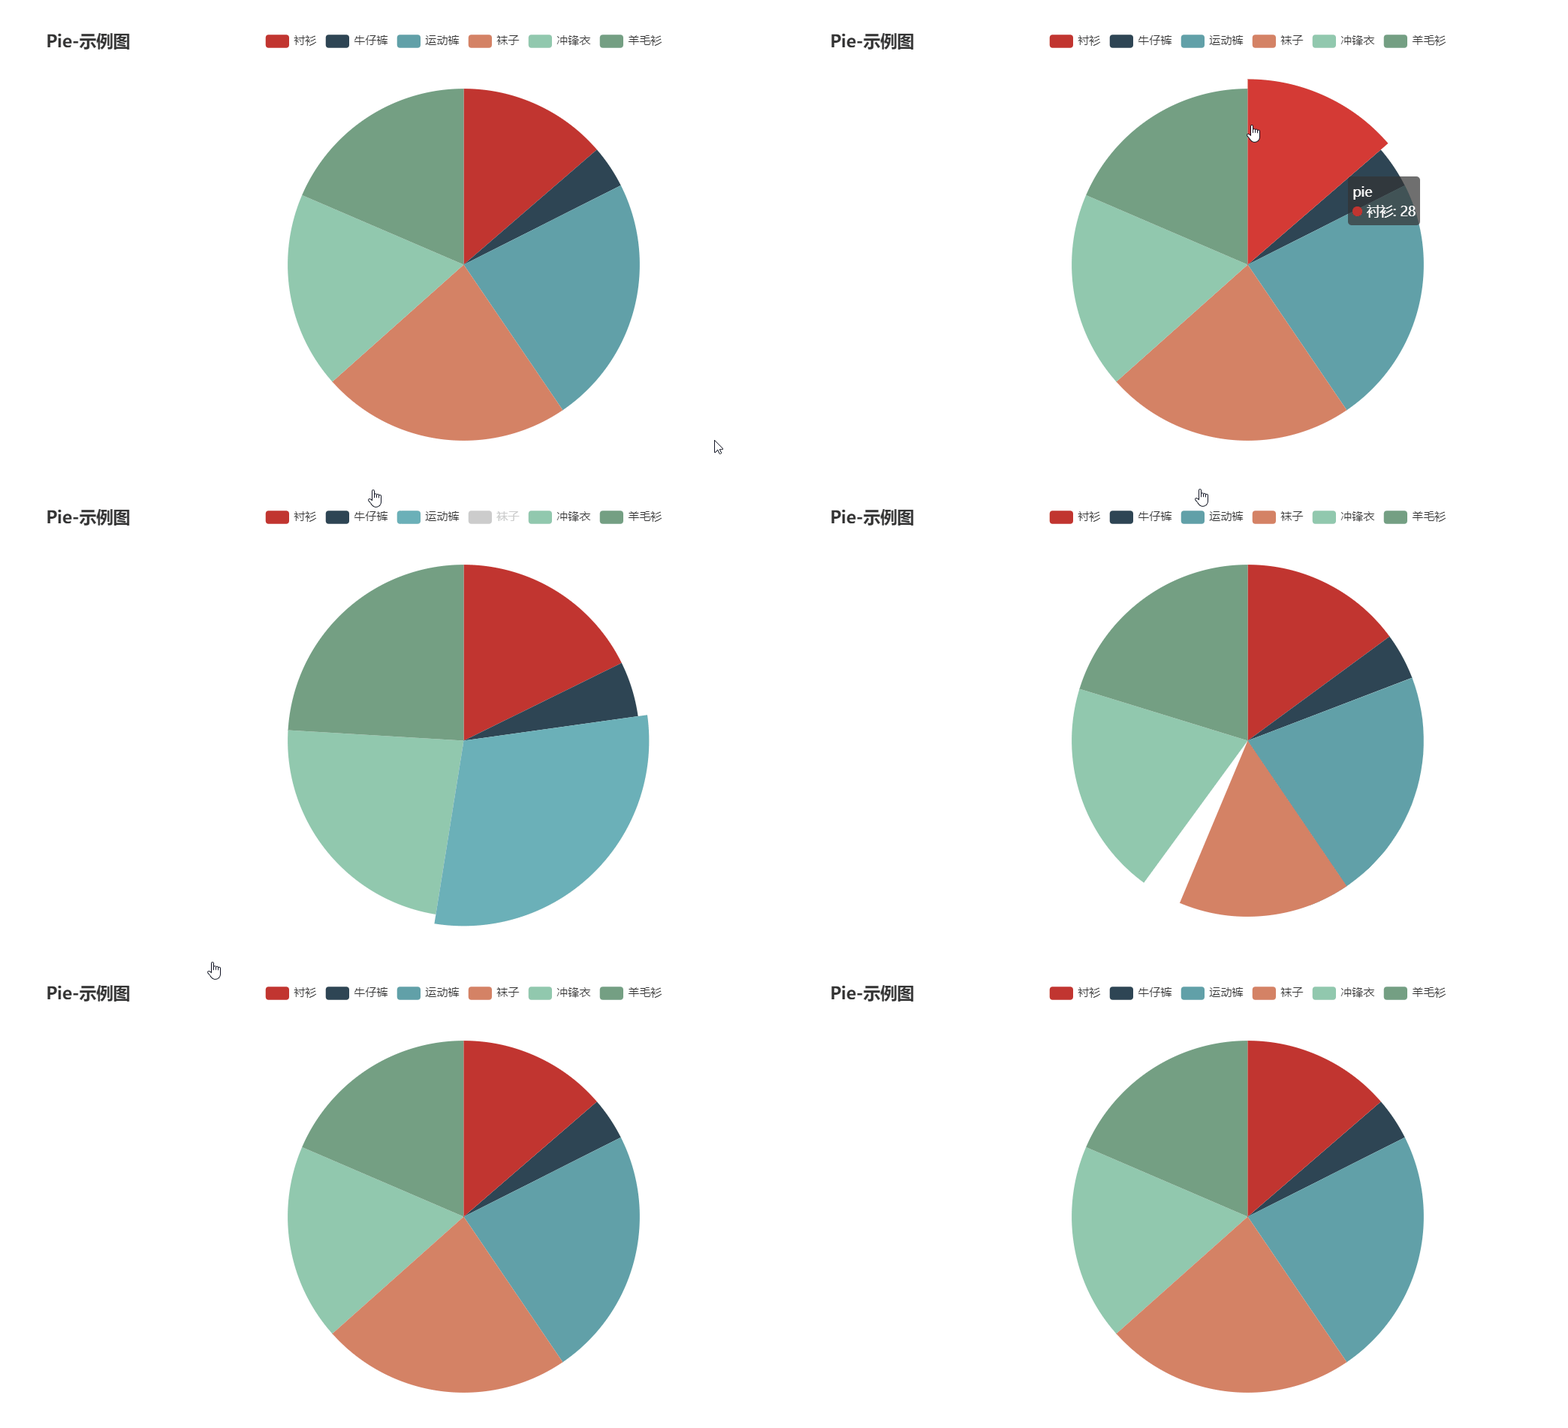
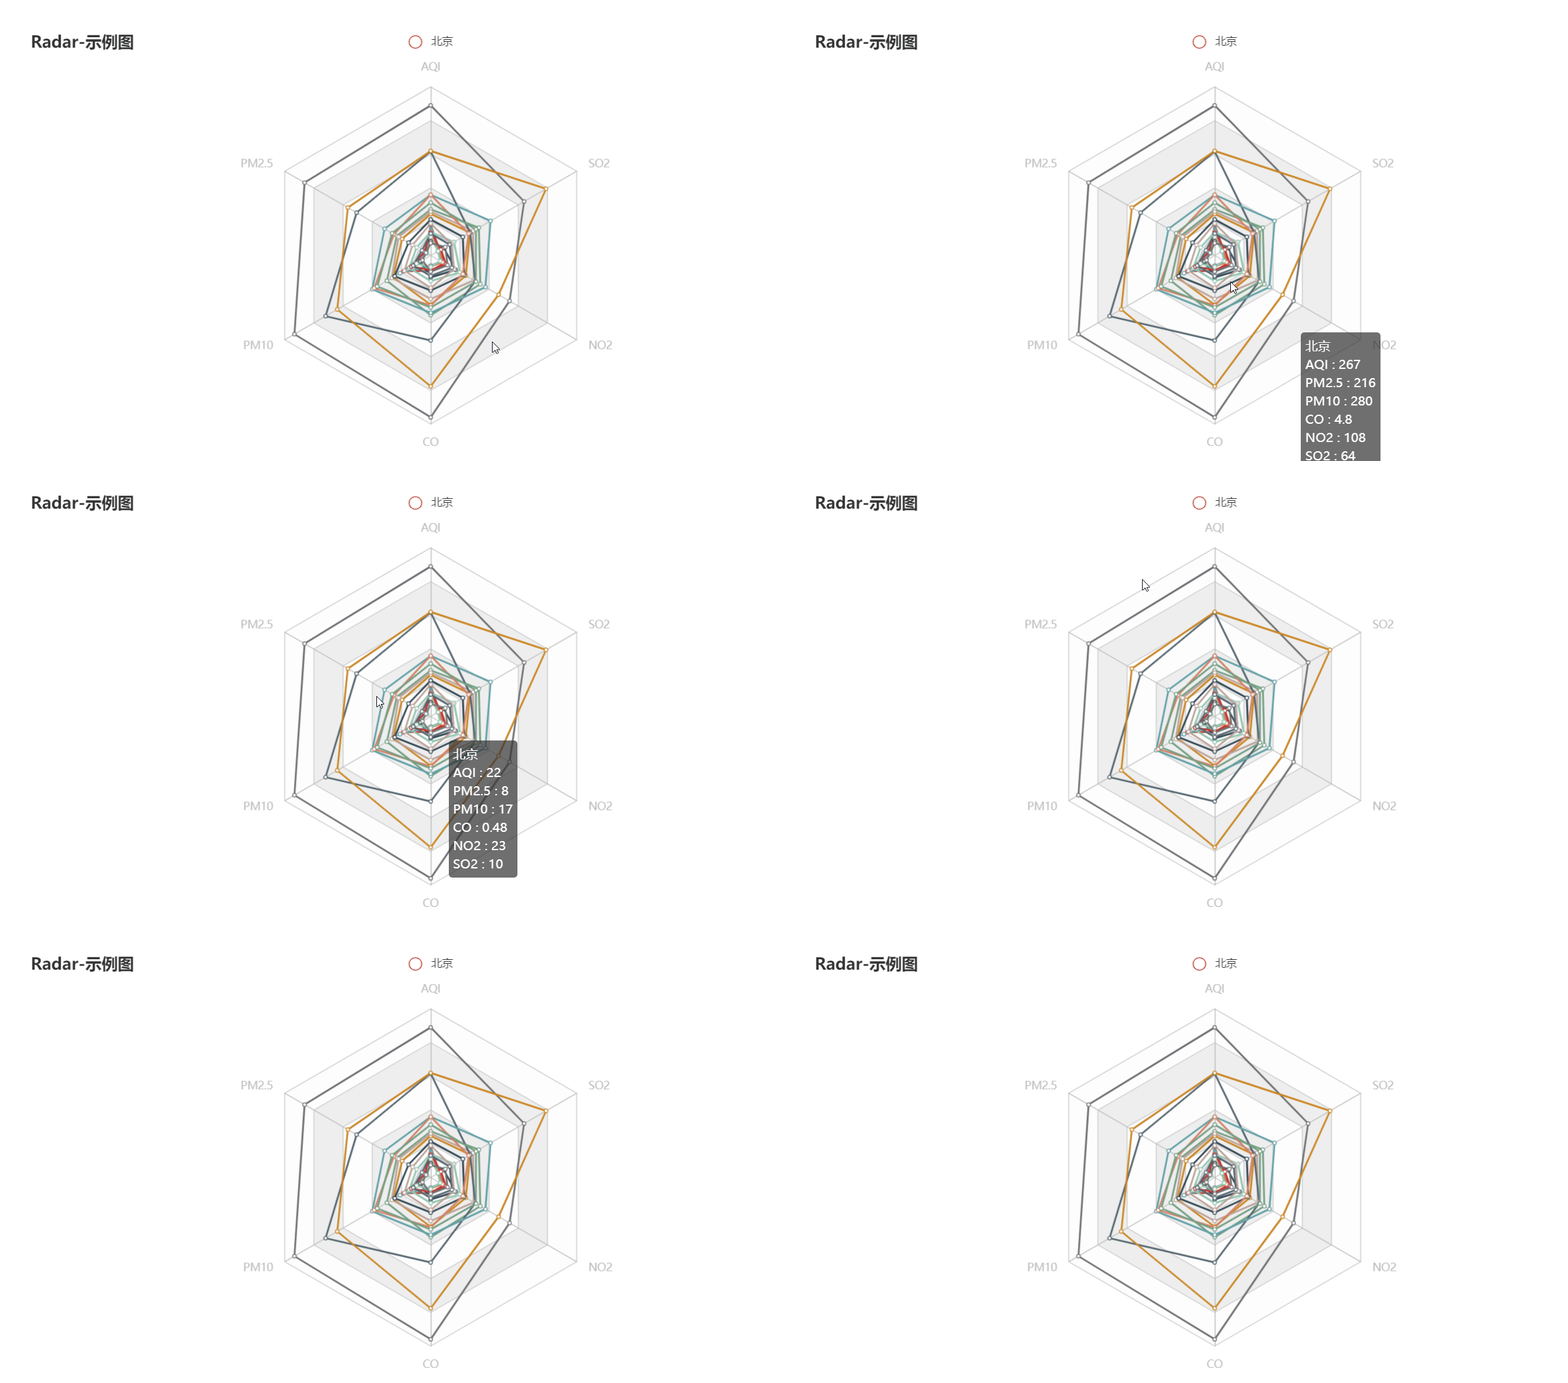
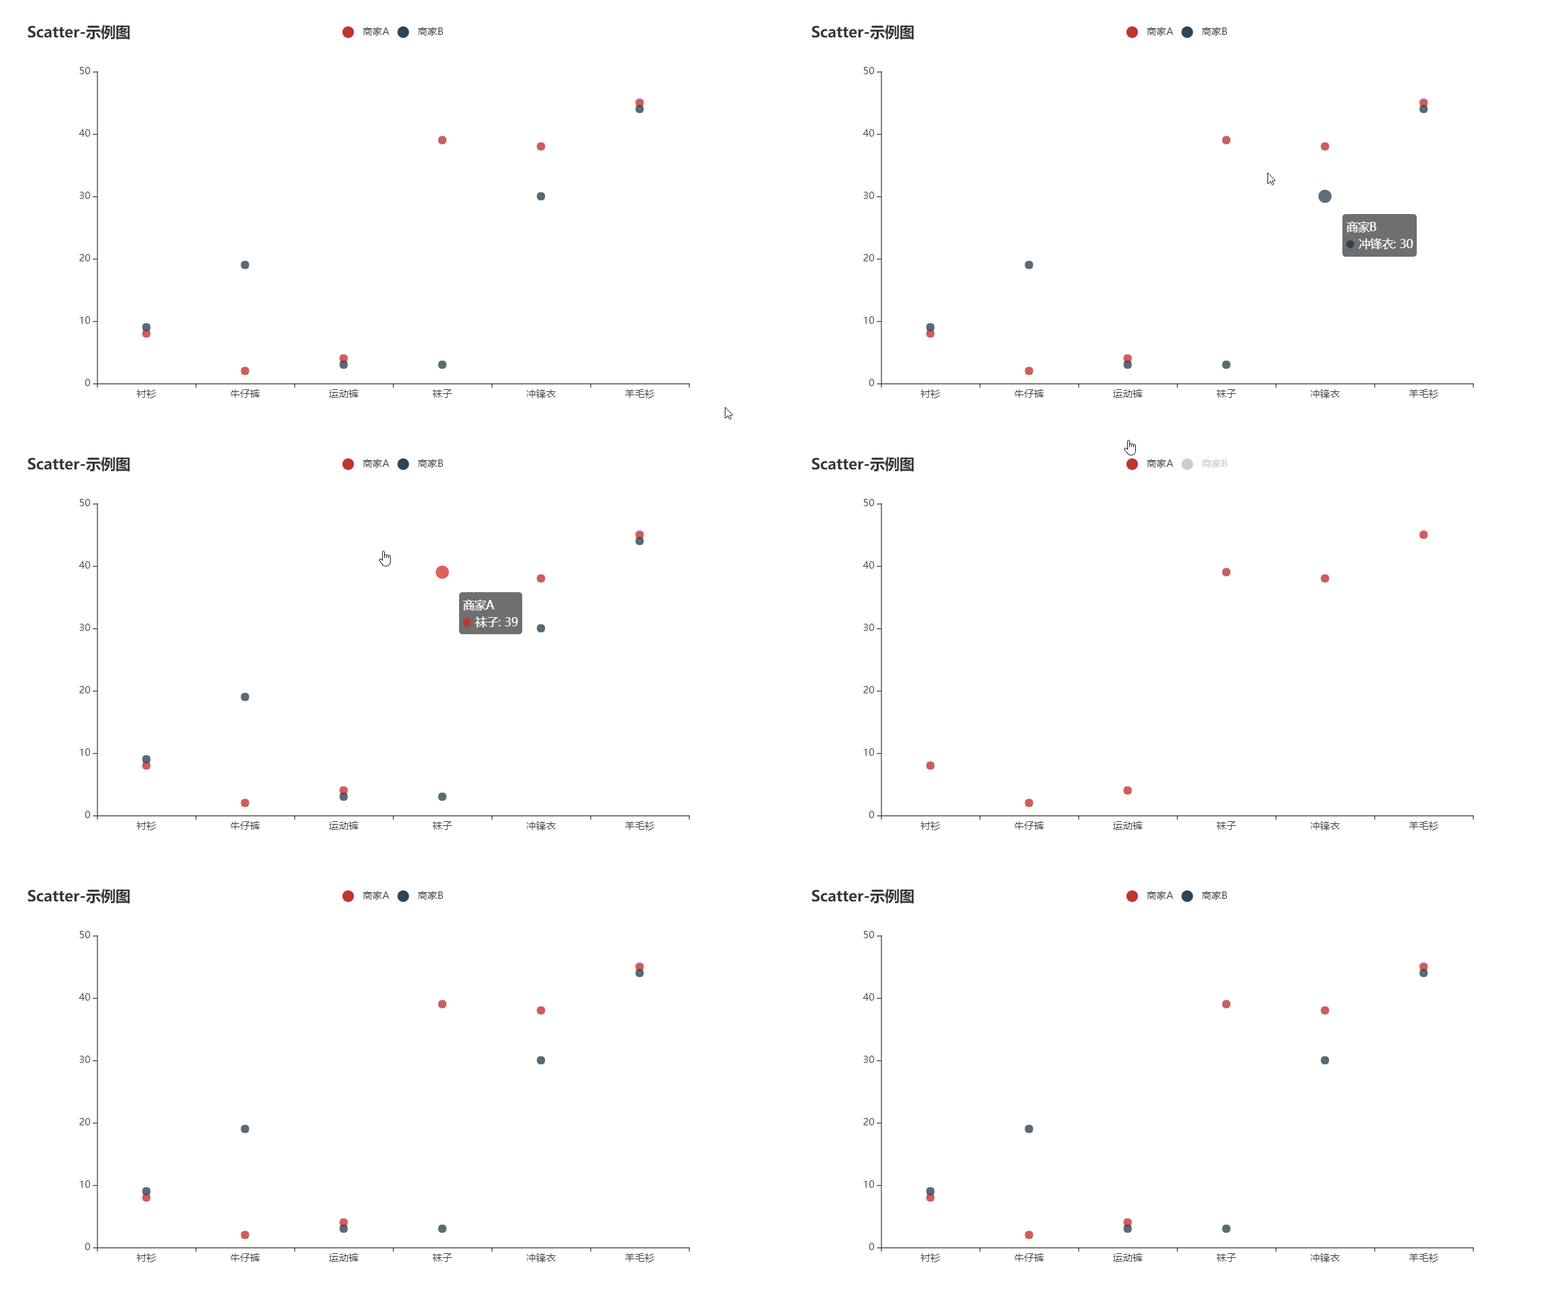
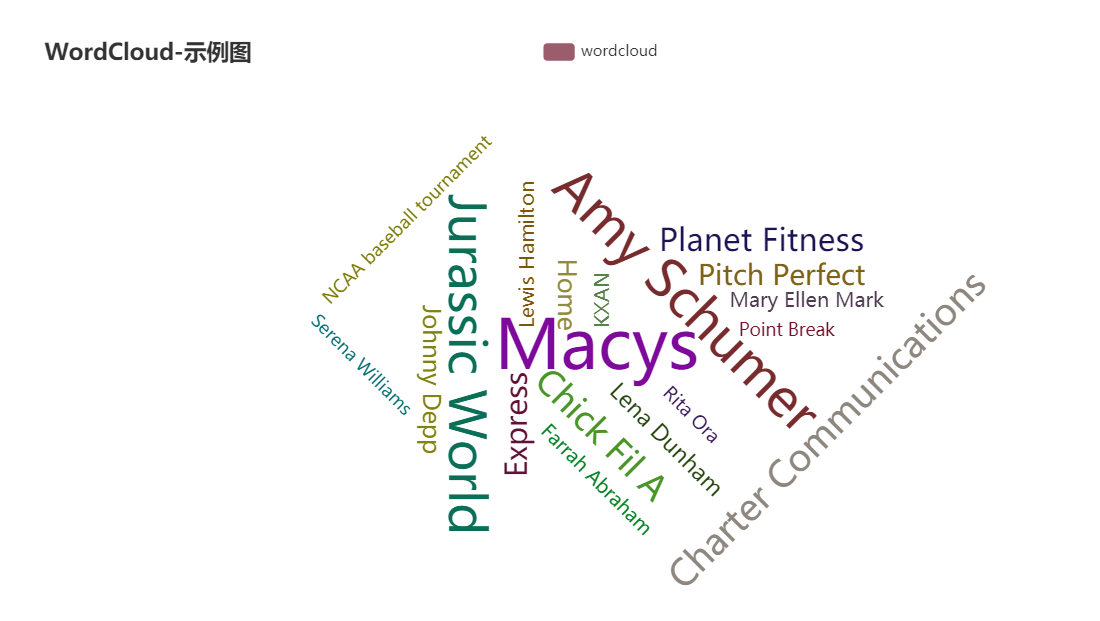
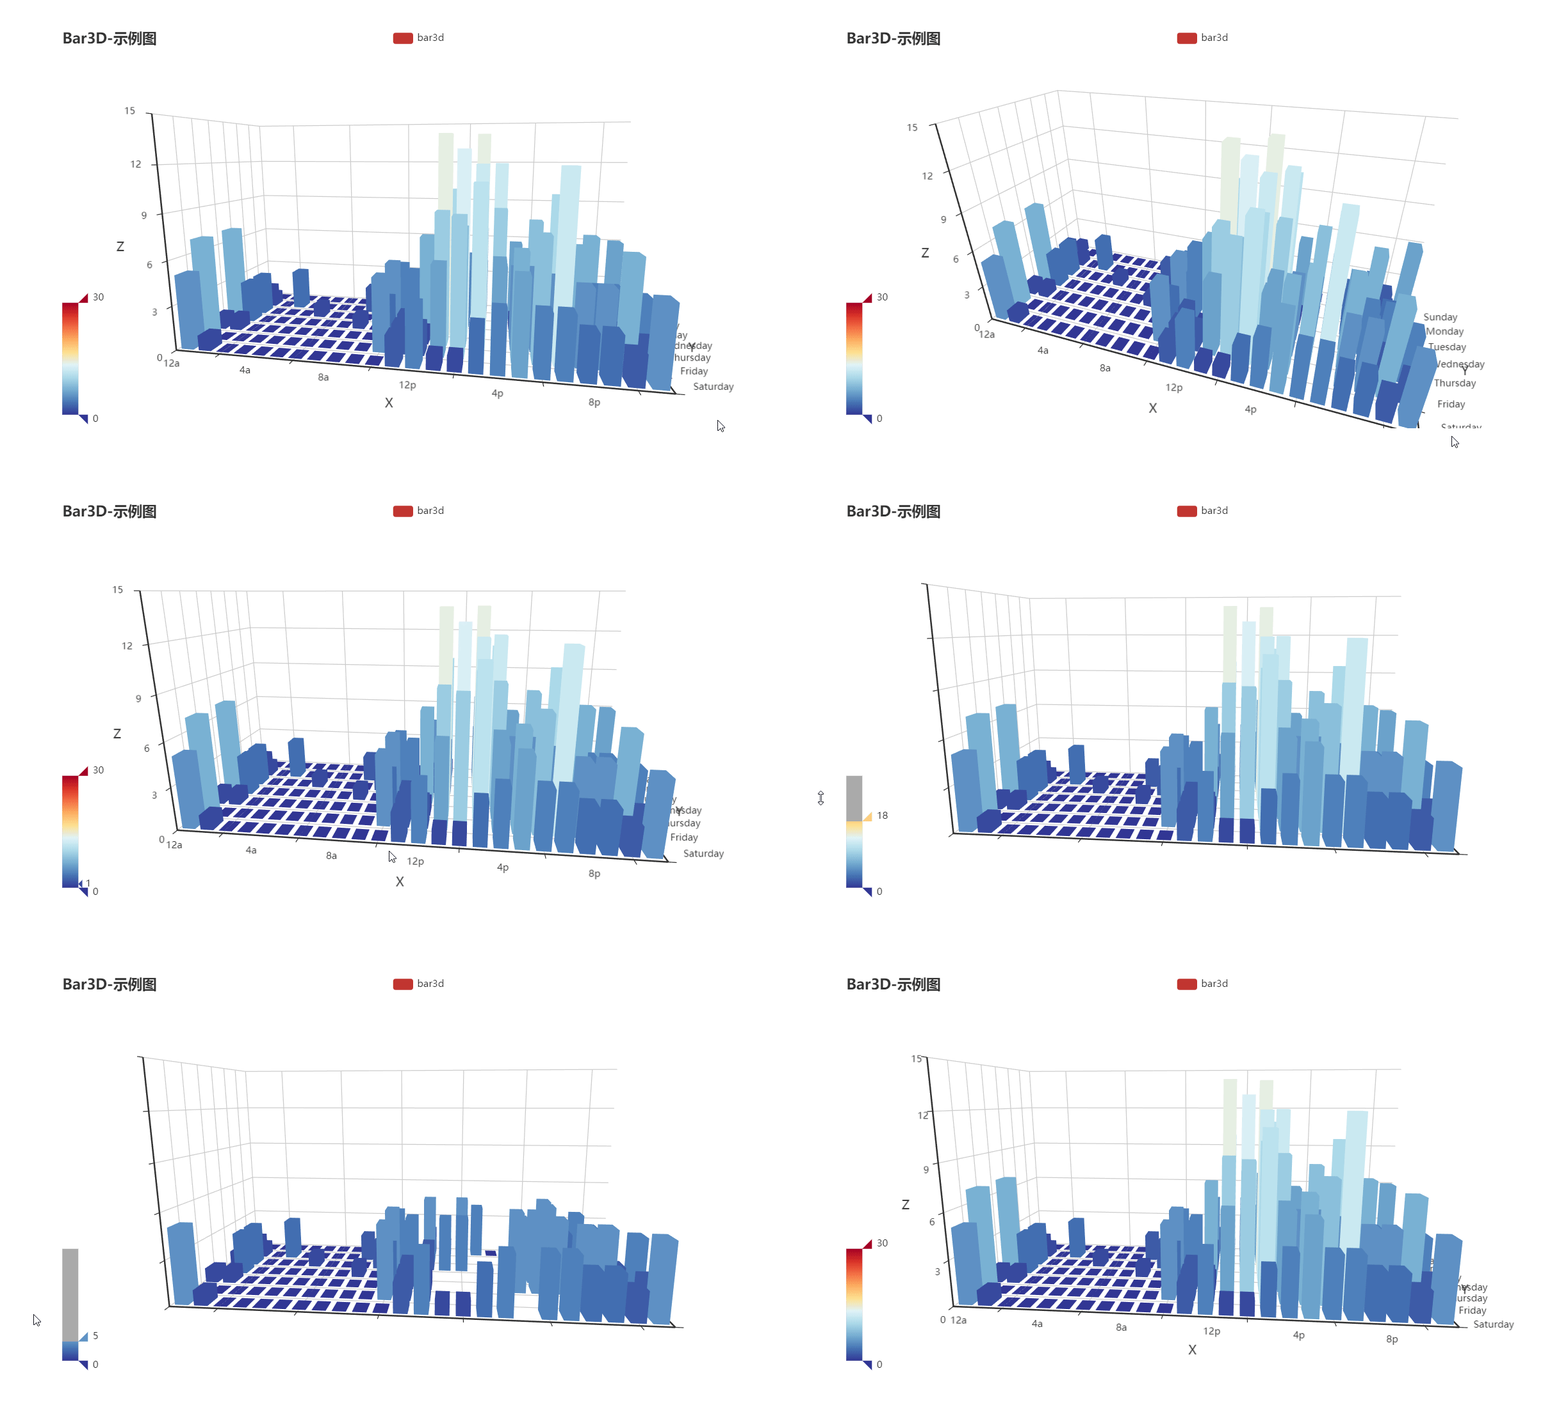
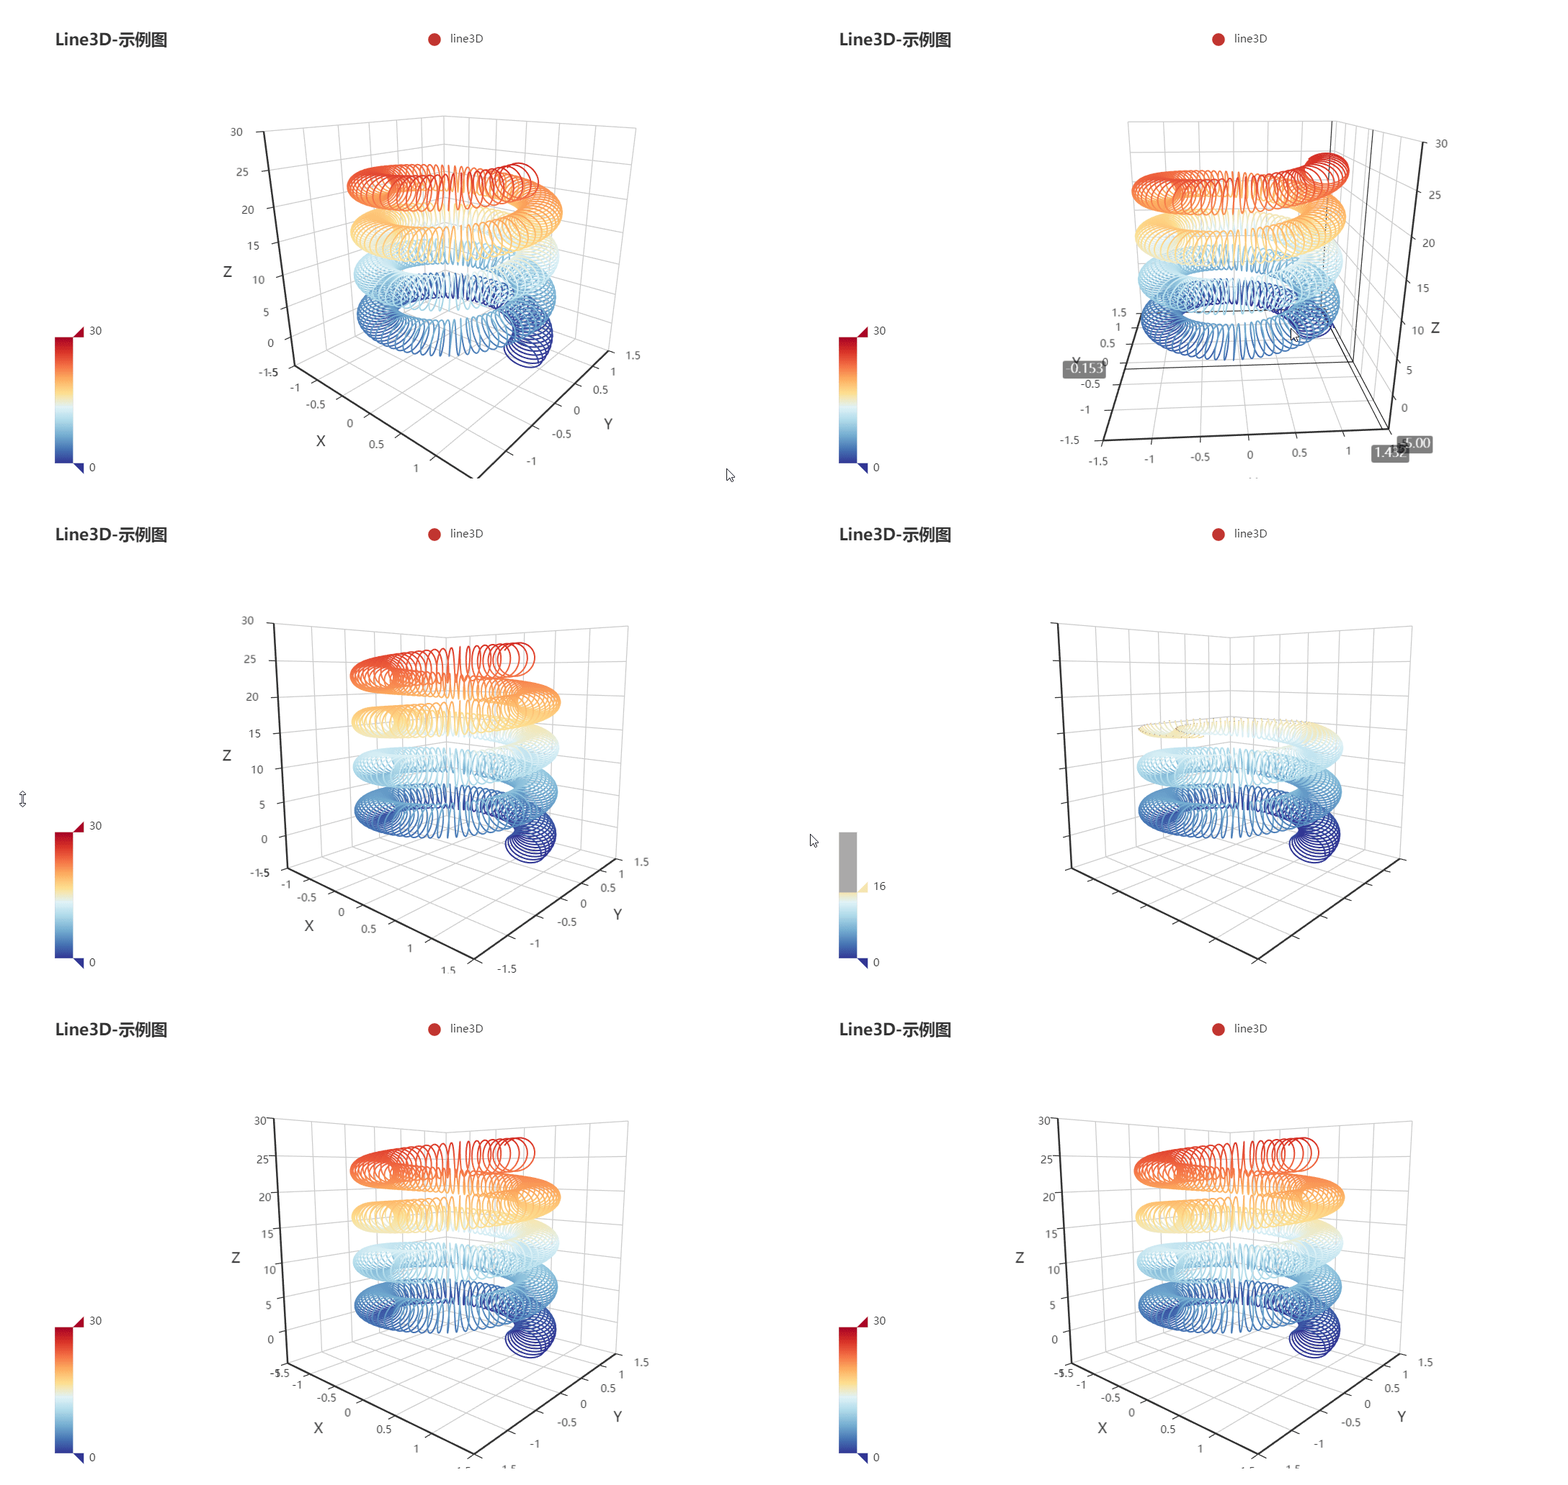
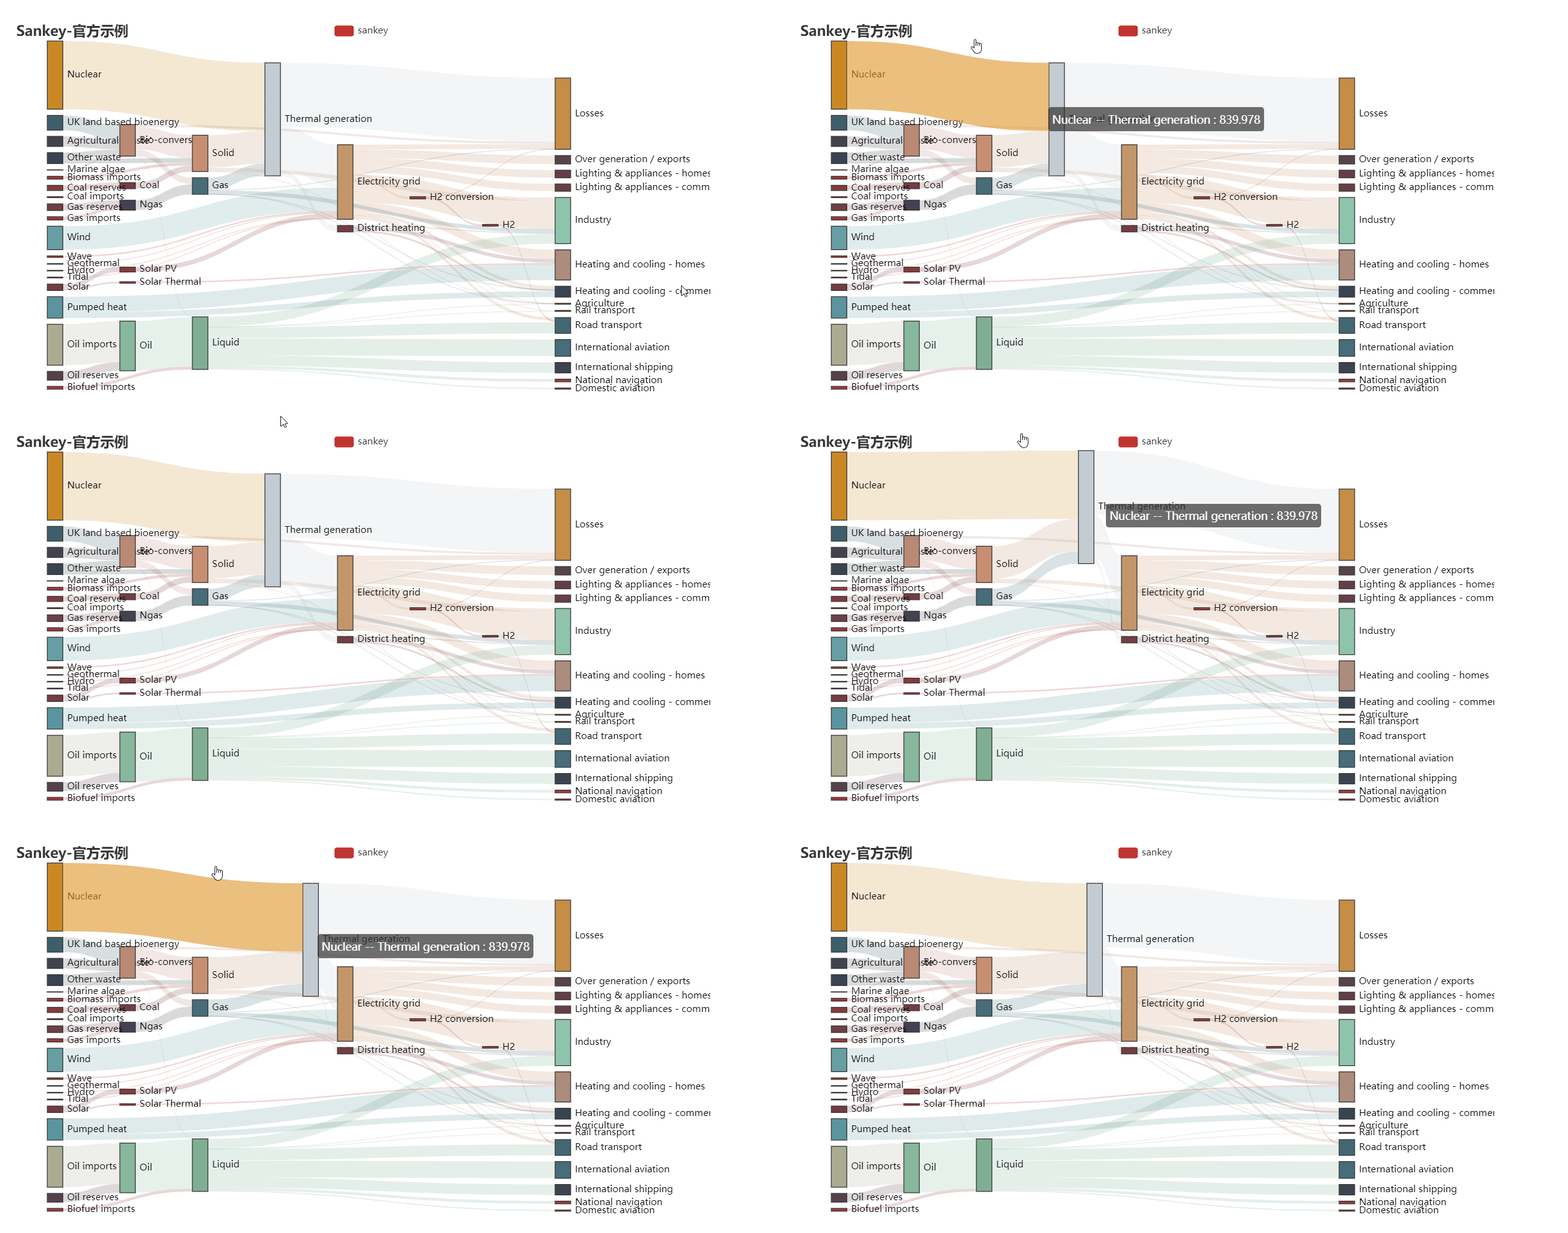
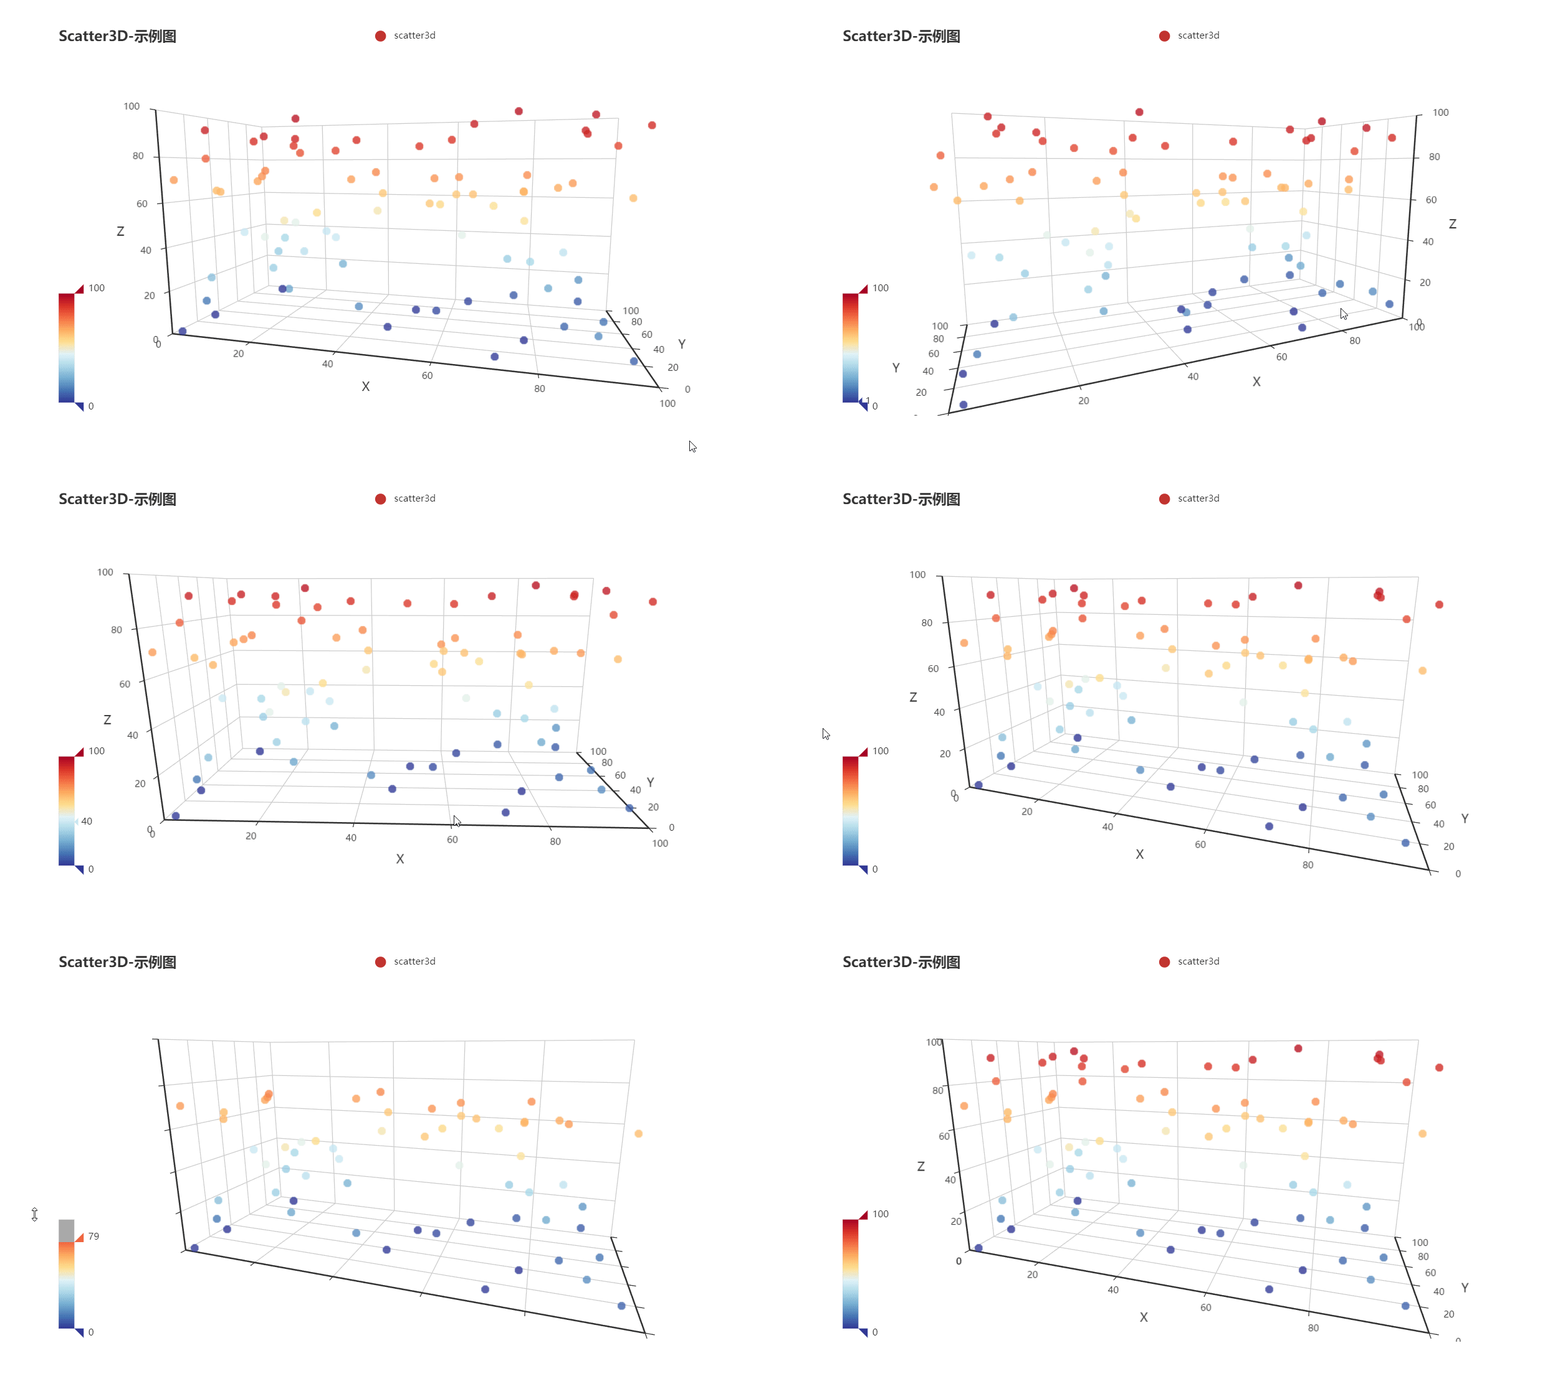
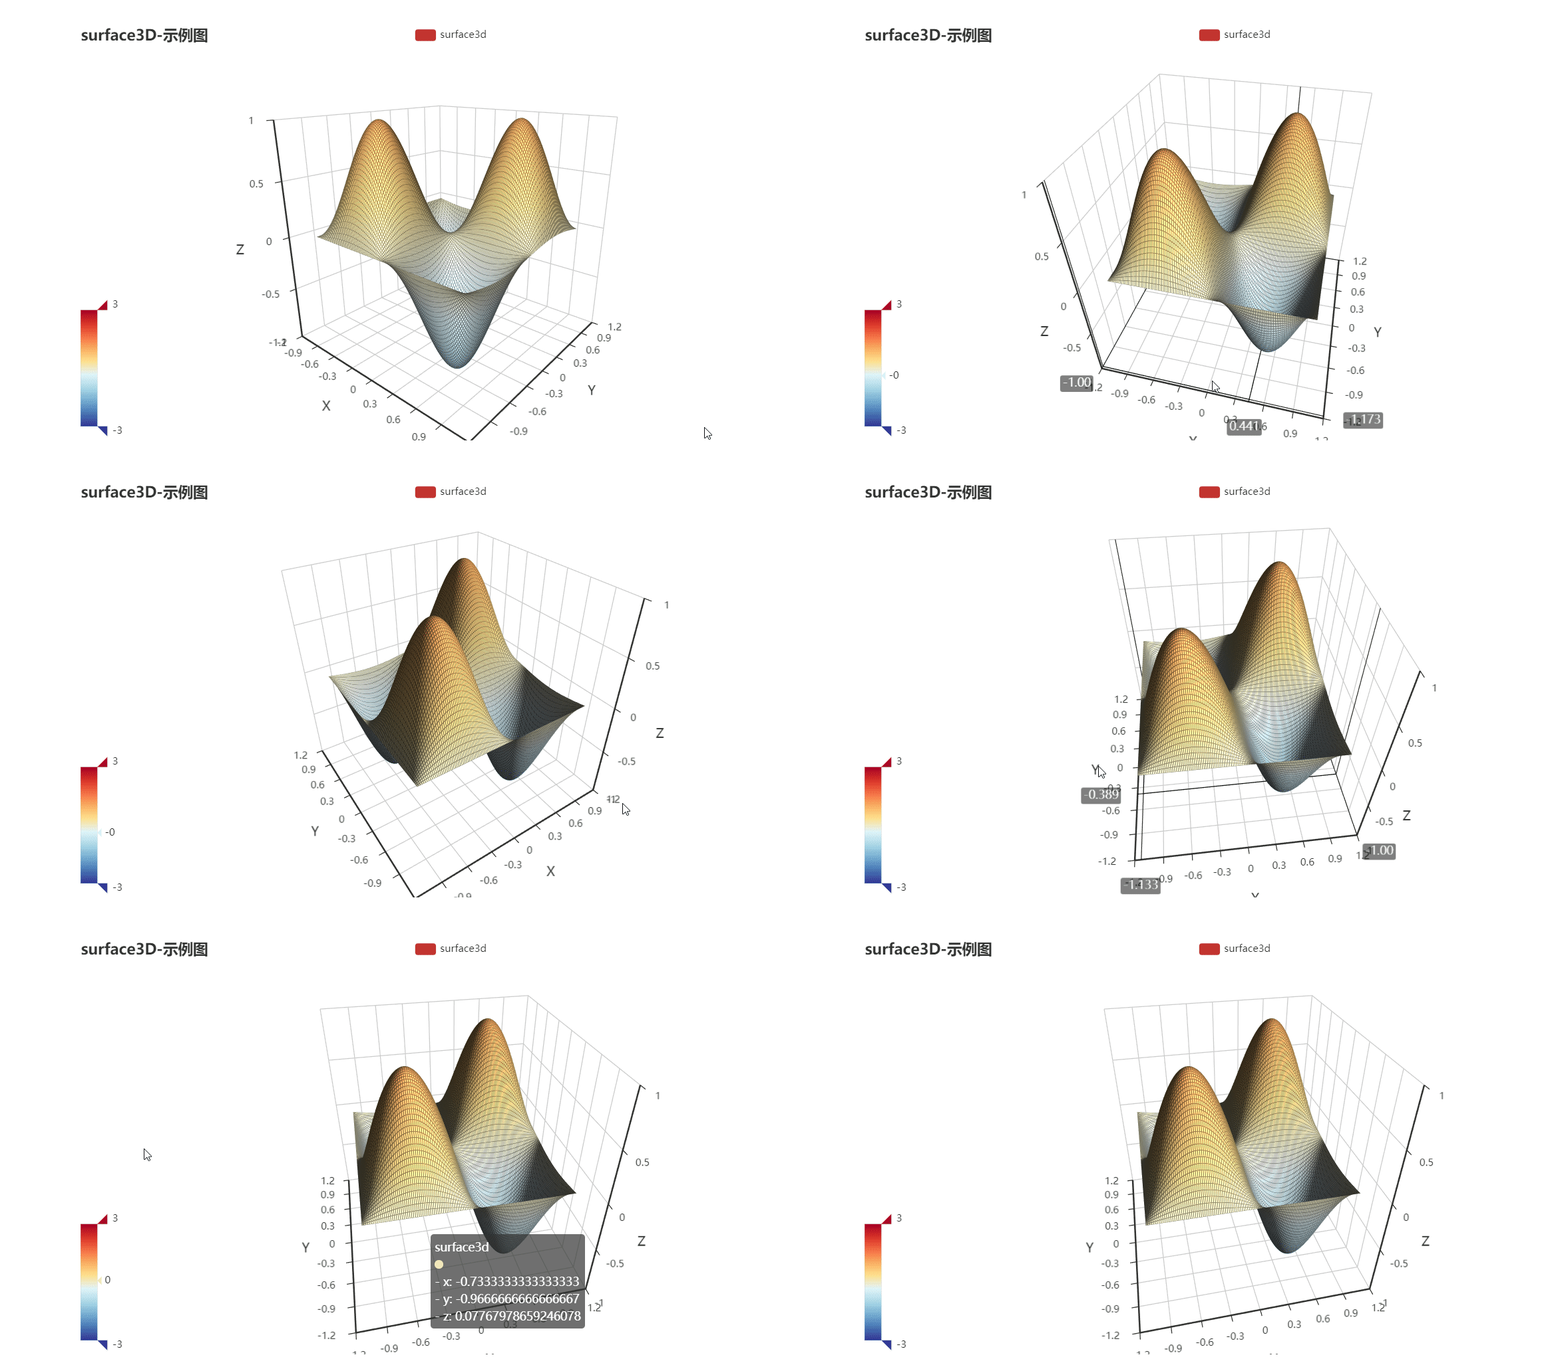
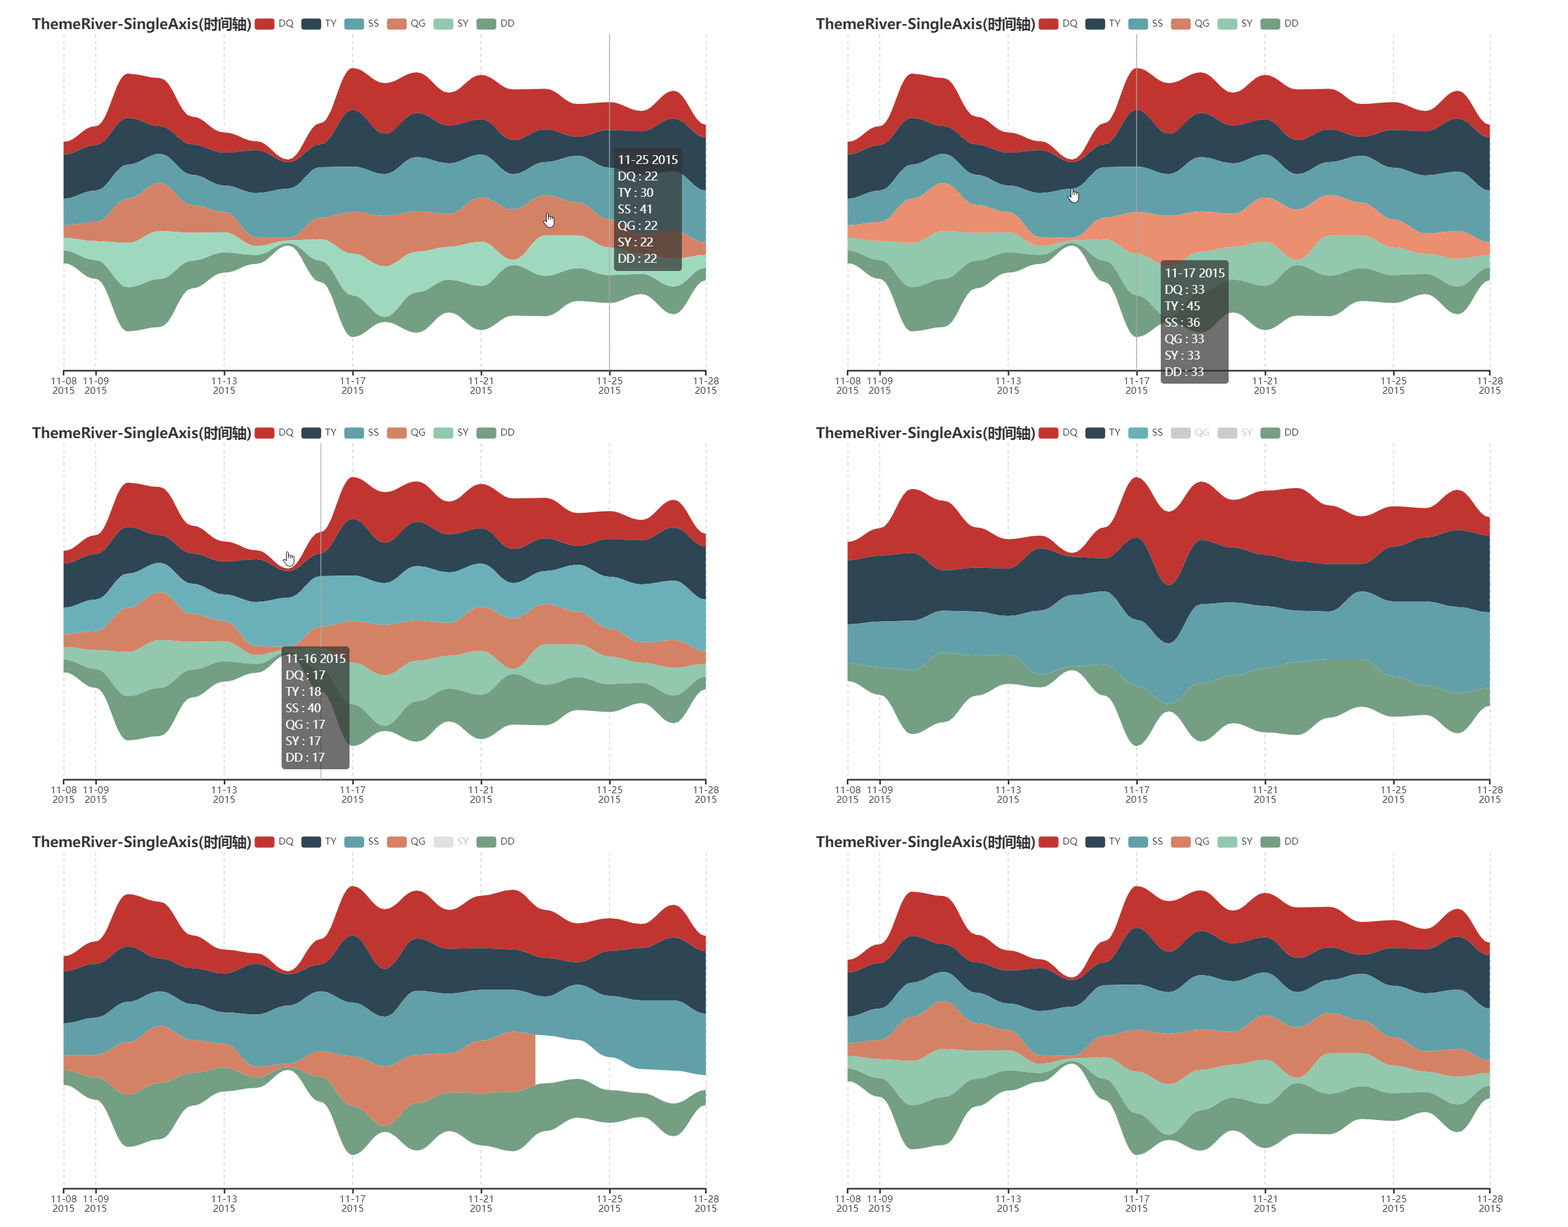
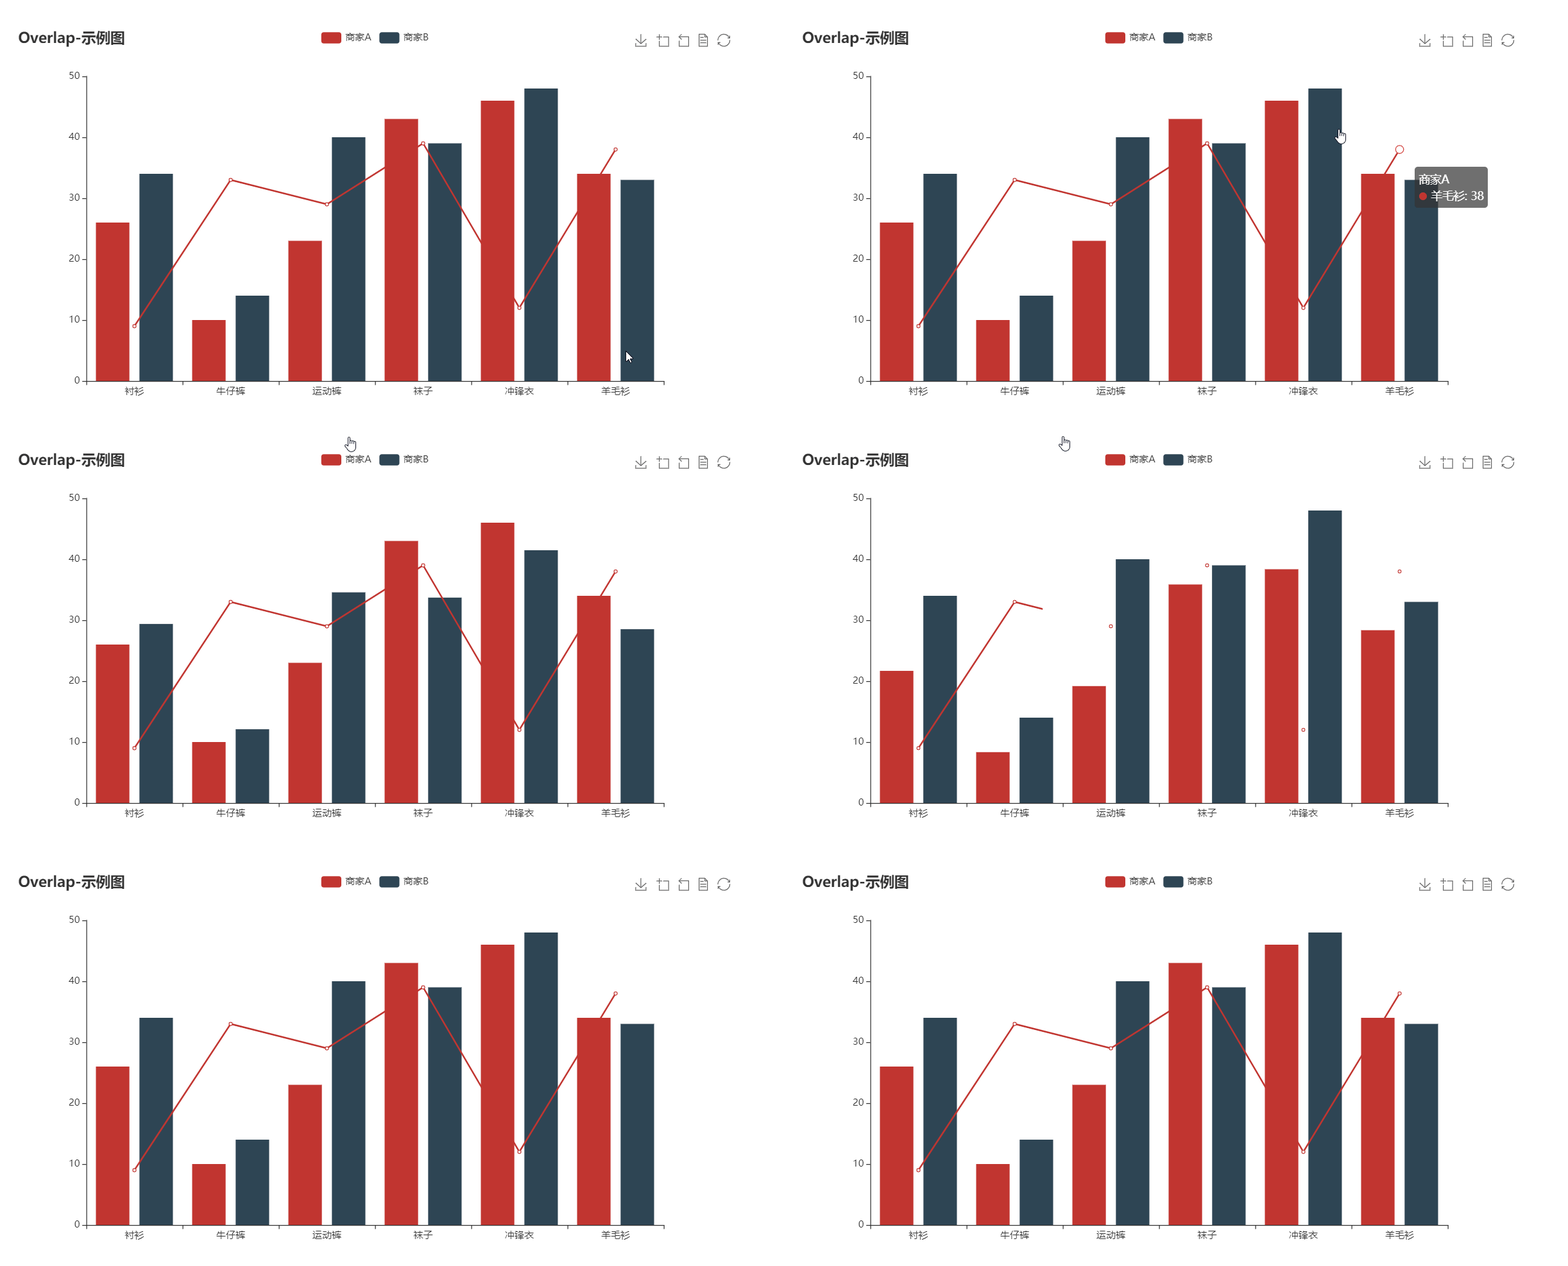
bar boxplot effectScatter funnel gague geo graph heatmap kline line liquid map parallel pie radar scatter wordCloud bar3D line3D sankey scatter3D surface3D themeRiver overlap

Widget Properties

option

String

( required )

ECharts is mainly configured by passing a string value to the JavaScript option property.

You can use jsonEncode() function in dart:convert to convert data in Dart object form:

source: ${jsonEncode(_data1)},

Because JavaScript don't have ''', you can use this operator to reduce some escape operators for quotas:

Echarts(
  option: '''
  
    // option string
    
  ''',
),

To use images in option properties, we suggest the Base64 Data URL :

image: 'data:image/png;base64,iVBORw0KG...',

extraScript

String

JavaScript which will execute after the Echarts.init() and before any chart.setOption(). The widget has a Javascript channel named Messager, so you can use this identifier to send messages from JavaScript to Flutter:

extraScript: '''
  chart.on('click', (params) => {
    if(params.componentType === 'series') {
        Messager.postMessage('anything');
    }
  });
''',

onMessage

void Function(String)?

Function to handle the message sent by Messager.postMessage() in extraScript .

extensions

List<String>

List of strings are from Echarts extensions, such as themes, components, WebGL, and languages. You can download them from the official ECharts extension list. Insert extensions as raw strings:

const liquidPlugin = r'''

  // copy from liquid.min.js

''';

theme

String

You can download built-in ECharts themes or build your own custom themes with the ECharts theme builder. Copy the theme script into the extensions param and register the theme name with this param.

captureAllGestures

bool

( default: false )

Setting captureAllGestures to true is useful when handling 3D rotation and data zoom bars. Note that setting prevents containers like ListViews from reacting to gestures on the charts.

If true, captureHorizontalGestures and captureVerticalGestures are forced true.

captureHorizontalGestures

bool

( default: false )

Only capture horizontal gestures.

captureVerticalGestures

bool

( default: false )

Only capture vertical gestures.

onLoad

void Function(WebViewController)?

The callback when first time the chart is loaded and rendered. You can get the webview controller from this function to do your magic.

reloadAfterInit

bool

( default: false )

If you have trouble in rendering charts in "Movable Widgets"(ListView, SliverView, PageVIew...) on iOS, try setting reloadAfterInit to true .

onWebResourceError

void Function(WebViewController, Exception)?

Handle the web resource error.

Blog

Reactive Echarts Flutter Widget

A performance optimization of Flutter WebView


If you have any suggestions or requests, please open an issue.

The gallery GIF is from chenjiandongx

flutter_echarts's People

Contributors

akramaskar avatar brylie avatar entronad avatar hansz00 avatar lisuizhe avatar singhtaranjeet avatar

Stargazers

 avatar  avatar  avatar  avatar  avatar  avatar  avatar  avatar  avatar  avatar  avatar  avatar  avatar  avatar  avatar  avatar  avatar  avatar  avatar  avatar  avatar  avatar  avatar  avatar  avatar  avatar  avatar  avatar  avatar  avatar  avatar  avatar  avatar  avatar  avatar  avatar  avatar  avatar  avatar  avatar  avatar  avatar  avatar  avatar  avatar  avatar  avatar  avatar  avatar  avatar  avatar  avatar  avatar  avatar  avatar  avatar  avatar  avatar  avatar  avatar  avatar  avatar  avatar  avatar  avatar  avatar  avatar  avatar  avatar  avatar  avatar  avatar  avatar  avatar  avatar  avatar  avatar  avatar  avatar  avatar  avatar  avatar  avatar  avatar  avatar  avatar  avatar  avatar  avatar  avatar  avatar  avatar  avatar  avatar  avatar  avatar  avatar  avatar  avatar  avatar

Watchers

 avatar  avatar  avatar  avatar  avatar  avatar  avatar  avatar  avatar

flutter_echarts's Issues

严重错误 在Sliver 中 添加多个图表 利用 Swiper 进行划分 进行滑动 会出现闪退

0 Flutter flutter::FlutterPlatformViewsController::CompositeEmbeddedView(int) + 1964
1 Flutter flutter::FlutterPlatformViewsController::CompositeEmbeddedView(int) + 1960
2 Flutter flutter::IOSSurfaceGL::CompositeEmbeddedView(int) + 80
3 Flutter flutter::PlatformViewLayer::Paint(flutter::Layer::PaintContext&) const + 48
4 Flutter flutter::ContainerLayer::PaintChildren(flutter::Layer::PaintContext&) const + 88
5 Flutter flutter::TransformLayer::Paint(flutter::Layer::PaintContext&) const + 136
6 Flutter flutter::ContainerLayer::PaintChildren(flutter::Layer::PaintContext&) const + 88
7 Flutter flutter::TransformLayer::Paint(flutter::Layer::PaintContext&) const + 136
8 Flutter flutter::ContainerLayer::PaintChildren(flutter::Layer::PaintContext&) const + 88
9 Flutter flutter::ClipRectLayer::Paint(flutter::Layer::PaintContext&) const + 208
10 Flutter flutter::ContainerLayer::PaintChildren(flutter::Layer::PaintContext&) const + 88
11 Flutter flutter::TransformLayer::Paint(flutter::Layer::PaintContext&) const + 136
12 Flutter flutter::ContainerLayer::PaintChildren(flutter::Layer::PaintContext&) const + 88
13 Flutter flutter::ClipRectLayer::Paint(flutter::Layer::PaintContext&) const + 208
14 Flutter flutter::ContainerLayer::PaintChildren(flutter::Layer::PaintContext&) const + 88
15 Flutter flutter::TransformLayer::Paint(flutter::Layer::PaintContext&) const + 136
16 Flutter flutter::ContainerLayer::PaintChildren(flutter::Layer::PaintContext&) const + 88
17 Flutter flutter::ClipRectLayer::Paint(flutter::Layer::PaintContext&) const + 208
18 Flutter flutter::ContainerLayer::PaintChildren(flutter::Layer::PaintContext&) const + 88
19 Flutter flutter::TransformLayer::Paint(flutter::Layer::PaintContext&) const + 136
20 Flutter flutter::ContainerLayer::PaintChildren(flutter::Layer::PaintContext&) const + 88
21 Flutter flutter::PhysicalShapeLayer::Paint(flutter::Layer::PaintContext&) const + 432
22 Flutter flutter::ContainerLayer::PaintChildren(flutter::Layer::PaintContext&) const + 88
23 Flutter flutter::TransformLayer::Paint(flutter::Layer::PaintContext&) const + 136
24 Flutter flutter::ContainerLayer::PaintChildren(flutter::Layer::PaintContext&) const + 88
25 Flutter flutter::ClipRectLayer::Paint(flutter::Layer::PaintContext&) const + 208
26 Flutter flutter::ContainerLayer::PaintChildren(flutter::Layer::PaintContext&) const + 88
27 Flutter flutter::TransformLayer::Paint(flutter::Layer::PaintContext&) const + 136
28 Flutter flutter::ContainerLayer::PaintChildren(flutter::Layer::PaintContext&) const + 88
29 Flutter flutter::ClipRectLayer::Paint(flutter::Layer::PaintContext&) const + 208
30 Flutter flutter::ContainerLayer::PaintChildren(flutter::Layer::PaintContext&) const + 88
31 Flutter flutter::TransformLayer::Paint(flutter::Layer::PaintContext&) const + 136
32 Flutter flutter::ContainerLayer::PaintChildren(flutter::Layer::PaintContext&) const + 88
33 Flutter flutter::PhysicalShapeLayer::Paint(flutter::Layer::PaintContext&) const + 432
34 Flutter flutter::ContainerLayer::PaintChildren(flutter::Layer::PaintContext&) const + 88
35 Flutter flutter::TransformLayer::Paint(flutter::Layer::PaintContext&) const + 136
36 Flutter flutter::ContainerLayer::PaintChildren(flutter::Layer::PaintContext&) const + 88
37 Flutter flutter::TransformLayer::Paint(flutter::Layer::PaintContext&) const + 136
38 Flutter flutter::ContainerLayer::PaintChildren(flutter::Layer::PaintContext&) const + 88
39 Flutter flutter::TransformLayer::Paint(flutter::Layer::PaintContext&) const + 136
40 Flutter flutter::CompositorContext::ScopedFrame::Raster(flutter::LayerTree&, bool) + 808
41 Flutter flutter::Rasterizer::DrawToSurface(flutter::LayerTree&) + 456
42 Flutter _ZNSt3__110__function6__funcIZN7flutter10Rasterizer4DrawEN3fml6RefPtrINS2_8PipelineINS2_9LayerTreeEEEEEE3$0NS_9allocatorISA_EEFvNS_10unique_ptrIS7_NS_14default_deleteIS7_EEEEEEclEOSG + 104
43 Flutter flutter::Rasterizer::Draw(fml::RefPtr<flutter::Pipelineflutter::LayerTree >) + 476
44 Flutter _ZNSt3__110__function6__funcIZN7flutter5Shell14OnAnimatorDrawEN3fml6RefPtrINS2_8PipelineINS2_9LayerTreeEEEEEE4$_28NS_9allocatorISA_EEFvvEEclEv + 76
45 Flutter fml::MessageLoopImpl::FlushTasks(fml::FlushType) + 132
46 Flutter fml::MessageLoopDarwin::OnTimerFire(__CFRunLoopTimer*, fml::MessageLoopDarwin*) + 32
47 CoreFoundation _CFRUNLOOP_IS_CALLING_OUT_TO_A_TIMER_CALLBACK_FUNCTION + 28
48 CoreFoundation ___CFRunLoopDoTimer + 880
49 CoreFoundation ___CFRunLoopDoTimers + 276
50 CoreFoundation ___CFRunLoopRun + 1640
51 CoreFoundation CFRunLoopRunSpecific + 424
52 GraphicsServices GSEventRunModal + 160
53 UIKitCore UIApplicationMain + 1932

The background color before display.

Though I set the background color, background color before display is white on a tick. If my app background is no white, even is black, it will be disharmony.

尽管设置了背景颜色,但在视图显示之前,会有一瞬间的白色。如果我的APP背景颜色不是白色,甚至是黑色,将导致严重的色差冲突。

如何显示和关闭loading效果

如何和异步接口协作,获取数据前显示loading,结束后关闭loading?
目前只能通过以下方式显示loading
extraScript: '''
chart.showLoading();
'''

Exception: Trying to create an already created platform view

Probably throws this error:

E/flutter (32506): [ERROR:flutter/lib/ui/ui_dart_state.cc(157)] Unhandled Exception: PlatformException(error, java.lang.IllegalStateException: Trying to create an already created platform view, view id: 0
E/flutter (32506): 	at io.flutter.plugin.platform.PlatformViewsController$1.createPlatformView(PlatformViewsController.java:85)
E/flutter (32506): 	at io.flutter.embedding.engine.systemchannels.PlatformViewsChannel$1.create(PlatformViewsChannel.java:96)
E/flutter (32506): 	at io.flutter.embedding.engine.systemchannels.PlatformViewsChannel$1.onMethodCall(PlatformViewsChannel.java:60)
E/flutter (32506): 	at io.flutter.plugin.common.MethodChannel$IncomingMethodCallHandler.onMessage(MethodChannel.java:231)
E/flutter (32506): 	at io.flutter.embedding.engine.dart.DartMessenger.handleMessageFromDart(DartMessenger.java:93)
E/flutter (32506): 	at io.flutter.embedding.engine.FlutterJNI.handlePlatformMessage(FlutterJNI.java:642)
E/flutter (32506): 	at android.os.MessageQueue.nativePollOnce(Native Method)
E/flutter (32506): 	at android.os.MessageQueue.next(MessageQueue.java:363)
E/flutter (32506): 	at android.os.Looper.loop(Looper.java:173)
E/flutter (32506): 	at android.app.ActivityThread.main(ActivityThread.java:8147)
E/flutter (32506): 	at java.lang.reflect.Method.invoke(Native Method)
E/flutter (32506): 	at com.android.internal.os.RuntimeInit$MethodAndArgsCaller.run(RuntimeInit.java:513)
E/flutter (32506): 	at com.android.internal.os.ZygoteInit.main(ZygoteInit.java:1101)

Can we use topojson instead on geojson file in echart map

I am trying to show population for all countries by states using topojson file in my flutter app.
similar to https://echarts.apache.org/examples/en/editor.html?c=map-usa

geojson files are working but are very large compare and topojson files doesn't is there a way to use topojson file in echarts

if not I am not finding geojson file with smaller size for all countries can you please provide any source where I can find it geojson files of all countries with states.

as the example you have used
the usa geojson filesize it small compare to what I am finding on internet.
http://echarts.apache.org/examples/data/asset/geo/USA.json

Problem with the example

Hello! The library is amazing but I must notify an error that made me lose 1 hour to understand why the library doesn't work.
In the example, the option terminates with the use of ; and this breaks the chart.

保持图表缩放大小以及位置

目前需求是图表需要实时更新
大约每秒即会刷新一次图表

但每次图表的更新, 都会重制当前缩放位置以及大小
例如
初始缩放是 x 轴的 0 到 50
此时使用手势缩放并移动至 40 到 100

那么在图表有新资料进行刷新时又会重置位置至 0 到 50
请问有什么方法可以保持位置以及缩放状态呢?

或者是在缩放以及更改位置时有回调可以接相关参数
方便在下次图表刷新时一并带入同步

When I create APK file for my release chart is not appearing while during development everything is good!

[✓] Flutter (Channel unknown, v1.12.13+hotfix.5, on Linux, locale en_US.UTF-8)
• Flutter version 1.12.13+hotfix.5 at /home/something/Dev-tools/flutter
• Framework revision 27321ebbad (3 months ago), 2019-12-10 18:15:01 -0800
• Engine revision 2994f7e1e6
• Dart version 2.7.0

[✓] Android toolchain - develop for Android devices (Android SDK version 29.0.2)
• Android SDK at /home/something/Android/Sdk
• Android NDK location not configured (optional; useful for native profiling support)
• Platform android-29, build-tools 29.0.2
• ANDROID_HOME = /home/something/Android/Sdk
• Java binary at: /home/something/.local/share/JetBrains/Toolbox/apps/AndroidStudio/ch-0/193.6224510/jre/bin/java
• Java version OpenJDK Runtime Environment (build 1.8.0_212-release-1586-b4-5784211)
• All Android licenses accepted.

[✓] Android Studio (version 4.1)
• Android Studio at /home/something/.local/share/JetBrains/Toolbox/apps/AndroidStudio/ch-0/193.6224510
• Flutter plugin version 44.0.3
• Dart plugin version 193.6494.35
• Java version OpenJDK Runtime Environment (build 1.8.0_212-release-1586-b4-5784211)

[!] IntelliJ IDEA Community Edition (version 2019.3)
• IntelliJ at /home/something/.local/share/JetBrains/Toolbox/apps/IDEA-C/ch-0/193.6494.35
✗ Flutter plugin not installed; this adds Flutter specific functionality.
✗ Dart plugin not installed; this adds Dart specific functionality.
• For information about installing plugins, see
https://flutter.dev/intellij-setup/#installing-the-plugins

[✓] Connected device (1 available)
• H8314 • BH900VN9BZ • android-arm64 • Android 10 (API 29)

Null passed to loadUrl function causes failed assertion 'url != null': is not true

When the EChart widget is disposed (e.g. because the current screen is being popped), the following error is thrown:

E/flutter (10195): [ERROR:flutter/lib/ui/ui_dart_state.cc(157)] Unhandled Exception: 'package:webview_flutter/webview_flutter.dart': Failed assertion: line 546 pos 12: 'url != null': is not true.
E/flutter (10195): #0 _AssertionError._doThrowNew (dart:core-patch/errors_patch.dart:42:39)
E/flutter (10195): #1 _AssertionError._throwNew (dart:core-patch/errors_patch.dart:38:5)
E/flutter (10195): #2 WebViewController.loadUrl
package:webview_flutter/webview_flutter.dart:546
E/flutter (10195): #3 _EchartsState.dispose

This error is thrown because the loadUrl function does not accept null as an argument:

Future<void> loadUrl( String url, { Map<String, String> headers, }) async { **assert(url != null);** _validateUrlString(url); return _webViewPlatformController.loadUrl(url, headers); }

But null is passed to it here:

// --- FIX_IOS_LEAK --- @override void dispose() { super.dispose(); _controller.loadUrl(null).then((_) { _controller.clearCache(); }); } // --- FIX_IOS_LEAK ---

Cannot change size of chart

Wrapping the chart widget in a SizedBox with a specific height does not work as expected. The chart stays the same natural height no matter the value I provide. Here are some screenshots. The 2 color bands mark the top and bottom of the SizedBox that contains the chart widget.

device-2020-05-25-170336

fill_space

Basic example not working.

I'm a dart/flutter begginer so I just may be missing something. Appreciate any feedback. In the android emulator (pixel 2, api 29) I just see a white, blank square (no bars). Below is as little code as I can provide. The current version I have is
pubspec.yaml:

version: 1.0.0+1

environment:
  sdk: ">=2.7.0 <3.0.0"

dependencies:
  flutter:
    sdk: flutter
  flutter_echarts: ^1.3.1

main.dart:

import 'package:flutter/material.dart';
import 'package:flutter_echarts/flutter_echarts.dart';

void main() => runApp(MyApp());

class MyApp extends StatelessWidget {
  @override
  Widget build(BuildContext context) {
    return MaterialApp(
        title: "My Charts",
        home: Scaffold(
            appBar: AppBar(
              title: Text("Charting App"),
              backgroundColor: Colors.deepPurple,
            ),
            body: Builder(
                builder: (context) => SingleChildScrollView(
                    child: Padding(
                        padding: EdgeInsets.all(20),
                        child: Center(
                            child: Column(children: [
                          Padding(
                            padding: EdgeInsets.all(10),
                            child: Text(
                              'Hello Chart App',
                              style: TextStyle(
                                  fontSize: 26,
                                  fontWeight: FontWeight.bold,
                                  color: Colors.blue[800]),
                            ),
                          ),
                          Padding(
                            padding: EdgeInsets.all(15),
                            child: Text(
                              'Discover Data',
                              style: TextStyle(
                                  fontSize: 20, color: Colors.deepPurpleAccent),
                            ),
                          ),
                          Container(
                              decoration: BoxDecoration(boxShadow: [
                                BoxShadow(
                                    color: Colors.blue,
                                    blurRadius: 10,
                                    spreadRadius: 2)
                              ]),
                              child: Echarts(
                                option: '''
                                      xAxis: {
                                        type: 'category',
                                        data: ['Mon', 'Tue', 'Wed', 'Thu', 'Fri', 'Sat', 'Sun']
                                      },
                                      yAxis: {
                                        type: 'value'
                                      },
                                      series: [{
                                        data: [820, 932, 901, 934, 1290, 1330, 1320],
                                        type: 'bar'
                                      }]
                                    }
                                  ''',
                              ),
                              height: 400),
                          Padding(
                            padding: EdgeInsets.all(15),
                            child: RaisedButton(
                              child: Text('Contact Me!'),
                              onPressed: () => contactUs(context),
                            ),
                          )
                        ])))))));
  }

  void contactUs(BuildContext context) {
    showDialog(
      context: context,
      builder: (BuildContext context) {
        return AlertDialog(
          title: Text('Contact Us'),
          content: Text('e-mail: [email protected]'),
          actions: <Widget>[
            FlatButton(
              child: Text('Close'),
              onPressed: () => Navigator.of(context).pop(),
            )
          ],
        );
      },
    );
  }
}

将demo运行,一片空白

按文档中的说明,引入相关库,get
然后Run .结果该显示曲线的地方一片空白 。
模拟器:iphone8 13.3
[✓] Flutter (Channel stable, v1.12.13+hotfix.5, on Mac OS X 10.15.2 19C57, locale zh-Hans-CN)
• Flutter version 1.12.13+hotfix.5 at /Users/kazeik/Documents/flutter
• Framework revision 27321ebbad (5 weeks ago), 2019-12-10 18:15:01 -0800
• Engine revision 2994f7e1e6
• Dart version 2.7.0

[✓] Android toolchain - develop for Android devices (Android SDK version 29.0.2)
• Android SDK at /Users/kazeik/Library/Android/sdk
• Android NDK location not configured (optional; useful for native profiling support)
• Platform android-29, build-tools 29.0.2
• Java binary at: /Applications/Android Studio.app/Contents/jre/jdk/Contents/Home/bin/java
• Java version OpenJDK Runtime Environment (build 1.8.0_202-release-1483-b49-5587405)
• All Android licenses accepted.

[✓] Xcode - develop for iOS and macOS (Xcode 11.3)
• Xcode at /Applications/Xcode.app/Contents/Developer
• Xcode 11.3, Build version 11C29
• CocoaPods version 1.8.4

[✓] Android Studio (version 3.5)
• Android Studio at /Applications/Android Studio.app/Contents
• Flutter plugin version 42.1.1
• Dart plugin version 191.8593
• Java version OpenJDK Runtime Environment (build 1.8.0_202-release-1483-b49-5587405)

[✓] IntelliJ IDEA Ultimate Edition (version 2017.2)
• IntelliJ at /Applications/IntelliJ IDEA.app
• Flutter plugin version 21.2.2
• Dart plugin version 172.3317.48

[✓] IntelliJ IDEA Community Edition (version 2019.3.1)
• IntelliJ at /Applications/IntelliJ IDEA CE.app
• Flutter plugin version 42.1.4
• Dart plugin version 193.5731

[✓] VS Code (version 1.41.1)
• VS Code at /Applications/Visual Studio Code.app/Contents
• Flutter extension version 3.7.1

[✓] Connected device (1 available)
• iPhone 8 • BC9C76F0-9C58-4744-B5F1-2AEFD129F290 • ios • com.apple.CoreSimulator.SimRuntime.iOS-13-3 (simulator)

Could not download guava.jar (com.google.guava:guava:26.0-jre)

image url

I have a flutter project using flutter_echarts.
I want to add icons to my yAxis, using rich text. the icons are in assets/images/imageName.png,
but when I use it like this in 'rich'

backgroundColor: {
                           image: './assets/images/imageName.png'
                           },
                      },

or like this

backgroundColor: {
                           image: 'assets/images/imageName.png'
                           },
                      },

the icon is not displayed.
is there another way?

曲线不显示

控制台显示
ViewRootImpl: jank_removeInvalidNode jank list is null

image

渲染速度慢

在模拟器上图表初次渲染非常慢,大概十秒才渲染出来

How can I apply dark palette for charts?

Echart website shows two other color palette along with default palette for charts. Is there a way we can utilize dark palette here in flutter_echarts? If so, how can we do it?

flutter_echarts1.2.0 在iphone6 plus上不显示,错误提示:chart.setOption is not a function

Error Domain=WKErrorDomain Code=4 "A JavaScript exception occurred" UserInfo={WKJavaScriptExceptionLineNumber=1, WKJavaScriptExceptionMessage=TypeError: chart.setOption is not a function. (In 'chart.setOption', 'chart.setOption' is undefined), WKJavaScriptExceptionSourceURL=data:text/html;base64,ICAgIDwhRE9DVFlQRSBodG1sPgogICAgPGh0bWw+CiAgICAgIDxoZWFkPgogICAgICAgIDxtZXRhIGNoYXJzZXQ9InV0Zi04Ij ... PgogIA==, NSLocalizedDescription=A JavaScript exception occurred, WKJavaScriptExceptionColumnNumber=22})
0 StandardMethodCodec.decodeEnvelope (package:flutter/src/services/message_codecs.dart:569:7)
1 MethodChannel.invokeMethod (package:flutter/src/services/platform_channel.dart:321:33)

2 MethodChannelWebViewPlatform.evaluateJavascript (package:webview_flutter/src/webview_method_channel.dart:95:21)
3 WebViewController.evaluateJavascript (package:webview_flutter/webview_flutter.dart:655:39)
4 _EchartsState.init (package:flutter_echarts/flutter_echarts.dart:112:24)
5 _EchartsState.echartWidget. (package:flutter_echarts/flutter_echarts.dart:141:9)
6 _PlatformCallbacksHandler.onPageFinished (package:webview_flutter/webview_flutter.dart:481:15)
7 MethodChannelWebViewPlatform._onMethodCall (package:webview_flutter/src/webview_method_channel.dart:41:35)
8 MethodChannel._handleAsMethodCall (package:flutter/src/services/platform_channel.dart:402:55)
9 MethodChannel.setMethodCallHandler. (package:flutter/src/services/platform_channel.dart:370:54)
10 _DefaultBinaryMessenger.handlePlatformMessage (package:flutter/src/services/binding.dart:200:33)
11 _invoke3. (dart:ui/hooks.dart:303:15)
12 _rootRun (dart:async/zone.dart:1126:13)
13 _CustomZone.run (dart:async/zone.dart:1023:19)
14 _CustomZone.runGuarded (dart:async/zone.dart:925:7)
15 _invoke3 (dart:ui/hooks.dart:302:10)
16 _dispatchPlatformMessage (dart:ui/hooks.dart:162:5)

一点反应都没有

import 'package:flutter/material.dart';
import 'package:flutter_echarts/flutter_echarts.dart';

class Home extends StatelessWidget {
  @override
  Widget build(BuildContext context) {
    // TODO: implement build
    return new Scaffold(
      appBar: AppBar(
        title: Text('首页'),
      ),
      body: Container(
        child: Echarts(
          option: '''
    {
      xAxis: {
        type: 'category',
        data: ['Mon', 'Tue', 'Wed', 'Thu', 'Fri', 'Sat', 'Sun']
      },
      yAxis: {
        type: 'value'
      },
      series: [{
        data: [820, 932, 901, 934, 1290, 1330, 1320],
        type: 'line'
      }]
    }
  ''',
        ),
        width: 300,
        height: 250,
      ),
    );
  }
}


测试结果是页面一片空白

y轴数值显示不完整

初始化y轴数值小时可以显示完整,当挪动底部 datazoom 时y轴数值变大就显示不完整了。
image
image

axis backgroud

is there a way to give a background color for the whole area of the axis labels, instead of giving each axis label it's own background , which doesn't look good when scaling?

image
in addition, I have this y axis on the left-
image

and I want to give each label a different background, but that the background would take the entire label container, meaning each label will have 20% of the bg (5 labels). it doesn't work with this code of rich text :
` rich:
{
One:
{
width: '20%',
height:27,
color:'#33334d',
fontSize: 12,
backgroundColor:'rgba(194, 156, 215, 0.8)',
},

                 Two:{
                  width:'20%',
                  height:27,
                    color:'#33334d',
                  fontSize: 12,
                  backgroundColor:'rgba(210, 210, 210, 0.8)',
                 
                     }...,`

thank you.

Is there any sample for World map?

I am trying to create a world map using below code. But the map does not display

Echarts(
    option: '''
          {
    title : {
        text: 'World Population (2010)',
        x:'left',
        y:'top',
    },
    tooltip : {
        trigger: 'item',
        formatter : function (params) {
            var value = (params.value + '').split('.');
            value = value[0].replace(/(\d{1,3})(?=(?:\d{3})+(?!\d))/g, '$1,');
            return params.name + ' : ' + value;
        }
    },
    toolbox: {
        show : true,
        orient : 'vertical',
        x: 'right',
        feature : {
            restore : {show: true},
            mark : {show: true},
        }
    },
    dataRange: {
        min: 0,
        max: 1000000,
        text:['High','Low'],
        realtime: false,
        calculable : true,
        color: ['#ED6F61','#faa700','#327589','#75FAD7']
    },
    series : [
        {
            name: 'World Population (2010)',
            type: 'map',
            mapType: 'world',
            roam: true,
            itemStyle:{
                emphasis:{label:{show:true}}
            },
            data:[
                {name : 'Afghanistan', value : 28397.812},
                {name : 'Angola', value : 19549.124},
                {name : 'Albania', value : 3150.143},
                .....
                {name : 'Zimbabwe', value : 13076.978}
            ]
        }
    ]
}
    ''',
)

This is result:
Screenshot

严重BUG 请重视

在Sliver 控件中添加多个图表 在未见区域 图表会丢失 多发现象

ListView中放多个图表,不可见区域有图片无法加载空白的情况

在ListView中放多个图表,有柱形,曲线,或其它类型。
在界面初始化时,只加载了可见区域内的图表,不可见区域的未加载。
等滑动列表时,最初不可见区域内的是一个空白。
如果在图表初始化时迅速上下滑动列表,让不可见区域初始化一次后,图表将可以加载出来

Flutter and Mobile devices

Hello,
I use translation because I don't have English.
I am using echarts-gl surface with flutter. But the 'click' method does not work on mobile devices.
It's your example:
"
extraScript: '''
chart.on('click', (params) => {
if(params.componentType === 'series') {
Messager.postMessage('anything');
}
});
''',
"
But this code not working in surface with mobile devices.

Also, I cannot scroll the image in any direction. rotating by drag. How do I add scrool feature with double finger touch function?
Thank you.

Chart doesn't redraw in realtime if inside a scrollable widget

Hello there, first of all, amazing library :)

Whenever I add a chart to some scrollable widget, like SingleChildScrollView the chart stops being "realtime" responsive.

For example, if I have a candlestick chart (like this one https://www.echartsjs.com/examples/en/editor.html?c=candlestick-touch ) and want to move the chart data, it will not redraw the chart in realtime, it will only redraw after I release the click.

The chart works as expected if I insert it not inside a scrollable widget.

The Android "Could not resolve io.flutter:flutter_embedding_debug" error after upgrade flutter to 1.17.0

FAILURE: Build failed with an exception.

  • What went wrong:
    Could not determine the dependencies of task ':app:compileDebugJavaWithJavac'.

Could not resolve all task dependencies for configuration ':app:debugCompileClasspath'.
Could not resolve io.flutter:flutter_embedding_debug:1.0.0-540786dd51f112885a89792d678296b95e6622e5.
Required by:
project :app
project :app > project :webview_flutter
> Skipped due to earlier error
Could not resolve io.flutter:x86_64_debug:1.0.0-540786dd51f112885a89792d678296b95e6622e5.
Required by:
project :app
> Skipped due to earlier error
Could not resolve io.flutter:x86_debug:1.0.0-540786dd51f112885a89792d678296b95e6622e5.
Required by:
project :app
> Skipped due to earlier error

  • Try:
    Run with --stacktrace option to get the stack trace. Run with --info or --debug option to get more log output. Run with --scan to get full insights.

  • Get more help at https://help.gradle.org

BUILD FAILED in 2m 41s
Exception: Gradle task assembleDebug failed with exit code 1

iOS chart is getting stuck/hang

Hello,

Flutter 1.7.1

when i test charts features chart stuck or hang and i cannot do anything.

import 'dart:async';
import 'dart:convert';

import 'package:flutter/material.dart';

import 'package:flutter_echarts/flutter_echarts.dart';
import 'package:number_display/number_display.dart';

final display = createDisplay(decimal: 2);

void main() => runApp(MyApp());

class MyApp extends StatelessWidget {
@OverRide
Widget build(BuildContext context) {
return MaterialApp(
theme: ThemeData(
primarySwatch: Colors.blue,
),
home: MyHomePage(),
);
}
}

class MyHomePage extends StatefulWidget {
MyHomePage({Key key}) : super(key: key);

@OverRide
_MyHomePageState createState() => _MyHomePageState();
}

class _MyHomePageState extends State {
final GlobalKey _scaffoldKey = new GlobalKey();

List<Map<String, Object>> _data1 = [{ 'name': 'Please wait', 'value': 0 }];

getData1() async {
await Future.delayed(Duration(seconds: 4));

const dataObj = [{
  'name': 'Jan',
  'value': 8726.2453,
}, {
  'name': 'Feb',
  'value': 2445.2453,
}, {
  'name': 'Mar',
  'value': 6636.2400,
}, {
  'name': 'Apr',
  'value': 4774.2453,
}, {
  'name': 'May',
  'value': 1066.2453,
}, {
  'name': 'Jun',
  'value': 4576.9932,
}, {
  'name': 'Jul',
  'value': 8926.9823,
}];

this.setState(() { this._data1 = dataObj;});

}

@OverRide
void initState() {
super.initState();

this.getData1();

}

@OverRide
Widget build(BuildContext context) {
return Scaffold(
key: _scaffoldKey,
appBar: AppBar(
title: Text('Echarts Demon'),
),
backgroundColor: Colors.white,
body: Center(
child: Column(
children: [

        Container(
          child: Echarts(
            option: '''
              {
                dataset: {
                  dimensions: ['name', 'value'],
                  source: ${jsonEncode(_data1)},
                },
                tooltip: {
  trigger: 'axis',
   
},
      
              dataZoom: [{
  type: 'inside',
  start: 0,
  end: 10
}, {
  start: 0,
  end: 100,
  handleIcon: 'M10.7,11.9v-1.3H9.3v1.3c-4.9,0.3-8.8,4.4-8.8,9.4c0,5,3.9,9.1,8.8,9.4v1.3h1.3v-1.3c4.9-0.3,8.8-4.4,8.8-9.4C19.5,16.3,15.6,12.2,10.7,11.9z M13.3,24.4H6.7V23h6.6V24.4z M13.3,19.6H6.7v-1.4h6.6V19.6z',
  handleSize: '100%',
  handleStyle: {
      color: '#fff',
      shadowBlur: 3,
      shadowColor: 'rgba(0, 0, 0, 0.6)',
      shadowOffsetX: 2,
      shadowOffsetY: 2
  }
}],
                color: ['#3398DB'],
                legend: {
                  data: ['直接访问', '背景'],
                  show: true,
                },
                grid: {
                  left: '0%',
                  right: '0%',
                  bottom: '5%',
                  top: '7%',
                  height: '85%',
                  containLabel: true,
                  z: 22,
                },
                xAxis: [{
                  type: 'category',
                  gridIndex: 0,
                  axisTick: {
                    show: true,
                  },
                  axisLine: {
                    lineStyle: {
                      color: '#000',
                    },
                  },
                  axisLabel: {
                    show: true,
                    color: 'rgb(170,170,170)',
                    formatter: function xFormatter(value, index) {
                      if (index === 6) {
                        return `\${value}\\n*`;
                      }
                      return value;
                    },
                  },
                }],
                yAxis: {
                  type: 'value',
                  gridIndex: 0,
                  splitLine: {
                    show: false,
                  },
                  axisTick: {
                      show: false,
                  },
                  axisLine: {
                    lineStyle: {
                      color: '#0c3b71',
                    },
                  },
                  axisLabel: {
                    color: 'rgb(170,170,170)',
                  },
                  splitNumber: 12,
                  splitArea: {
                    show: true,
                    areaStyle: {
                      color: ['rgba(250,250,250,0.0)', 'rgba(250,250,250,0.05)'],
                    },
                  },
                },
                series: [{
                  name: '合格率',
                  type: 'line',
                  barWidth: '50%',
                  xAxisIndex: 0,
                  yAxisIndex: 0,
                  itemStyle: {
                    normal: {
                      barBorderRadius: 5,
                      color: {
                        type: 'linear',
                        x: 0,
                        y: 0,
                        x2: 0,
                        y2: 1,
                        colorStops: [
                          {
                            offset: 0, color: '#00feff',
                          },
                          {
                            offset: 1, color: '#027eff',
                          },
                          {
                            offset: 1, color: '#0286ff',
                          },
                        ],
                      },
                    },
                  },
                  zlevel: 11,
                }],
              }
            ''',
            extraScript: '''
              chart.on('click', (params) => {
                if(params.componentType === 'series') {
                  Messager.postMessage(JSON.stringify({
                    type: 'select',
                    payload: params.dataIndex,
                  }));
                }
              });
            ''',
            onMessage: (String message) {
              Map<String, Object> messageAction = jsonDecode(message);
              print(messageAction);
              if (messageAction['type'] == 'select') {
                final item = _data1[messageAction['payload']];
                _scaffoldKey.currentState.showSnackBar(
                  SnackBar(
                    content: Text(item['name'].toString() + ': ' + display(item['value'])),
                    duration: Duration(seconds: 2),
                  ));
              }
            },
          ),
          width: 500,
          height: 500,
        ),


      ],
    ),
  ),
);

}
}

get BufferQueueProducer print in console

Hi there,
when i try to install Echarts it works fine but I get much of these warnings in the console :
D/BufferQueueProducer(28647): SurfaceTexture-0-28647-0 cancelBuffer: slot 0
D/BufferQueueProducer(28647): SurfaceTexture-0-28647-0 cancelBuffer: slot 2
D/BufferQueueProducer(28647): SurfaceTexture-0-28647-0 cancelBuffer: slot 0
D/BufferQueueProducer(28647): SurfaceTexture-0-28647-0 cancelBuffer: slot 2

like forever

Recommend Projects

  • React photo React

    A declarative, efficient, and flexible JavaScript library for building user interfaces.

  • Vue.js photo Vue.js

    🖖 Vue.js is a progressive, incrementally-adoptable JavaScript framework for building UI on the web.

  • Typescript photo Typescript

    TypeScript is a superset of JavaScript that compiles to clean JavaScript output.

  • TensorFlow photo TensorFlow

    An Open Source Machine Learning Framework for Everyone

  • Django photo Django

    The Web framework for perfectionists with deadlines.

  • D3 photo D3

    Bring data to life with SVG, Canvas and HTML. 📊📈🎉

Recommend Topics

  • javascript

    JavaScript (JS) is a lightweight interpreted programming language with first-class functions.

  • web

    Some thing interesting about web. New door for the world.

  • server

    A server is a program made to process requests and deliver data to clients.

  • Machine learning

    Machine learning is a way of modeling and interpreting data that allows a piece of software to respond intelligently.

  • Game

    Some thing interesting about game, make everyone happy.

Recommend Org

  • Facebook photo Facebook

    We are working to build community through open source technology. NB: members must have two-factor auth.

  • Microsoft photo Microsoft

    Open source projects and samples from Microsoft.

  • Google photo Google

    Google ❤️ Open Source for everyone.

  • D3 photo D3

    Data-Driven Documents codes.