Comments (4)
 enblacar
commented on June 8, 2024
2
enblacar
commented on June 8, 2024
2
Hello @ccruizm,
Thanks for using my package! I am happy that you like it!
Indeed, that is a very interesting feature. Probably, the feature was not present in Seurat when I first coded SCpubr::do_FeaturePlot() (it was one of the very first in the package). I will put it in the To-Do list for the next update :P!
In the meantime, you can use the following hotfix to get the same results as you would get with Seurat::FeaturePlot():
#' Modify scales of a Feature Plot.
#'
#' This function transforms all the values in a FeaturePlot that are below min.cutoff to min.cutoff and above max.cutoff to max.cutoff, effectively
#' achieving the same behaviour as in Seurat::FeaturePlot. All credits for this idea goes to the Seurat developers.
#'
#' @param p Plot resulting from calling SCpubr::do_FeaturePlot() with a single feature and no extra parameters.
#' @param feature Feature used in p.
#' @param min.cutoff Minimum range of the scale.
#' @param max.cutoff Maximum range of the scale.
#'
#' @return A ggplot2 object with the scales modified.
#' @export
#'
#' @examples
modify_scales <- function(p,
                          feature,
                          min.cutoff = NULL,
                          max.cutoff = NULL){
  `%>%` <- magrittr::`%>%`
  `:=` <- rlang::`:=`

  # Apply min.cutoff.
  if (!is.null(min.cutoff)){
    p$data <- p$data %>%
              dplyr::mutate("{feature}" := ifelse(.data[[feature]] < min.cutoff, min.cutoff, .data[[feature]]))
  }

  # Apply max.cutoff.
  if (!is.null(max.cutoff)){
    p$data <- p$data %>%
              dplyr::mutate("{feature}" := ifelse(.data[[feature]] > max.cutoff, max.cutoff, .data[[feature]]))
  }

  return(p)
}
Let's use this case as an example:
# SCpubr
p1 <- SCpubr::do_FeaturePlot(sample,
                             features = "LYN",
                             order = FALSE)

# Seurat
p2 <- Seurat::FeaturePlot(sample,
                          features = "LYN") +
      ggplot2::scale_color_viridis_c(option = "G")

p <- p1 | p2
p
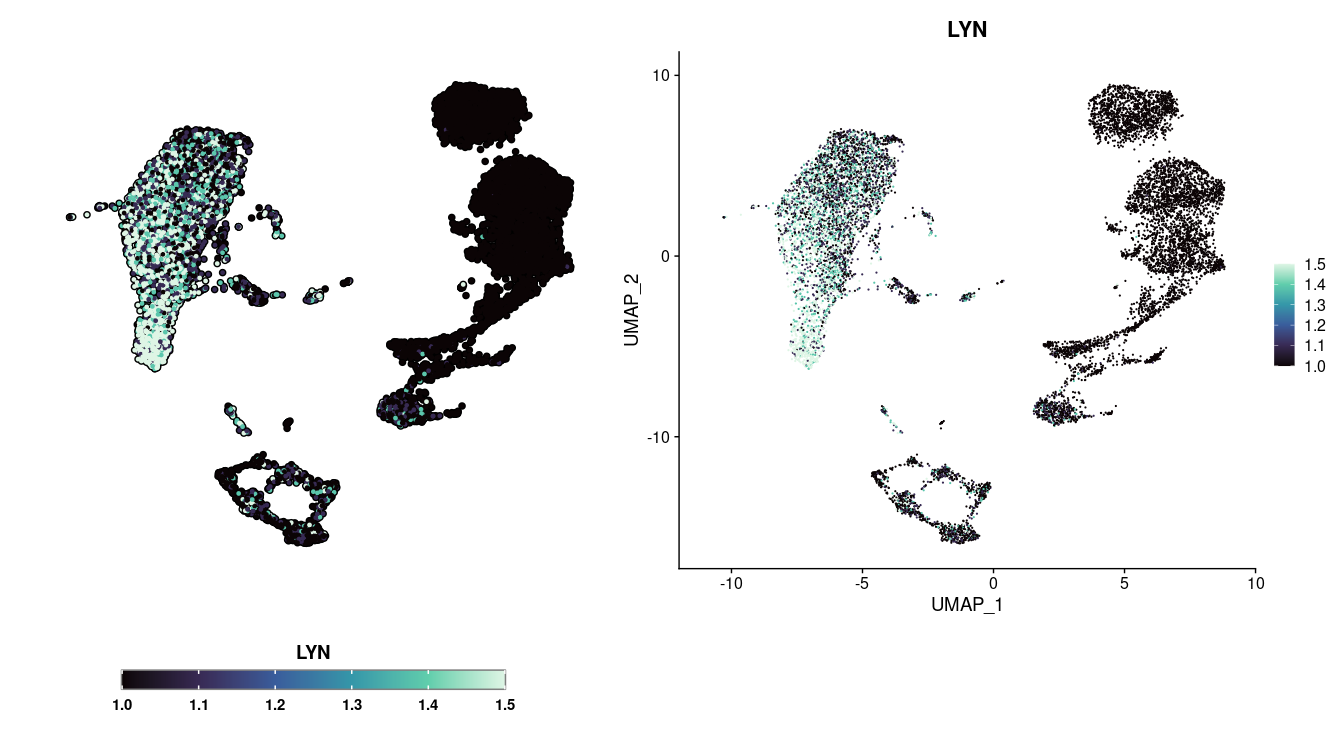
Let's say, we want to modify the scale so that it plots values between 1 and 1.5. With this function, you just need to provide the resulting plot of calling SCpubr::do_FeaturePlot(), with the values of min.cutoff, max.cutoff that you want. Like this:
# Limit in the scale - SCpubr (hotfix)
p1 <- SCpubr::do_FeaturePlot(sample,
                             features = "LYN",
                             order = FALSE)

p1 <- modify_scales(p = p1,
                    feature = "LYN",
                    min.cutoff = 1,
                    max.cutoff = 1.5)

# Limit in the scale - Seurat
p2 <- Seurat::FeaturePlot(sample,
                          features = "LYN",
                          min.cutoff = 1,
                          max.cutoff = 1.5) +
      ggplot2::scale_color_viridis_c(option = "G")

p <- p1 | p2
p
This should give the same output!
However, as I had a look into how Seurat does it, I noticed the following:
- If you just used
gggplo2::scale_color_viridis_c(limits = c(1, 1.5)you will get your Feature plot full of grey dots, corresponding to NA values. - Looking into
Seurat::FeaturePlot()'s code, I noticed that they then convert the cells outside the range tomin.cutoffandmax.cutoff. Therefore, take this into account when using this functionality, that the end colors of the continuous scale represent cells outside the desired range, and not the actual values. This is specially important for the values belowmin.cutoff.
An easy way to avoid this issue is to leave min.cutoff = NULL if you just want to eliminate those sparse cells with very high values in your plot:
# Limit in the scale but keep low values - SCpubr (hotfix)
p <- SCpubr::do_FeaturePlot(sample,
                            features = "LYN",
                            order = FALSE)

p <- modify_scales(p = p,
                   feature = "LYN",
                   min.cutoff = NULL,
                   max.cutoff = 1.5)
p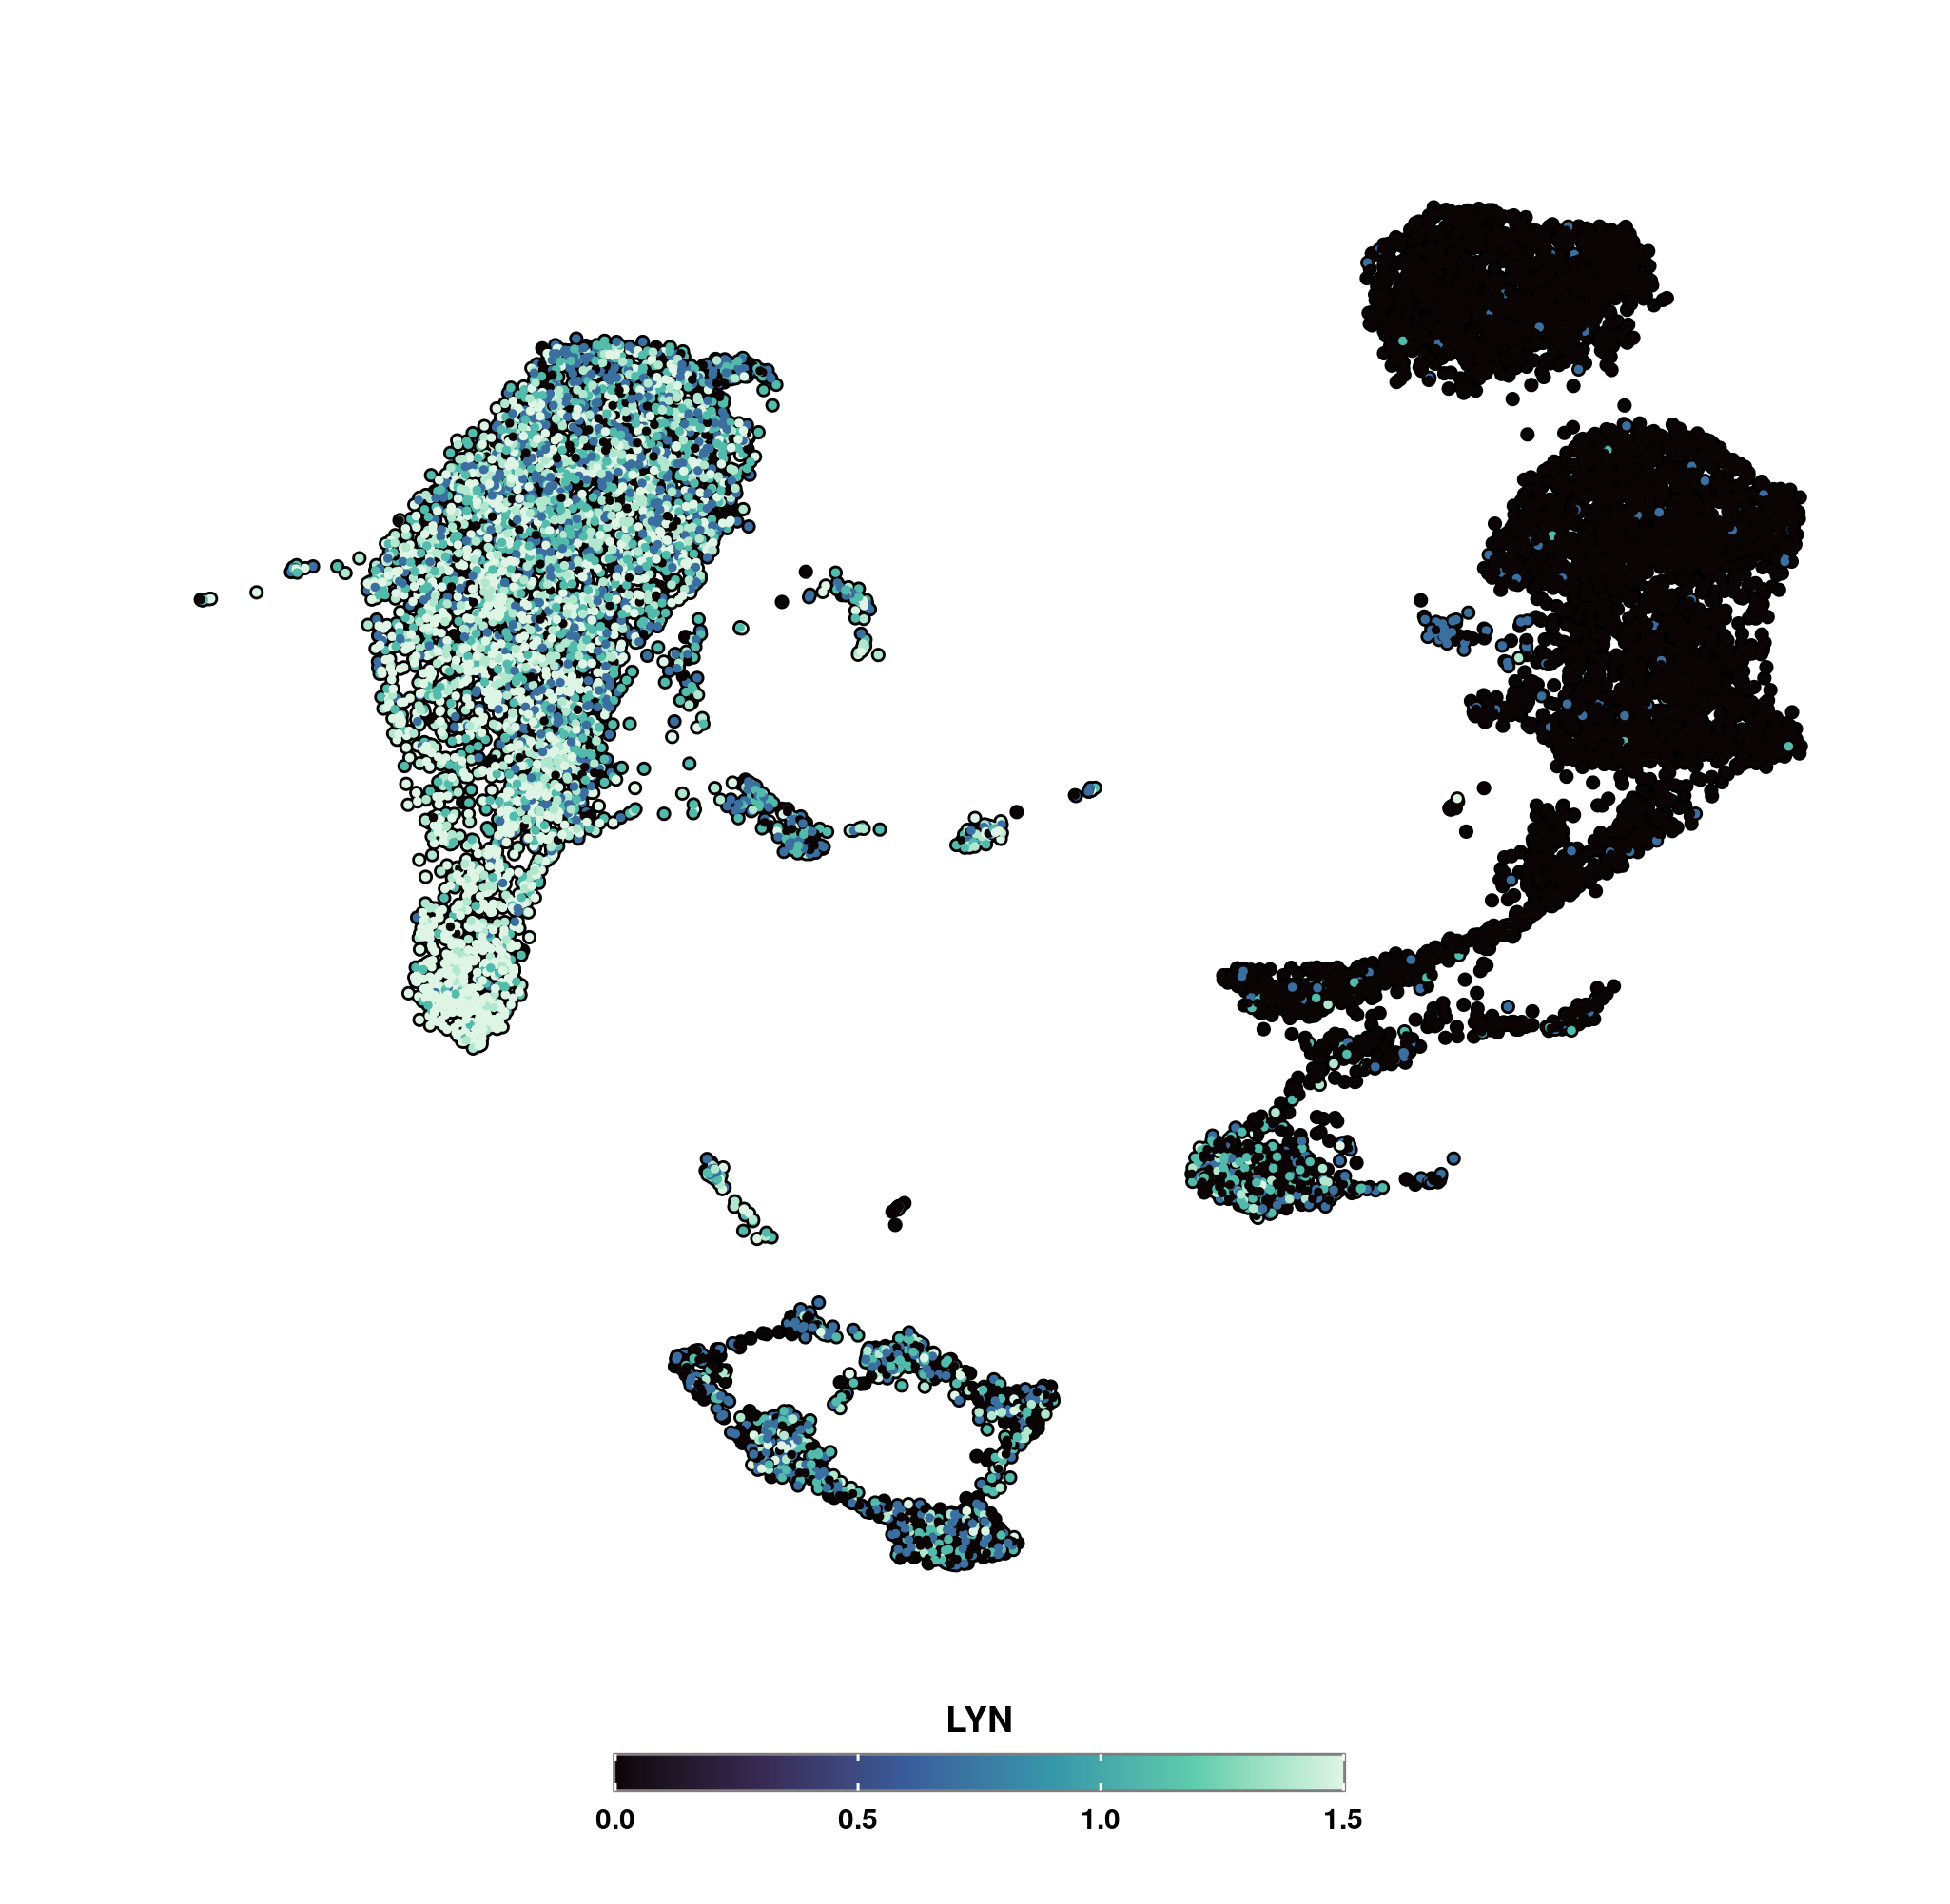
I hope this helps!
Enrique
from scpubr.
 ccruizm
commented on June 8, 2024
1
ccruizm
commented on June 8, 2024
1
Thank you for the clear and detailed reply! It definitely helps. Will give it a try, keeping in mind the drawback you mentioned. Again, really cool package :)
from scpubr.
enblacar
commented on June 8, 2024
Hi @ccruizm,
In SCpubr v1.0.2 min.cutoff and max.cutoff should work as intended and can now be used as parameters to the SCpubr::do_DimPlot() function.
Please update the package from CRAN and I hope it works well for you!
Thanks for your feedback!
Enrique
from scpubr.
ccruizm
commented on June 8, 2024
That's awesome! thanks for implementing it so fast! will install this update asap :)
from scpubr.
Related Issues (20)
- Share SCpubr book for version 1.1.2 HOT 2
- Error using do_DimPlot when using split.by HOT 2
- BUG | do_LigandReceptorPlot() |"arrange_interactions_by = both" implementation HOT 1
- Marking Frequency % inside Barplot stacks HOT 5
- BUG | FUNCTION NAME | BRIEF DESCRIPTION HOT 5
- "Undefined columns selected" | do_FunctionalAnnotationPlot | Function doesn't run HOT 2
- background of label in DimPlot HOT 1
- BUG | do_DimPlot | Multiple legends are visualised when "Group by a variable but split by another" HOT 3
- check_suggests does not print missing package names | check_suggests HOT 1
- BUG | `.GetAssayData` | Incorrect assumptions about SeuratObject versions HOT 1
- How to manually edit the complexHeatmap parameters after generating the heatmap? HOT 1
- BUG | do_EnrichmentHeatmap | features.order not working? HOT 1
- Prepare for upcoming Seurat v5 release HOT 1
- [do_DimPlot] add an option to hide the "combined" view HOT 2
- SCpubr suugests rgdal, but rgdal will be archived, as announced months ago, on 16 October HOT 1
- REQUEST | do_DimPlot | using "split.by" I do not want to see a "combined" plot HOT 4
- REQUEST | do_ViolinPlot | I want order to be added HOT 2
- Where is the function do_AzimuthAnalysisPlot HOT 1
- do_GroupwiseDEPlot with output of FindConservedMarkers HOT 1
- do_DotPlot Sequential palette, diverging, white on extreme low end HOT 1
Recommend Projects
-
 React
React
A declarative, efficient, and flexible JavaScript library for building user interfaces.
-
Vue.js
🖖 Vue.js is a progressive, incrementally-adoptable JavaScript framework for building UI on the web.
-
 Typescript
TypeScript is a superset of JavaScript that compiles to clean JavaScript output.
-
TensorFlow
An Open Source Machine Learning Framework for Everyone
-
Django
The Web framework for perfectionists with deadlines.
-
 Laravel
A PHP framework for web artisans
-
D3
Bring data to life with SVG, Canvas and HTML. 📊📈🎉
-
Recommend Topics
-
javascript
JavaScript (JS) is a lightweight interpreted programming language with first-class functions.
-
web
Some thing interesting about web. New door for the world.
-
server
A server is a program made to process requests and deliver data to clients.
-
Machine learning
Machine learning is a way of modeling and interpreting data that allows a piece of software to respond intelligently.
-
Visualization
Some thing interesting about visualization, use data art
-
Game
Some thing interesting about game, make everyone happy.
Recommend Org
-
Facebook
We are working to build community through open source technology. NB: members must have two-factor auth.
-
Microsoft
Open source projects and samples from Microsoft.
-
Google
Google ❤️ Open Source for everyone.
-
Alibaba
Alibaba Open Source for everyone
-
D3
Data-Driven Documents codes.
-
Tencent
China tencent open source team.
from scpubr.