VERSION 2 OUT NOW => twitterbot2
Follow https://twitter.com/edoardottt2
CLI Twitter Bot. It's made to reach more engagement based on your interests.


![]()
Take a look


-
Download this repo and open a terminal inside the main folder
-
Install the required libraries:
pip install -r requirements.txt -
ONLY FOR LINUX
-
Execute this
export PATH=$PATH:/path/to/directory/of/executable/downloaded/in/previous/step
-
To start the bot searching for some keywords:
python twitterbot.py -u [email protected] -k trend,topics,twitter -
To start the bot with your feed:
python twitterbot.py -u [email protected] -m -
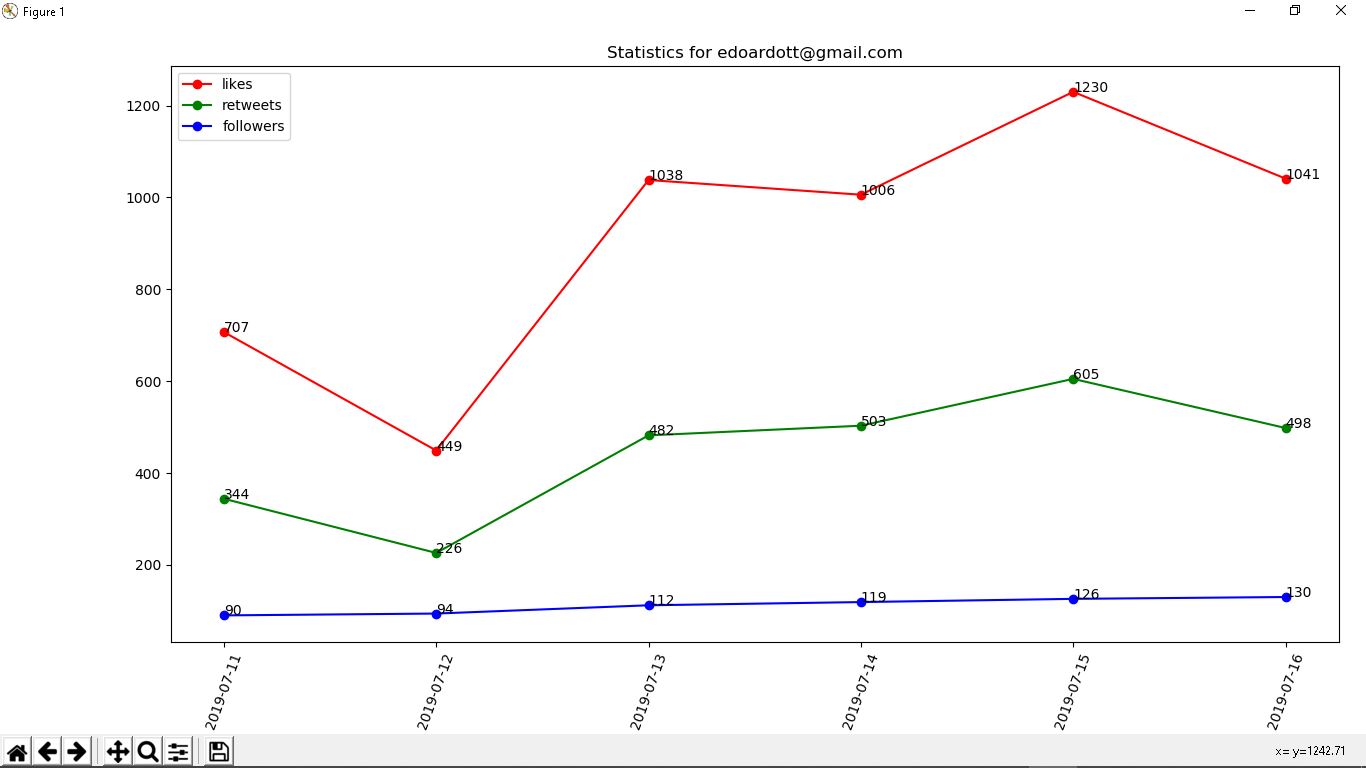
To see your account bot statistics with a chart:
python twitterbot.py -u [email protected] -s -
To see info:
python twitterbot.py -i -
Help doc.:
python twitterbot.py -h -
Follow the followers of an user:
python twitterbot.py -u [email protected] -f edoardottt2
It uses selenium, matplotlib, getpass and other famous python libraries.
It tries to login with an email and a password on Twitter. If credentials are correct, It looks into the database if that user logged in yet and so if There is a record with that username id. If there isn't that record, It creates it. If the credentials aren't correct, throws an error.
It captures the followers count in your Home. You can decide if It searches for some keywords as input and It will looks for some tweets searching those words in the search input field. Instead you can crawl the tweets present in your Home Feed.
The tweets links listed in the result pages are copied in a unique list X. The elements of this X list are shuffled and then It starts to search those tweets. Surely It presses the heart button on all of those, then It maybe retweets them.
Why maybe?
Because It only retweets the ~50% of all tweets reached (but puts likes on all).
Why ~50% and not exactly 50%?
Because for little numbers, less trendingand low content keywords and few tweets in your feed (so the captured links < 30-40) It retweets about 40-65% of all tweets reached.
Instead for big numbers, most trending, with high content keywords and so if your feed contains so many tweets (so the captured links > 80-90) It's more precise and almost exactly retweets 50% of them (with a low error like 3-4%).
When It finish, It stores all the likes and retweets count in a SQLite3 database called database.db
With the -s option (only if the password matches the word stored in the database on the same record of that username) It displays (with the help of matplotlib) a chart that shows the amount of likes, retweets and followers per day.
- Mozilla Firefox
- Python >= 3.0
- selenium (
pip install selenium) OR geckodriver - matplotlib (
python -m pip install -U matplotlib) - It works only with desktop-type Twitter website window
Assuming you are in the same folder of the scripts and you run them with python3:
Usage: python twitterbot.py -u [value] {-k [values separated by comma] OR -s OR -m} OR -i OR -h
-u or --username:
It's your twitter username(e-mail)
-k or --keywords:
    It's/They are the keyword[s] you want to crawl

    If you want to insert multiple keywords you have to separated them by comma:

    e.g. -k climatechange,techtips,python
-s or --stat:
    If you want to see your stats account with a chart.

    Insert only -u [value] -s
-m or --mine:
    If you want to crawl your feed's tweets.

    Insert only -u [value] -m
-i or --info:
    To see twitterBot info.

    Insert only -i
-h or --help:
    Help documentation

    Insert only -h
-f or --follow:
    Insert an username. The bot will check for some
    followers of that username and it tries to follow them.

    Insert -f username
git clone https://github.com/edoardottt/twitterBot.git
Just open an issue / pull request.
    ADDED:
            - Security bugs fixed
    ADDED:
            - f option. Follow random accounts
    ADDED:
            - Refactoring
            - Added dynamical prints
            - Set the plot title
            - Fixed some knows bugs (limit print, typing errors)
    ADDED:

            - Added -i or --info option that calls print_usage(7) = version, github site, License.
            - Added -h or --help option that calls print_usage(0)
            - Added twitterBot_log.txt file function that catches the exceptions
              and write them into it.
            - If isn't present any option after -u calls print_usage(8) = Error 8: Bad input
            - Check if the internet connection status is active, otherwise print_usage(6) =
              Error 6: no internet connection

    CHANGED:

            - -h or --hashtags changed in -k or --keywords

    REMOVED:

            - Print the website URL on print_usage(0)
    - Crawling updates (time, likes and retweets) print on the same line and then flush it
    - Added followers update that appears on the chart
    - Added point marker on the chart
v 1.3.1:
    - Password input not readable
    - Statistics aggregated per days
    - Bad input handled. All error prints migrated on print_usage(error_code)
    - When it's crawling, doesn't print milliseconds
v 1.3:
    - Added a better visualization of statistics for every user with matplotlib
    - With -s option now It shows a chart that shows likes and retweets for each performance performed
v 1.2.1:
- Now It prints the links crawled in your home/search input field
v 1.2:
    - Added some files that create an SQLite3 database and stores users and bot sessions

        table Users
        It contains all the users authenticated by twitter

        table analytics
        It contains all the likes and retweets count of all bot sessions

    - Fixed some known bugs (invalid credentials, bad usage..)
    - More readable usage printer
v1.1:
- Catching some known Exceptions
v1.0:
- First release
This repository is under MIT License.
edoardoottavianelli.it to contact me.