Giter Club home page Giter Club logo

calendar-heatmap's Introduction

This project is not actively maintained

D3 Calendar Heatmap

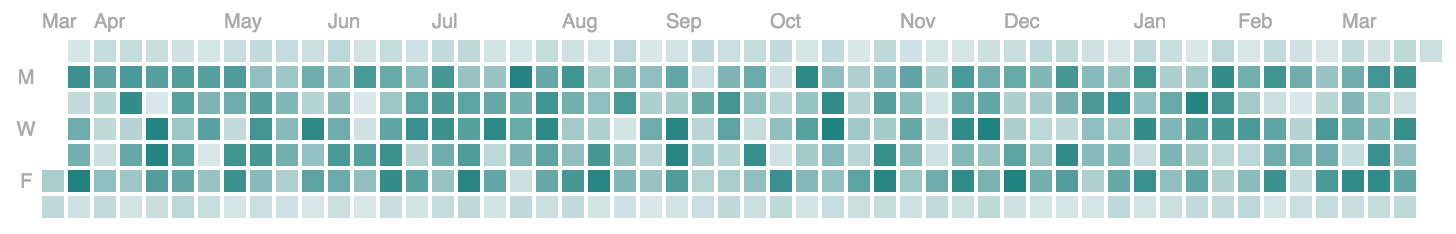
A d3.js heatmap representing time series data. Inspired by Github's contribution chart

Reusable D3.js Calendar Heatmap chart

Configuration

Property Usage Default Required
data Chart data none yes
selector DOM selector to attach the chart to body no
max Maximum count max found in data no
startDate Date to start heatmap at 1 year ago no
colorRange Minimum and maximum chart gradient colors ['#D8E6E7', '#218380'] no
tooltipEnabled Option to render a tooltip true no
tooltipUnit Unit to render on the tooltip, can be object for pluralization control 'contributions' no
legendEnabled Option to render a legend true no
onClick callback function on day click events (see example below) null no
locale Object to translate every word used, except for tooltipUnit see below no

Default locale object

{
    months: ['Jan', 'Feb', 'Mar', 'Apr', 'May', 'Jun', 'Jul', 'Aug', 'Sep', 'Oct', 'Nov', 'Dec'],
    days: ['S', 'M', 'T', 'W', 'T', 'F', 'S'],
    No: 'No',
    on: 'on',
    Less: 'Less',
    More: 'More'
}

Dependencies

Usage

1: Add d3.js and moment.js

2: Include calendar-heatmap.js and calendar-heatmap.css <link rel="stylesheet" type="text/css" href="path/tocalendar-heatmap.css"> <script src="path/to/calendar-heatmap.js"></script>

3: Format the data so each array item has a date and count property. As long as new Date() can parse the date string it's ok. Note - there all data should be rolled up into daily bucket granularity.

4: Configure the chart and render it

// chart data example
var chartData = [{
  date: valid Javascript date object,
  count: Number
}];
var chart1 = calendarHeatmap()
              .data(chartData)
              .selector('#chart-one')
              .colorRange(['#D8E6E7', '#218380'])
              .tooltipEnabled(true)
              .onClick(function (data) {
                console.log('onClick callback. Data:', data);
              });
chart1();  // render the chart

control unit pluralization

var chart1 = calendarHeatmap()
              .data(chartData)
              .tooltipUnit(
                [
                  {min: 0, unit: 'contribution'},
                  {min: 1, max: 1, unit: 'contribution'},
                  {min: 2, max: 'Infinity', unit: 'contributions'}
                ]
              );
chart1();  // render the chart

Pull Requests and issues

...are very welcome!

calendar-heatmap's People

Contributors

adschellevis avatar cy6erskunk avatar dkirwan avatar joan16v avatar paradite avatar peterdesmet avatar phillipjohnson avatar raksonibs avatar rsilnav avatar sirgallifrey avatar wataruoguchi avatar

Stargazers

 avatar  avatar  avatar  avatar  avatar  avatar  avatar  avatar  avatar  avatar  avatar  avatar  avatar  avatar  avatar  avatar  avatar  avatar  avatar  avatar  avatar  avatar  avatar  avatar  avatar  avatar  avatar  avatar  avatar  avatar  avatar  avatar  avatar  avatar  avatar  avatar  avatar  avatar  avatar  avatar  avatar  avatar  avatar  avatar  avatar  avatar  avatar  avatar  avatar  avatar  avatar  avatar  avatar  avatar  avatar  avatar  avatar  avatar  avatar  avatar  avatar  avatar  avatar  avatar  avatar  avatar  avatar  avatar  avatar  avatar  avatar  avatar  avatar  avatar  avatar  avatar  avatar  avatar  avatar  avatar  avatar  avatar  avatar  avatar  avatar  avatar  avatar  avatar  avatar  avatar  avatar  avatar  avatar  avatar  avatar  avatar  avatar  avatar  avatar  avatar

Watchers

 avatar  avatar  avatar  avatar  avatar  avatar  avatar  avatar  avatar  avatar  avatar  avatar  avatar  avatar  avatar  avatar  avatar  avatar  avatar  avatar  avatar  avatar  avatar  avatar  avatar  avatar  avatar  avatar  avatar  avatar  avatar  avatar  avatar  avatar  avatar  avatar  avatar

Recommend Projects

  • React photo React

    A declarative, efficient, and flexible JavaScript library for building user interfaces.

  • Vue.js photo Vue.js

    ๐Ÿ–– Vue.js is a progressive, incrementally-adoptable JavaScript framework for building UI on the web.

  • Typescript photo Typescript

    TypeScript is a superset of JavaScript that compiles to clean JavaScript output.

  • TensorFlow photo TensorFlow

    An Open Source Machine Learning Framework for Everyone

  • Django photo Django

    The Web framework for perfectionists with deadlines.

  • D3 photo D3

    Bring data to life with SVG, Canvas and HTML. ๐Ÿ“Š๐Ÿ“ˆ๐ŸŽ‰

Recommend Topics

  • javascript

    JavaScript (JS) is a lightweight interpreted programming language with first-class functions.

  • web

    Some thing interesting about web. New door for the world.

  • server

    A server is a program made to process requests and deliver data to clients.

  • Machine learning

    Machine learning is a way of modeling and interpreting data that allows a piece of software to respond intelligently.

  • Game

    Some thing interesting about game, make everyone happy.

Recommend Org

  • Facebook photo Facebook

    We are working to build community through open source technology. NB: members must have two-factor auth.

  • Microsoft photo Microsoft

    Open source projects and samples from Microsoft.

  • Google photo Google

    Google โค๏ธ Open Source for everyone.

  • D3 photo D3

    Data-Driven Documents codes.