
The goals / steps of this project are the following:
- Compute the camera calibration matrix and distortion coefficients given a set of chessboard images.
- Apply a distortion correction to raw images.
- Use color transforms, gradients, etc., to create a thresholded binary image.
- Apply a perspective transform to rectify binary image ("birds-eye view").
- Detect lane pixels and fit to find the lane boundary.
- Determine the curvature of the lane and vehicle position with respect to center.
- Warp the detected lane boundaries back onto the original image.
- Output visual display of the lane boundaries and numerical estimation of lane curvature and vehicle position.
It can estimate the parameters of a lens and image sensor of an image or video camera. These parameters can be used to correct for lens distortion, measure the size of an object in world units, or determine the location of the camera in the scene.
Opencv can claiberate camera to find out the parameters for reducing the distortion. Typical way is calibrating the chessboard image using findChessboardCorners function from opencv and findout mtx, dist parameters for the reducing the distortion.
nx = 9
ny = 6
objpoints = []
imgpoints = []
objp = np.zeros((9*6,3), np.float32)
objp[:,:2] = np.mgrid[0:9,0:6].T.reshape(-1,2)

#Finding in mtx, dst
img = cv2.imread('camera_cal/calibration2.jpg')

# Convert to grayscale
gray = cv2.cvtColor(img, cv2.COLOR_BGR2GRAY)

# Find the chessboard corners
ret, corners = cv2.findChessboardCorners(gray, (nx, ny), None)

# If found, draw corners
if ret == True:
    imgpoints.append(corners)
    objpoints.append(objp)

    # Draw and display the corners
    cv2.drawChessboardCorners(img, (nx, ny), corners, ret)

ret, mtx, dist, rvecs, tvecs = cv2.calibrateCamera(objpoints, imgpoints, gray.shape[::-1], None, None)

mtx, dist parameters from calibration image is used to undistort the image using undistort function in opencv.
def undistort_image(img, mtx, dist):
    return cv2.undistort(img, mtx, dist, None, mtx)

I have used various combination of color and gradient thresholds to generate a binary image where the lane lines are clearly visible.. I have used gradient on x and y direction, manginutude of the gradient, direction of the gradient, and color transformation technique to get the final binary image.
def abs_sobel_thresh(img, orient='x', sobel_kernel=3, thresh=(0, 255)):
    img = cv2.cvtColor(img, cv2.COLOR_BGR2RGB)
    gray = cv2.cvtColor(img, cv2.COLOR_RGB2GRAY)
    scaled_sobel = None

    # Sobel x
    if orient == 'x':
        sobelx = cv2.Sobel(gray, cv2.CV_64F, 1, 0,ksize=sobel_kernel) # Take the derivative in x
        abs_sobelx = np.absolute(sobelx) # Absolute x derivative to accentuate lines away from horizontal
        scaled_sobel = np.uint8(255*abs_sobelx/np.max(abs_sobelx))

    # Sobel y
    else:
        sobely = cv2.Sobel(gray, cv2.CV_64F, 0, 1, ksize=sobel_kernel) # Take the derivative in y
        abs_sobely = np.absolute(sobely) # Absolute x derivative to accentuate lines away from horizontal
        scaled_sobel = np.uint8(255*abs_sobely/np.max(abs_sobely))

    # Threshold x gradient
    thresh_min = thresh[0]
    thresh_max = thresh[1]
    grad_binary = np.zeros_like(scaled_sobel)
    grad_binary[(scaled_sobel >= thresh_min) & (scaled_sobel <= thresh_max)] = 1

    return grad_binary

def mag_thresh(img, sobel_kernel=3, mag_thresh=(0, 255)):
    img = cv2.cvtColor(img, cv2.COLOR_BGR2RGB)
    gray = cv2.cvtColor(img, cv2.COLOR_RGB2GRAY)
    sobelx = cv2.Sobel(gray, cv2.CV_64F, 1, 0,ksize=sobel_kernel)
    sobely = cv2.Sobel(gray, cv2.CV_64F, 0, 1,ksize=sobel_kernel)
    magnitude = np.sqrt(np.square(sobelx)+np.square(sobely))
    abs_magnitude = np.absolute(magnitude)
    scaled_magnitude = np.uint8(255*abs_magnitude/np.max(abs_magnitude))
    mag_binary = np.zeros_like(scaled_magnitude)
    mag_binary[(scaled_magnitude >= mag_thresh[0]) & (scaled_magnitude <= mag_thresh[1])] = 1

    return mag_binary

def dir_threshold(img, sobel_kernel=3, thresh=(0, np.pi/2)):
    img = cv2.cvtColor(img, cv2.COLOR_BGR2RGB)
    gray = cv2.cvtColor(img, cv2.COLOR_RGB2GRAY)
    sobelx = cv2.Sobel(gray, cv2.CV_64F, 1, 0,ksize=sobel_kernel)
    sobely = cv2.Sobel(gray, cv2.CV_64F, 0, 1,ksize=sobel_kernel)
    abs_sobelx = np.absolute(sobelx)
    abs_sobely = np.absolute(sobely)
    arctan = np.arctan2(abs_sobely, abs_sobelx)
    dir_binary = np.zeros_like(arctan)
    dir_binary[(arctan >= thresh[0]) & (arctan <= thresh[1])] = 1

    return dir_binary


def combined_s_gradient_thresholds(img, show=False):

    # Choose a Sobel kernel size
    ksize = 3 # Choose a larger odd number to smooth gradient measurements

    # Apply each of the thresholding functions
    gradx = abs_sobel_thresh(img, orient='x', sobel_kernel=ksize, thresh=(20, 100))
    grady = abs_sobel_thresh(img, orient='y', sobel_kernel=ksize, thresh=(20, 100))
    mag_binary = mag_thresh(img, sobel_kernel=ksize, mag_thresh=(20, 100))
    dir_binary = dir_threshold(img, sobel_kernel=ksize, thresh=(0.7, 1.4))

    combined = np.zeros_like(dir_binary)
    combined[((gradx == 1) & (grady == 1)) | ((mag_binary == 1) & (dir_binary == 1))] = 1

    img = cv2.cvtColor(img, cv2.COLOR_BGR2RGB)
    hls = cv2.cvtColor(img, cv2.COLOR_RGB2HLS)
    s_channel = hls[:,:,2]

    # Threshold color channel
    s_thresh_min = 150
    s_thresh_max = 255
    s_binary = np.zeros_like(s_channel)
    s_binary[(s_channel >= s_thresh_min) & (s_channel <= s_thresh_max)] = 1

    # Combine the two binary thresholds
    combined_binary = np.zeros_like(combined)

    combined_binary[(s_binary == 1) | (combined == 1)] = 1

    if show == True:
        f, (ax1, ax2, ax3, ax4) = plt.subplots(1, 4, figsize=(20,10))
        ax1.set_title('Actual image')
        ax1.imshow(img)
        ax2.set_title('Combined gradx,grady,magnitude,direction')
        ax2.imshow(combined, cmap='gray')
        ax3.set_title('Color thresholding')
        ax3.imshow(s_binary, cmap='gray')
        ax4.set_title('Combined all')
        ax4.imshow(combined_binary, cmap='gray')

    return combined_binary

A perspective transform maps the points in a given image to different, desired, image points with a new perspective. The perspective transform you’ll be most interested in is a bird’s-eye view transform that let’s us view a lane from above; this will be useful for calculating the lane curvature.
Opencv provide two functions getPerspectiveTransform and warpPerspective to perform this task.
def transform_image(img, nx, ny):
    offset = 100 # offset for dst points

    # Grab the image shape
    img_size = (img.shape[1], img.shape[0])

    leftupperpoint  = [568,470]
    rightupperpoint = [717,470]
    leftlowerpoint  = [260,680]
    rightlowerpoint = [1043,680]

    src = np.float32([leftupperpoint, leftlowerpoint, rightupperpoint, rightlowerpoint])
    dst = np.float32([[200,0], [200,680], [1000,0], [1000,680]])

    # Given src and dst points, calculate the perspective transform matrix
    M = cv2.getPerspectiveTransform(src, dst)

    # Warp the image using OpenCV warpPerspective()
    warped = cv2.warpPerspective(img, M, img_size, flags=cv2.INTER_NEAREST)

    return warped, M
![]()
Describe how (and identify where in your code) you identified lane-line pixels and fit their positions with a polynomial?
After applying calibration, thresholding, and a perspective transform to a road image, you should have a binary image where the lane lines stand out clearly. However, you still need to decide explicitly which pixels are part of the lines and which belong to the left line and which belong to the right line.
I first take a histogram along all the columns in the lower half of the image.
histogram = np.sum(binary_warped[binary_warped.shape[0]/2:,:], axis=0)
With this histogram I am adding up the pixel values along each column in the image. In my thresholded binary image, pixels are either 0 or 1, so the two most prominent peaks in this histogram will be good indicators of the x-position of the base of the lane lines. I can use that as a starting point for where to search for the lines. From that point, I can use a sliding window, placed around the line centers, to find and follow the lines up to the top of the frame.
def locate_lines(binary_warped, nwindows = 9, margin = 100, minpix = 50):
    # Assuming you have created a warped binary image called "binary_warped"
    # Take a histogram of the bottom half of the image
    histogram = np.sum(binary_warped[int(binary_warped.shape[0]/2):,:], axis=0)

    # Find the peak of the left and right halves of the histogram
    # These will be the starting point for the left and right lines
    midpoint = np.int(histogram.shape[0]/2)
    leftx_base = np.argmax(histogram[:midpoint])
    rightx_base = np.argmax(histogram[midpoint:]) + midpoint

    # Set height of windows
    window_height = np.int(binary_warped.shape[0]/nwindows)
    # Identify the x and y positions of all nonzero pixels in the image
    nonzero = binary_warped.nonzero()
    nonzeroy = np.array(nonzero[0])
    nonzerox = np.array(nonzero[1])
    # Current positions to be updated for each window
    leftx_current = leftx_base
    rightx_current = rightx_base

    # Create empty lists to receive left and right lane pixel indices
    left_lane_inds = []
    right_lane_inds = []

    # Create an image to draw on and an image to show the selection window
    out_img = np.dstack((binary_warped, binary_warped, binary_warped))*255

    # Step through the windows one by one
    for window in range(nwindows):
        # Identify window boundaries in x and y (and right and left)
        win_y_low = binary_warped.shape[0] - (window+1)*window_height
        win_y_high = binary_warped.shape[0] - window*window_height
        win_xleft_low = leftx_current - margin
        win_xleft_high = leftx_current + margin
        win_xright_low = rightx_current - margin
        win_xright_high = rightx_current + margin
        # Draw the windows on the visualization image
        cv2.rectangle(out_img,(win_xleft_low,win_y_low),(win_xleft_high,win_y_high),
        (0,255,0), 2)
        cv2.rectangle(out_img,(win_xright_low,win_y_low),(win_xright_high,win_y_high),
        (0,255,0), 2)
        # Identify the nonzero pixels in x and y within the window
        good_left_inds = ((nonzeroy >= win_y_low) & (nonzeroy < win_y_high) &
        (nonzerox >= win_xleft_low) &  (nonzerox < win_xleft_high)).nonzero()[0]
        good_right_inds = ((nonzeroy >= win_y_low) & (nonzeroy < win_y_high) &
        (nonzerox >= win_xright_low) &  (nonzerox < win_xright_high)).nonzero()[0]
        # Append these indices to the lists
        left_lane_inds.append(good_left_inds)
        right_lane_inds.append(good_right_inds)
        # If you found > minpix pixels, recenter next window on their mean position
        if len(good_left_inds) > minpix:
            leftx_current = np.int(np.mean(nonzerox[good_left_inds]))
        if len(good_right_inds) > minpix:
            rightx_current = np.int(np.mean(nonzerox[good_right_inds]))

    # Concatenate the arrays of indices
    left_lane_inds = np.concatenate(left_lane_inds)
    right_lane_inds = np.concatenate(right_lane_inds)

    # Extract left and right line pixel positions
    leftx = nonzerox[left_lane_inds]
    lefty = nonzeroy[left_lane_inds]
    rightx = nonzerox[right_lane_inds]
    righty = nonzeroy[right_lane_inds]

    # Fit a second order polynomial to each
    left_fit = np.polyfit(lefty, leftx, 2)
    right_fit = np.polyfit(righty, rightx, 2)

    return left_fit, right_fit,left_lane_inds, right_lane_inds, nonzerox, nonzeroy

We can draw a circle that closely fits nearby points on a local section of a curve, as follows.

We say the curve and the circle osculate (which means "to kiss"), since the 2 curves have the same tangent and curvature at the point where they meet.
The radius of curvature of the curve at a particular point is defined as the radius of the approximating circle. This radius changes as we move along the curve.
The radius of curvature at any point x of the function x=f(y) is given as follows:

def radius_curvature(binary_warped, left_fit, right_fit):

    ploty = np.linspace(0, binary_warped.shape[0]-1, binary_warped.shape[0] )
    left_fitx = left_fit[0]*ploty**2 + left_fit[1]*ploty + left_fit[2]
    right_fitx = right_fit[0]*ploty**2 + right_fit[1]*ploty + right_fit[2]

    # Define conversions in x and y from pixels space to meters
    ym_per_pix = 30/720 # meters per pixel in y dimension
    xm_per_pix = 3.7/700 # meters per pixel in x dimension
    y_eval = np.max(ploty)

    # Fit new polynomials to x,y in world space
    left_fit_cr = np.polyfit(ploty*ym_per_pix, left_fitx*xm_per_pix, 2)
    right_fit_cr = np.polyfit(ploty*ym_per_pix, right_fitx*xm_per_pix, 2)

    # Calculate the new radii of curvature
    left_curvature =  ((1 + (2*left_fit_cr[0] *y_eval*ym_per_pix + left_fit_cr[1])**2) **1.5) / np.absolute(2*left_fit_cr[0])
    right_curvature = ((1 + (2*right_fit_cr[0]*y_eval*ym_per_pix + right_fit_cr[1])**2)**1.5) / np.absolute(2*right_fit_cr[0])

    # Calculate vehicle center
    #left_lane and right lane bottom in pixels
    left_lane_bottom = (left_fit[0]*y_eval)**2 + left_fit[0]*y_eval + left_fit[2]
    right_lane_bottom = (right_fit[0]*y_eval)**2 + right_fit[0]*y_eval + right_fit[2]

    # Lane center as mid of left and right lane bottom
    lane_center = (left_lane_bottom + right_lane_bottom)/2.
    center_image = 640
    center = (lane_center - center_image)*xm_per_pix #Convert to meters
    position = "left" if center < 0 else "right"
    center = "Vehicle is {:.2f}m {}".format(center, position)

    # Now our radius of curvature is in meters
    return left_curvature, right_curvature, center
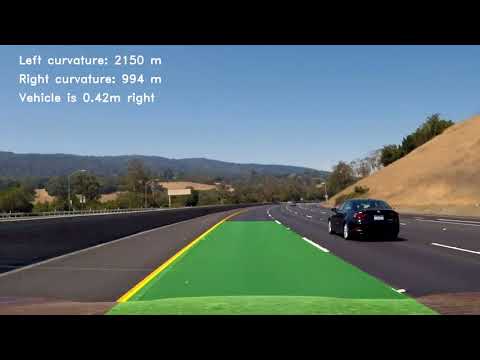
Provide an example image of your result plotted back down onto the road such that the lane area is identified clearly.

Briefly discuss any problems / issues you faced in your implementation of this project. Where will your pipeline likely fail? What could you do to make it more robust?
- Code is not performing well on the challenge video.
- More techniques like smoothing to improve the accuracy.


