datacarpentry / organization-geospatial Goto Github PK
View Code? Open in Web Editor NEWIntroduction to Geospatial Concepts
Home Page: https://www.datacarpentry.org/organization-geospatial/
License: Other
Introduction to Geospatial Concepts
Home Page: https://www.datacarpentry.org/organization-geospatial/
License: Other


I had a question from workshop participants about the example map shown with two of the three types of vectors, asking why the point in the legend is plotted on top of a line.
Might it be preferable to remove the option show.legend = "line" ? I realize that the polygons are then shown in the legend as a square and perhaps it was intentional to have it shown as a line, so the point legend could also just be something to discuss and refer participants to later when they learn mapping with ggplot.
The Contributing Guide, CONTRIBUTING.md, contains two links with URLs that should be updated:
[repo] link reference currently points to a placeholder URL (https://example.com/FIXME) and should be updated to point to the source repository for the lesson (i.e. this GitHub repository).The Contributing Guide is one of the files that is unique to each repository - to allow for individual lesson projects to define their own guidance for contributors - so unfortunately this is not an issue that can be fixed centrally e.g. by updating the template files in the lesson infrastructure. Instead the file must be updated in the individual lesson repositories themselves.
In this episode, this text:
Comments from the pros: Take the time to figure identify a projection that is suited for your project. You don’t have to stick to the ones that are popular.
Should be in a callout box.
For the first exercise in this lesson: "Advantages and Disadvantages", it would be helpful for the instructor to provide a few examples (or allude to them) before asking participants to name them
Episode 1 includes the text:
Vector data structures aim to represent specific features on the Earth’s surface, and then assign attributes to those features. All vector datasets are based around coordinate points - usually paired x,y values in 2D space. There are many possible way to arrange and connect a set of points, so some standards have been developed to keep vector formats interoperable. The most common standard you will encounter is OGC Simple Features.
Simple Features defines 17 types of vector geometry, and the vast majority of data uses just three of these classes - Points, Lines, and Polygons. Points are assembled into more complex structures by straight lines only.
There is then a place to insert an image. Anyone have an image to illustrate this concept?
The lesson infrastructure committee unanimously approved the proposal of using the same set of labels across all our repositories during its last meeting on May 23rd, 2018.
This repository has now been converted to use the standard set of labels.
If this repository used the previous set of recommended labels by Software Carpentry, they have been converted to the new one using the following rules:
| SWC legacy labels | New 'The Carpentries' labels |
|---|---|
| bug | type:bug |
| discussion | type:discussion |
| enhancement | type:enhancement |
| help-wanted | help wanted |
| newcomer-friendly | good first issue |
| template-and-tools | type:template and tools |
| work-in-progress | status:in progress |
The label instructor-training was removed as it is not used in the workflow of certifying new instructors anymore. The label question was left as is when it was in use, and removed otherwise. If your repository used custom labels (and issues were flagged with these labels), they were left as is.
The lesson infrastructure committee hopes the standard set of labels will make it easier for you to manage the issues you receive on the repositories you manage.
The lesson infrastructure committee will evaluate how the labels are being used in the next few months and we will solicit your feedback at this stage. In the meantime, if you have any questions or concerns, please leave a comment on this issue.
-- The Lesson Infrastructure subcommittee
PS: we will close this issue in 30 days if there is no activity.
On https://datacarpentry.org/organization-geospatial/04-geo-landscape/index.html
My comment is that the addition of the software package ENVI by L3Harris is widely used for Remote Sensing and should be included. It is heavily used in the community.
The other comment is very minor but on https://datacarpentry.org/organization-geospatial/03-crs/index.html
It would be helpful to distinguish the difference between a geographic coordinate system and the projected systems. It comes up, especially when dealing with measurements and distance.
Based on the CAC discussion, this repo is intended as a non-coding dependent introduction to geospatial data formats and project organization. This lesson will be taught before any R has been covered, and so must not require the learner to know any R. R code can be used in the lessons to create graphics / maps, but the learner should not have to interact with the R code.
Episode 1: Spatial data formats
Episode 2: Project organization and management
Episode 3: Spatial data landscape
This information is already (at least mostly) in this repo, but needs to be reorganized to fit this episode structure.
Note: although in other Data Carpentry lessons, data cleaning is often part of the initial lesson, it will not be included in this lesson as data structures for geospatial data are complicated and may be intimidating to learners to see at the very beginning of the workshop. Data cleaning should be integrated into the rest of the lessons.
If your Maintainer team has decided not to participate in the June 2019 lesson release, please close this issue.
To have this lesson included in the 18 June 2019 release, please confirm that the following items are true:
When all checkboxes above are completed, this lesson will be added to the 18 June lesson release. Please leave a comment on carpentries/lesson-infrastructure#26 or contact Erin Becker with questions ([email protected]).
In episode 03: Coordinate Reference Systems, I think a link to epsg.io in the "More Resources on CRS" box would be beneficial to learners. I'm in no way affiliated with them, but I use it frequently and find it particularly helpful when working with novice geospatial data users exploring or looking to find an appropriate crs--especially those trying to identify an unknown crs in an older static map or finding one for non-US/EU areas.
For each lesson release, copy this checklist to an issue and check off
during preparation for release
Scheduled Freeze Date: 2018-06-13
Scheduled Release Date: 2018-06-15
Checklist of tasks to complete before release:
For those of us who want to modify and check how things work, can you add info to the readme.md - even just a link - on how to test compilation on our own computers. Some of us are old hands at individual markdown documents, but lack experience in this larger workflow.
Hrm. Oughta be a DC lesson on that....or some pages? (been looking around, but haven't found it)
Here is my intro to projections: https://github.com/MicheleTobias/R-Projections-Workshop It has a non-R intro followed by R exercises. Feel free to use anything that's helpful. - Michele
I'm a member of The Carpentries staff and I'm submitting this issue on behalf of another member of the community. In most cases, I won't be able to follow up or provide more details other than what I'm providing below.
Proofreading this lesson and submitting feedback:
"Vector data structures represent specific geometric features on the Earth's surface, and assign attributes to those features which are displayed as points, lines or polygons."
I realize this is covered in the Introduction to Vector Data lesson in detail, my suggestion was to tie these concepts to clarify the differentiation of raster vs. vector.
"The value of a pixel can be continuous (e.g. elevation) or categorical (e.g. land use) which can be identified as quantitative or qualitative data types."
I've taught upper-division Cartography and GIS and the terns qualitative vs quantitative are worth mentioning since these are terms commonly used by GIS (geospatial) professionals.
The variable {{site.github.repository_url}} in navbar.html should be coming from GitHub's jekyll environment as the link to the underlying repository, but it doesn't seem to be getting filled. So it defaults to links at datacarpentry.org. @fmichonneau Have you seen this before?
During the June Maintainer meeting, we asked for comments and experiences with the migration to R 4.0 so that we could create guidance for maintainers and instructors. We have drafted a short blog post (carpentries/carpentries.org#830) to be released next week (2020-08-03) that describes our recommendations for migration. You can find a preview of the blog post here. Please look over the blog posts and make comments by 2020-07-30 so that we can incoroporate any changes before the post goes live.
To help identify the differences between R 3.6 and R 4.0, I have run this lesson in both versions and posted the results that show the differences in output chunks and entire markdown files.
This lesson doesn't yet have any exercises. We will need to insert exercises about the content at several points (at least once in each episode).
Some suggested places for exercises (not all of these need to be used!):
The Introduction to Spatial Data episode has some bulleted lists of advantages and disadvantages of raster and vector data. These could be converted into a single discussion / exercise where a brief introduction to both data formats is given and then learners are paired and asked to compile a list of advantages and disadvantages of each. There would then be a full group discussion to compile the full list. This would be similar to the first exercise in the Ecology spreadsheets lesson in getting discussion going early in the workshop.
The sentence "Orange Peel Analogy: a datum is your choice of fruit to use in the orange peel analogy. Is the earth an orange, a lemon, a lime, a grapefruit?" could be converted into a short exercise / discussion.
The "Describing Coordinate Reference Systems" section contains information about three different CRS systems and interconversions among them. Could this be followed by an exercise/discussion in which learners identify which CRS would be most useful for different types of maps (e.g. I know that @annefou mentioned specific CRS constraints when working with data for Nordic countries).
Could we add an exercise around metadata? Similar to the exercise here: http://www.datacarpentry.org/spreadsheets-socialsci/01-format-data/#metadata.
In the third episode, the "GUI vs CLI" section could be framed as a discussion/exercise. Learners might be asked to list software that they use that is a GUI or to identify if they have used CLI tools. Then discuss advantages / disadvantages.
Under Which projection should I use of Episode 3: Coordinate Reference Systems
Line 113 references a two broken links:
I'm guessing these should be:
Thanks for this lesson!
In "The Geospatial Landscape" section at https://datacarpentry.org/organization-geospatial/04-geo-landscape/index.html, under Online + Cloud computing list, the link to Boundless Geospatial website is broken. The company doesn't exits anymore since it had been acquired by Earth-imaging company Planet in 2018. The link should be removed.
Thanks for contributing! ❤️
If this contribution is for instructor training, please email the link to this contribution to
[email protected] so we can record your progress. You've completed your contribution
step for instructor checkout by submitting this contribution!
If this issue is about a specific episode within a lesson, please provide its link or filename.
Keep in mind that lesson maintainers are volunteers and it may take them some time to
respond to your contribution. Although not all contributions can be incorporated into the lesson
materials, we appreciate your time and effort to improve the curriculum. If you have any questions
about the lesson maintenance process or would like to volunteer your time as a contribution
reviewer, please contact The Carpentries Team at [email protected].
You may delete these instructions from your comment.
- The Carpentries
Hi, the content of the Coordinate Reference System episode stuck on proj4 and doesn't follow or at least points out at recent developments in PROJ library and consequently updates made to sf and sp libraries.
https://www.r-spatial.org/r/2020/03/17/wkt.html#crs-objects-in-sf
Please see datacarpentry/geospatial-workshop#44
This episode has the following note. I'm adding it here and removing from the episode itself. The question is, should arc-node topology be mentioned at the end of the vector section of this episode or in the raster vector lesson instead?
<worth mentioning arc-node topology yet? probs leave until specific vector lesson>
I'm a member of The Carpentries Core Team and I'm submitting this issue on behalf of another member of the community. In most cases, I won't be able to follow up or provide more details other than what I'm providing below.
This is a small thing, but in the Introduction to Raster Data section, if the learner did not have any experience with the raster data type, it might be clarifying to add a comment during the about section or add to the first key point, that the data represented/stored in each pixel/cell/grid has a single value/attribute of the phenomenon being described. The first image helps to show this, but it might be good to highlight it at this early point in the lesson. This might also help with understanding the composite values in multiband rasters.
Links to be fixed:
Possibly add this to the lesson release checklist #5
This is a minor suggestion about how raster extent is introduced, in https://datacarpentry.org/organization-geospatial/01-intro-raster-data/index.html#extent
The image introduces point, line and polygon examples or R spatial objects as having extents - I wonder if the lesson could avoid introducing vector objects at this point? They will be introduced in the next episode.
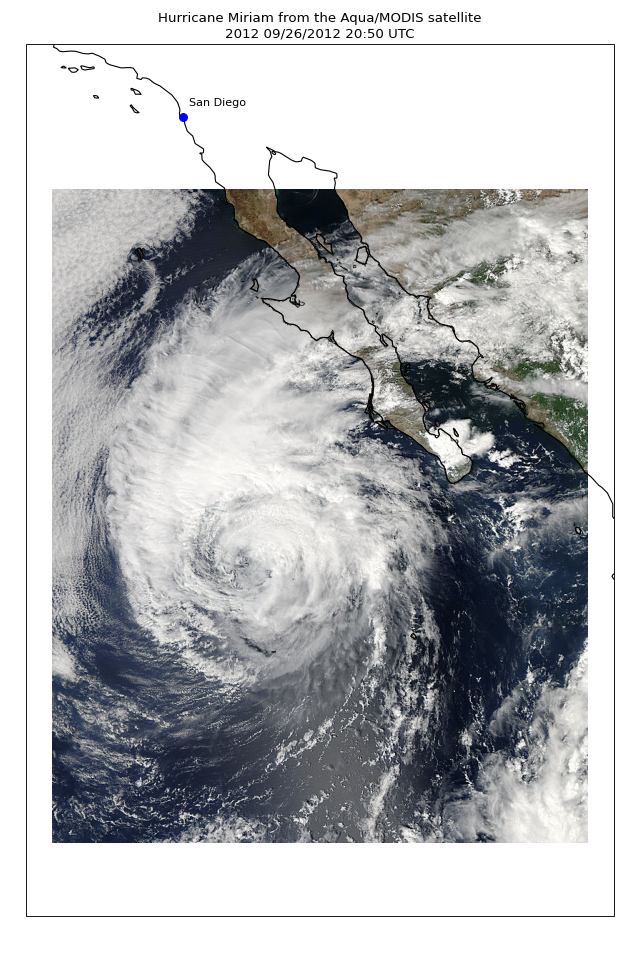
Instead, the example could show the extent of some raster data - perhaps a single satellite image tile, perhaps overlaid on an outline background map to show the geographical context (coastline or admin boundary) - something like this image from https://scitools.org.uk/cartopy/docs/latest/matplotlib/advanced_plotting.html#images
In this episode, there is a "needs more" comment after the "PROJ" header. It's not clear whether that means there should be more information about the PROJ format, or if there should be more formats listed after the PROJ section.
There appear to be some missing new lines in the markdown rendering episode 1. Episodes 2 and 3 appear to be ok. I will make a local copy and fix the formatting for episode 1.
In this episode add an image of peeled orange with globe drawn on from https://github.com/MicheleTobias/R-Projections-Workshop at the end of the "Projection" section.
In this episode, add an image of citrus from https://github.com/MicheleTobias/R-Projections-Workshop at the end of the "Datum" section.
This entire lesson should take about 2-3 hours to teach.
In preparation for the June release, we are checking for broken links in the lessons. Please see below for possible broken links.
  ● Resource: `http://gdal.org/wktproblems.html`
    Message: ‘HTTP status code: 404’
    Found in:
    - /home/francois/git/geospatial-lessons/organization-geospatial/_site/03-crs/index.html
  ● Resource: `http://kartoweb.itc.nl/geometrics/map%20projections/mappro.html`
    Message: ‘HTTP status code: 404’
    Found in:
    - /home/francois/git/geospatial-lessons/organization-geospatial/_site/03-crs/index.html
  ● Resource: `http://www.epsg.org/GuidanceNotes`
    Message: ‘HTTP status code: 404’
    Found in:
    - /home/francois/git/geospatial-lessons/organization-geospatial/_site/03-crs/index.html
  ● Resource: `http://www.manifold.net/`
    Message: ‘HTTP status code: 404’
    Found in:
    - /home/francois/git/geospatial-lessons/organization-geospatial/_site/04-geo-landscape/index.html
  ● Resource: `https://www.colorado.edu/geography/gcraft/notes/mapproj/mapproj_f.html`
    Message: ‘HTTP status code: 404’
    Found in:
    - /home/francois/git/geospatial-lessons/organization-geospatial/_site/03-crs/index.html
@zkamvar
We need to update style for this lesson so that jump lists (anchors for different sections) becomes automatically available for different levels of headings.
Please, consider adding a lesson topic to the repository. To do so you can follow the help about how to add topics to the repository. Check out the topics that the Genomics R intro lesson has gotten to add others that may be relevant to this lesson.
This will help people to know which repositories are lessons and also could be used to automate analysis of the repositories.
The introduction episode along with several files in the code/ folder (which is unused in the lesson) still have library(rgdal), which is now causing the lesson to fail building due to the fact that the {rgdal} package is now retired.
This was opened in the r-raster-vector-geospatial lesson in 2021: datacarpentry/r-raster-vector-geospatial#363 and the @datacarpentry/curriculum-advisors-geospatial had made a recommendation to replace rgdal and rgeos with calls from sf or terra:
Deprecation of the sp, rgeos, and rgdal packages
- The Committee agreed that the references to rgdal and rgeos be removed or replaced with references to the equivalent sf and terra functions as appropriate. This decision is closely paired with the rationale for choosing terra as the replacement for the raster package and aims to avoid code-breaking deprecations coming some time in 2023.
Transition from raster to terra or stars
- The terra package appears to be the most direct replacement for raster as it uses language which is similar to raster and common to other GIS. The Committee recommends that terra be adopted as a replacement to raster. Stars should be presented as an alternative to terra that may be faster in some cases or more appropriate for analyses with longitudinal elements.
Short version: are you are willing to volunteer your lesson for early transition to The Carpentries Workbench
infrastructure?
Longer version below:
As I hope you are already aware, @zkamvar and the rest of the Curriculum Team are preparing to roll out the new lesson infrastructure, The Carpentries Workbench, across all of The Carpentries official lessons in early May 2023. This means that all Data Carpentry, Library Carpentry, and Software Carpentry lesson repositories will be modified to adopt the new infrastructure at the end of this month.
As you might imagine, coordinating a rollout like this involves a large amount of time and effort, and one thing that will really help us to keep to the schedule and avoid disruption for the community is to be able to prepare some lessons for
transition before the 1st May deadline.
With this in mind, I invite you to volunteer to schedule an early transition for theis lesson repository. If you expect to have time to adopt the Workbench version of the lesson repository in the next couple of weeks, please reply to let me know. As lesson Maintainers, these are the things you will need to be prepared to do for the transition:
If you are willing and able to help us ensure a smooth rollout of the Workbench, please reply to let me know that you are happy to volunteer your lesson for early transition. If there is a specific date you would like the transition to take place (or that we should avoid), please also mention that.
This episode includes the following note:
nb shld talk to Lovelace et al about borrowing some images from - https://bookdown.org/robinlovelace/geocompr/spatial-class.html#raster-data, for both r and v
Adding an issue for this and deleting from the episode itself.
The learning objectives for the Introduction to Geospatial Concepts, Coordinate Reference System lesson are a bit limited and could be expanded. Likewise, the wording of the first objective (as it is currently written) may be confusing for those with limited GIS experience as the rest of the lesson makes no reference to the word "scheme". A few suggestions for revising the learning objectives for the CRS lesson are as follows:
-Identify and describe a coordinate reference system (CRS)
-Recognize and understand 3 key components of a CRS
-Name at least 1 common system for storing and transmitting CRS information
-Interpret a PROJ4 coordinate reference system description
Since all of the coding lessons in this workshop are currently based on R, I would recommend removing the section of the third episode that discusses Python packages and just focus on R.
Inclusion of Python risks cognitive load issues.
@datacarpentry/organization-geospatial-maintainers
As I hope you are already aware, we are rolling out the new lesson infrastructure, The Carpentries Workbench, across all of The Carpentries official lessons in early May 2023. This means that all Data Carpentry, Library Carpentry, and Software Carpentry lesson repositories will be modified to adopt the new infrastructure in the coming days.
You can follow the transition of this lesson repository at carpentries/lesson-transition#26.
The transition has already taken place for several lessons, and so far the process has been running quite smoothly. You should see the transition take place with minimal disruption, but there are a few things that it is important for Maintainers to be aware of.
Here is what you can expect to happen next:
I will reply here before and after the transition has taken place. If you have any questions in the meantime, please reach out to the Curriculum Team by tagging us here, e.g. @datacarpentry/core-team-curriculum.
If you would like to read more about the new lesson infrastructure and the modified repository structure you can expect post-transition, I recommend the Infrastructure episode of the Maintainer Onboarding curriculum and the Workbench Transition Guide, which includes a side-by-side comparison of various elements of the old and new infrastructures.
The first episode includes this sentence:
The most common standard you will encounter is OGC Simple Features.
It would be useful to add a link to more information about OGC Simple Features.
A declarative, efficient, and flexible JavaScript library for building user interfaces.
🖖 Vue.js is a progressive, incrementally-adoptable JavaScript framework for building UI on the web.
TypeScript is a superset of JavaScript that compiles to clean JavaScript output.
An Open Source Machine Learning Framework for Everyone
The Web framework for perfectionists with deadlines.
A PHP framework for web artisans
Bring data to life with SVG, Canvas and HTML. 📊📈🎉
JavaScript (JS) is a lightweight interpreted programming language with first-class functions.
Some thing interesting about web. New door for the world.
A server is a program made to process requests and deliver data to clients.
Machine learning is a way of modeling and interpreting data that allows a piece of software to respond intelligently.
Some thing interesting about visualization, use data art
Some thing interesting about game, make everyone happy.
We are working to build community through open source technology. NB: members must have two-factor auth.
Open source projects and samples from Microsoft.
Google ❤️ Open Source for everyone.
Alibaba Open Source for everyone
Data-Driven Documents codes.
China tencent open source team.