Giter Club home page Giter Club logo

d3-scale's Introduction

d3-scale

Scales map a dimension of abstract data to a visual representation. Although most often used for encoding data as position, say to map time and temperature to a horizontal and vertical position in a scatterplot, scales can represent virtually any visual encoding, such as color, stroke width, or symbol size. Scales can also be used with virtually any type of data, such as named categorical data or discrete data that requires sensible breaks.

Resources

d3-scale's People

Contributors

billyjanitsch avatar curran avatar cx0der avatar danielgavrilov avatar danielyule avatar devgru avatar domoritz avatar existentialism avatar fil avatar fracturedshader avatar ilijapuaca avatar jasondavies avatar jeroenbe avatar jheer avatar lsbardel avatar mbostock avatar michielmetcake avatar mikez avatar nikolas avatar oluckyman avatar raja-s avatar severo avatar third774 avatar

Stargazers

 avatar  avatar  avatar  avatar  avatar  avatar  avatar  avatar  avatar  avatar  avatar  avatar  avatar  avatar  avatar  avatar  avatar  avatar  avatar  avatar  avatar  avatar  avatar  avatar  avatar  avatar  avatar  avatar  avatar  avatar  avatar  avatar  avatar  avatar  avatar  avatar  avatar  avatar  avatar  avatar  avatar  avatar  avatar  avatar  avatar  avatar  avatar  avatar  avatar  avatar  avatar  avatar  avatar  avatar  avatar  avatar  avatar  avatar  avatar  avatar  avatar  avatar  avatar  avatar  avatar  avatar  avatar  avatar  avatar  avatar  avatar  avatar  avatar  avatar  avatar  avatar  avatar  avatar  avatar  avatar  avatar  avatar  avatar  avatar  avatar  avatar  avatar  avatar  avatar  avatar  avatar  avatar  avatar  avatar  avatar  avatar  avatar  avatar  avatar  avatar

Watchers

 avatar  avatar  avatar  avatar  avatar  avatar  avatar  avatar  avatar  avatar  avatar  avatar  avatar  avatar  avatar  avatar  avatar  avatar  avatar  avatar  avatar  avatar  avatar  avatar  avatar  avatar  avatar  avatar  avatar  avatar  avatar  avatar  avatar  avatar  avatar  avatar  avatar  avatar  avatar  avatar  avatar  avatar

d3-scale's Issues

Log scales may generate no ticks for small domains.

If the difference between the smallest and largest values in the domain is small relative to their absolute value, then log.ticks can return the empty array. For example:

d3_scale.log().domain([42, 43]).ticks(); // []

In this case, it’d probably be best for the log scale to fallback to the behavior of a standard linear scale. Although, it’s probably appropriate to continue to use an exponential tick format?

Linear nice(n) domain does not always match ticks(n).

A comment by @moshevds from d3/d3#2580:

Compare this sentence from https://github.com/mbostock/d3/wiki/Quantitative-Scales#linear_nice:

The optional tick count argument allows greater control over the step size used to extend the bounds, guaranteeing that the returned ticks will exactly cover the domain.

With this result from the current implementation:

var scale = d3.scale.linear().domain([-0.1, 51.1]).nice(8);
scale.domain(); // => [ -5, 55 ]
scale.ticks(8); // => [ 0, 10, 20, 30, 40, 50 ]

In most cases I do get the result I expected, for example:

var scale = d3.scale.linear().domain([6.3, 74.2]).nice(8);
scale.domain(); // => [ 0, 80 ]
scale.ticks(8); // => [ 0, 10, 20, 30, 40, 50, 60, 70, 80 ]

I looked at d3_scale_linearTickRange. The problem apparently stems from the step-size heuristic and its dependency on the values that nice is changing. I don't feel comfortable proposing a completely different heuristic, perhaps you would consider a patch to calculate the heuristic twice?

For comparison:

var scale = d3.scale.linear().domain([-0.1, 51.1]).nice(8).nice(8);
scale.domain(); // => [ -10, 60 ]
scale.ticks(8); // => [ -10, 0, 10, 20, 30, 40, 50, 60 ]

IP Addresses (and bignums)

An IP address scale would be nice to include in an extended scales plugin, but this repo seems like a good place to consider how to handle them.

For IPv4, there's a straightforward conversion to/from integers. These integers can then be put on a linear scale. See: http://bl.ocks.org/syntagmatic/1ced118a51b49dadd4ea

screen shot 2016-02-02 at 2 27 37 pm

A better solution might be to use a library that converts IP addresses to objects, does data validation, etc. Then d3.scaleIPv4 could behave like d3.scaleTime.

Here's one such library: https://github.com/beaugunderson/ip-address

But since IPv6 addresses are 128 bits, they can't be represented by integers. The ip-address library uses a BigInteger format to resolve this. But it's not obvious to me how I would construct a d3 scale with BigIntegers.

A related problem is representing bignums in general, say those produced by https://github.com/MikeMcl/bignumber.js/

Probable bug

At this line the variable sequential is used but never defined.

You should probably change the definition of the function as follows:

export default function sequential(interpolate) {
  //                    ^^^^^^^^^^
}

I actually didn’t tested nor experienced the bug so please feel free to close this issue if you think is silly!

Cheers

Cannot chain scaleTime functions when using in Node environment.

From the timeScale documentation it looks like you should be able to chain the domain() and range() calls, but when using it in a Node environment, you can only call one or the other.

When chaining the domain() and range() calls the following error is thrown:

TypeError: scale.scaleTime(...).domain(...).range is not a function

The code snippet I'm working with:

const scale = require('d3-scale');

// The following code throws the error
// TypeError: scale.scaleTime(...).domain(...).range is not a function
let x = scale.scaleTime().domain().range();

// But the following code works
let x = scale.scaleTime();
x.domain();
x.range();

I assume this isn't intended? Or am I missing something here?

sequential.interpolate?

Should you be able to access or change a sequential scale’s interpolator after construction?

d3.interpolateCubehelixDefault doesn't match documentation

The docs suggest that you can pass it a t value directly and get back a color (from README):

d3.interpolateCubehelixDefault(t)

Given a number t in the range [0,1], returns the corresponding color from Green’s default Cubehelix represented as an RGB string.

Instead it returns a function that when called produces the desired behaviour:
image

The other interpolateFoo functions work as expected.

Using d3-scale 0.9.1.

Extracting nice time intervals?

In the case of aggregation over temporal bins, it would be great to have some way of extracting the interval from time.nice([count]). Given an approximate number of bins, I'd like to determine which time interval would yield closest to that number of bins. This is for creating a histogram with time as the X axis.

Perhaps there is already a way to do this, but I'm not seeing it. It's clear that the interval is computed internally (it looks like in tickInterval), but I don't see any way of extracting it through the API exposed.

Also looking at datalib's dl.bins.date, which seems to provide something similar.

Time-of-day scale?

Hello,

Firstly, thank you for this great work on the new D3 modules.

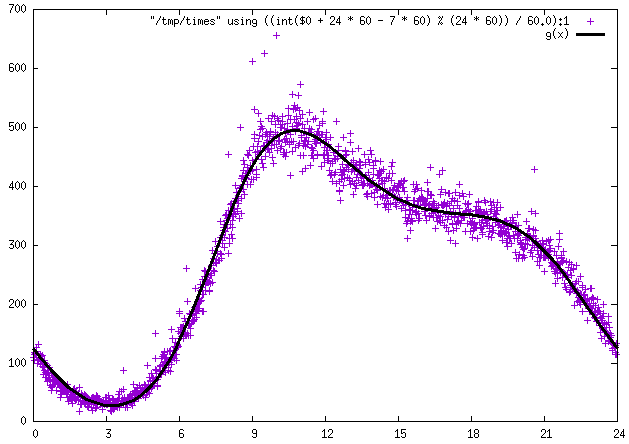
I'm wondering, would it be possible to create a time scale that represents time-of-day, rather than absolute time? Here's one example visualization that uses such a scale (conceptually at least) to show tweet density by time-of-day (by @ericfischer):

Here's the data behind this visualization.

In this visualization, it looks like a linear scale and corresponding axis represents time-of-day based on hours. This seems like a reasonable approach, just coerce the values to numbers. Another approach might be to parse the values into Date objects with an arbitrary year, month, and day filled in, and format the axis ticks to only show the time of day. I'm wondering if you have had any other ideas for implementing such scales and axes for [interval]-of-[interval] in a more general way.

Similarly, it seems like day-of-week and month-of-year data need to be represented using ordinal scales on strings ("Monday", "Tuesday", etc.), but this seems like another place where the d3-time and d3-scale modules could somehow handle these cases with a more explicit representation of time intervals. This leads to a kind of combinatorial explosion with all the possibilities of nested intervals, of which these are several:

  • minute-of-hour
  • minute-of-day
  • hour-of-day
  • day-of-week
  • day-of-month
  • day-of-year
  • month-of-year

Here's another related visualization case that shows hour-of-day vs. day-of-week - Day / Hour Heatmap.

Perhaps this is beyond the scope of your goals, but I'd be curious what you think about these cases.

Rename quantitative to continuous?

Seems like a more precise name given that threshold, quantize and quantile are also quantitative (but are not continuous).

Also, identity should be considered a continuous scale, even though the implementation is optimized.

Easier-to-use rainbow scales?

Perhaps split the “rainbow” scale into three scales: a “warm” scale, a “cool” scale, and a “rainbow” scale. All use the domain of [0, 1], so the last one needs a special interpolator that rotates hue and adjusts lightness to behave like warm + reflect(cool). Also, warm and cool should both go from darker (0) to lighter (1) to match the other sequential color scales.

Expose d3.scaleSequential?

It would be nice for implementing custom scales, e.g., the (highly not recommended!) angry rainbow:

var rainbow = d3.scaleSequential(function(t) {
  return d3.hsl(t * 360, 1, 0.5) + "";
});

Instead, you currently must do something like this if you want a scale:

var rainbow = d3.scaleLinear().interpolate(function() {
  return function(t) {
    return d3.hsl(t * 360, 1, 0.5) + "";
  };
});

But note that this doesn’t really work with a domain of more than two values, and ignores the range. So restricting this to a sequential scale seems more appropriate.

Broken Link for #Linear in README.md

There are links pointing to #linear section throughout README.md.
However, the linear scale is explained as a part of #continuous-scales section without its own separate section. Thus all the #linear links are broken.

Filter power-of-ten ticks?

Related d3/d3#1971. If you have a really big domain, seems like we might want to drop all intermediate ticks and start filtering power-of-ten ticks according to the same logic as a linear scale.

JavaScript numbers get ceil'd

I'm trying to create a scaled X-Axis with some large values in the domain:

var xscale = d3.scale.linear()
                      .domain(d3.extent(my_data, function(d) { 
                                                           console.log("my_val " + d.my_val); 
                                                           return d.my_val })
                                    )
                     .range([0, width]);

The above code produces the following output, which is correct:

my_val 34200007505 
my_val 34200007507
my_val 34200007601
my_val 34200007875
my_val 34200008702

Here is the code that I use to render a chart:

 var fmtVal = function(d) {
                        console.log("!!! fmt_val ===> " + d);
 }
var xaxis = d3.svg.axis().scale(xscale).orient("bottom").ticks(10).tickFormat(fmtVal);
var focus = svg.append ("g")
                        .attr("class", "focus")
                        .attr("transform", "translate(" + margin.left + "," + margin.top + ")");
focus.append("g")
                .attr("class", "x axis")
                .attr("transform", "translate(0," + height + ")")
                .call(xaxis);

The output from my logging statements produces:

!!! fmt_val ===> 34200100000
!!! fmt_val ===> 34200200000
!!! fmt_val ===> 34200300000
!!! fmt_val ===> 34200400000

As you can see, 34200007505 is rounded up to 34200100000. How do I prevent this from occurring?

Should all scale constructors accept a range?

We added it for d3.scaleOrdinal and, effectively, for d3.scaleSequential. What about d3.scaleLinear etc.?

  • d3.scaleLinear
  • d3.scalePow
  • d3.scaleSqrt
  • d3.scaleIdentity
  • d3.scaleTime
  • d3.scaleUtc
  • d3.scaleSequential
  • d3.scaleQuantize
  • d3.scaleQuantile
  • d3.scaleThreshold
  • d3.scaleOrdinal
  • d3.scaleBand
  • d3.scalePoint

Some devDependencies should be dependencies?

I noticed that d3-interpolate and d3-format are listed under devDependencies rather than dependencies in package.json, however they are hard dependencies (as in, the Rollup build breaks if they are not installed). Perhaps these should be promoted to dependencies?

Here are some notes from my experience trying to use only the ticks functionality of d3-scale:

When importing linear from d3-scale, I get the following error when running Rollup:

Could not find package d3-interpolate (required by /Users/curran/repos/data-reduction/node_modules/d3-scale/src/linear.js)

Also, after I npm install d3-interpolate, I get another error:

Could not find package d3-color (required by /Users/curran/repos/data-reduction/node_modules/d3-interpolate/src/interpolators.js)

Now I need to install d3-color to use d3-scale, however I just want to use the ticks functionality from d3-scale. This feels like it should not be necessary.

After installing d3-color, I get another error:

Could not find package d3-format (required by /Users/curran/repos/data-reduction/node_modules/d3-scale/src/tickFormat.js)

After installing d3-format, the build works. In the end, it is necessary to install d3-interpolate, d3-color and d3-format in order to use the tick generation functionality from d3-scale.

include standalone version in build folder

It's great to see that d3 is so modular nowadays, but for some of us using a standalone bundle is often the best choice.
It would be very convenient if a standalone bundle would be part of the npm package. Maybe you can just put it to the build folder too?

log scale returns unwanted ticks

Hi there, I just made the switch from d3 to d3 modules, and I'm seeing some unexpected behavior with the log scale ticks.

expected behavior:
domain = [1, 5] tickCount = 5 -> ticks = [1, 2, 3, 4, 5]

actual behavior:
domain = [1, 5] tickCount = 5 -> ticks = [1, 2, 3, 4, 5, 6, 7, 8, 9]

I looked through the source code briefly, and I think this line might have something to do with the bug I'm seeing
https://github.com/d3/d3-scale/blob/master/src/log.js#L85

Thanks!

Helper for quantizing sequential scales?

This is somewhat tedious:

var color = d3.scaleQuantize()
    .domain([0, width])
    .range(d3.range(0, 10).map(d3.scaleRdPu().domain([0, 9])));

What if you could just sequential.quantize(n), which then returned a quantize scale with n values in its range?

var color = d3.scaleRdPu()
    .quantize(10)
    .domain([0, width]);

Somewhat roundabout, but you could also use this to construct a quantile scale with n quantiles:

var color = d3.scaleQuantile()
    .domain(values)
    .range(d3.scaleRdPu().quantize(10).range());

I suppose there could be a sequential.quantile(n) helper, too, then?

var color = d3.scaleRdPu()
    .quantile(10)
    .domain(values);

The only tricky thing is that you must set the domain after sequential.quantile, whereas with sequential.quantize it doesn’t matter whether you set it before or after.

Simplify the naming?

To create a linear scale I run something like -

const x = d3_scale.scaleLinear()

However, I had assumed I would instead do -

const x = d3_scale.linear()

It's my first time playing with the new modules and I know it's easy to go blind to these things, so thought I'd raise the issue. It's obviously not a big deal but thought it might be useful feedback.

sequential.quantize(count)?

It might be nice to have an easy way of taking a sequential color scale (e.g., viridis) and quickly making a quantize scale from it. On the other hand, it’s pretty easy to compute the quantized colors by hand:

var color = d3_scale.quantize()
    .domain([0, width])
    .range(d3_array.range(8).map(d3_scale.viridis().domain([0, 7])));

This results in:

screen shot 2015-12-18 at 9 34 11 pm

Also, you might want a quantile or threshold scale instead of a quantize scale. So maybe sequential.quantize(count) would return a sample of range values, rather than a quantize scale? Then you could say:

var color = d3_scale.quantize()
    .domain([0, width])
    .range(d3_scale.viridis().quantize(8));

Direct Linking

Is this a stupid question, I'm not sure.

But is the thinking that these modules will be available to directly include in an html document like <script src="./js/d3-scales.js"></script>? Or will you need to do some kind of npm + browserify workflow?

I'm trying to think about this for beginners or people not familiar with package managers and specifically Node. Is the idea that these kinds of people will just stick with the full d3 suite, and that the modules are intended for more advanced people?

@arnicas, I thought I'd ask this question over here instead of in this processing/p5.js#730 discussion.

Don’t assume ordinal / sequential?

From d3/d3-scale-chromatic#2:

  • I might want to use a categorical color scheme with a different type of scale, such as a threshold scale. (Somewhat unlikely, though, as thresholds are typically ordinal.) Or I might want to use a categorical color scheme for some other purpose; it’s not clear we should strictly assume d3.scaleOrdinal, although it is trivial to extract the range from an ordinal scale.
  • I might want to use a diverging or sequential color scheme with a different type of scale, say if there is a log- or pow-transformed sequential scale in the future (#61). I might also just want direct access to the scale’s underlying interpolator for some reason.

Transforms on quantized or sequential scales?

There’s no equivalent to d3.scaleLog or d3.scalePow for a quantize or sequential scale, but sometimes we might still want to apply such a transform on the data as part of the scale.

  • d3.scaleSequentialSqrt
  • d3.scaleSequentialPow
  • d3.scaleSequentialLog
  • d3.scaleSequentialQuantile
  • d3.scaleQuantizeSqrt
  • d3.scaleQuantizePow
  • d3.scaleQuantizeLog

Pass a custom interval to time.ticks?

Unlike the 3.x time scale, the new time scale.ticks method doesn’t accept a custom time interval. It’d be nice to allow a custom time interval to be passed in. For example, if we want to show every three days regardless of month, we might say:

var s = scale.time();
s.ticks(day.filter(function(d) { return day.count(0, d) % 3 === 0; }));

Although, not sure interval.filter is the best API for this.

linear.interpolate(factory[, arguments…])

It’d be nice if you could bind optional arguments to the interpolator factory, just like you can with line.curve in d3-shape. For example, then instead of:

var x1 = d3_scale.linear()
    .interpolate(d3_interpolate.cubehelixLong)
    .range([d3_color.cubehelix(300, 0.5, 0.0), d3_color.cubehelix(-240, 0.5, 1.0)]);

var x2 = d3_scale.linear()
    .interpolate(d3_interpolate.cubehelixGammaLong(1.5))
    .range([d3_color.cubehelix(300, 0.5, 0.0), d3_color.cubehelix(-240, 0.5, 1.0)]);

You could say:

var x1 = d3_scale.linear()
    .interpolate(d3_interpolate.cubehelixLong)
    .range([d3_color.cubehelix(300, 0.5, 0.0), d3_color.cubehelix(-240, 0.5, 1.0)]);

var x2 = d3_scale.linear()
    .interpolate(d3_interpolate.cubehelixLong, 1.5)
    .range([d3_color.cubehelix(300, 0.5, 0.0), d3_color.cubehelix(-240, 0.5, 1.0)]);

Presumably this would mean a d3_interpolate.bind method, and changing the gamma to be an optional third argument to d3_interpolate.cubehelixLong.

Quantitative scales may be inexact due to rounding error.

Example from d3/d3#2108:

d3.scale.log().domain([10, 1000]).range([0, 1]).invert(1) // 999.999999999999
d3.scale.sqrt().domain([1, 20]).invert(1) // 20.000000000000004

Example correct implementation:

function log_scale_invert(value, domain, range) {
  var l = (value - range[0]) / (range[1] - range[0]);
  var sign = domain[0] * domain[1] <= 0 ? NaN : domain[0] > 0 ? 1 : -1;
  return sign * Math.pow(sign * domain[1], l) * Math.pow(sign * domain[0], 1 - l);
}

log_scale_invert(1, [10, 1000], [0, 1]); // 1000

The downside, of course, is that to fix this the log and pow scales likely can’t be backed by linear scales—they need their own implementation to store the domain exactly.

Recommend Projects

  • React photo React

    A declarative, efficient, and flexible JavaScript library for building user interfaces.

  • Vue.js photo Vue.js

    🖖 Vue.js is a progressive, incrementally-adoptable JavaScript framework for building UI on the web.

  • Typescript photo Typescript

    TypeScript is a superset of JavaScript that compiles to clean JavaScript output.

  • TensorFlow photo TensorFlow

    An Open Source Machine Learning Framework for Everyone

  • Django photo Django

    The Web framework for perfectionists with deadlines.

  • D3 photo D3

    Bring data to life with SVG, Canvas and HTML. 📊📈🎉

Recommend Topics

  • javascript

    JavaScript (JS) is a lightweight interpreted programming language with first-class functions.

  • web

    Some thing interesting about web. New door for the world.

  • server

    A server is a program made to process requests and deliver data to clients.

  • Machine learning

    Machine learning is a way of modeling and interpreting data that allows a piece of software to respond intelligently.

  • Game

    Some thing interesting about game, make everyone happy.

Recommend Org

  • Facebook photo Facebook

    We are working to build community through open source technology. NB: members must have two-factor auth.

  • Microsoft photo Microsoft

    Open source projects and samples from Microsoft.

  • Google photo Google

    Google ❤️ Open Source for everyone.

  • D3 photo D3

    Data-Driven Documents codes.