Giter Club home page Giter Club logo

d3-sankey's Introduction

d3-sankey

Sankey diagrams visualize the directed flow between nodes in an acyclic network. For example, this diagram shows a possible scenario of UK energy production and consumption in 2050:

Sankey diagram

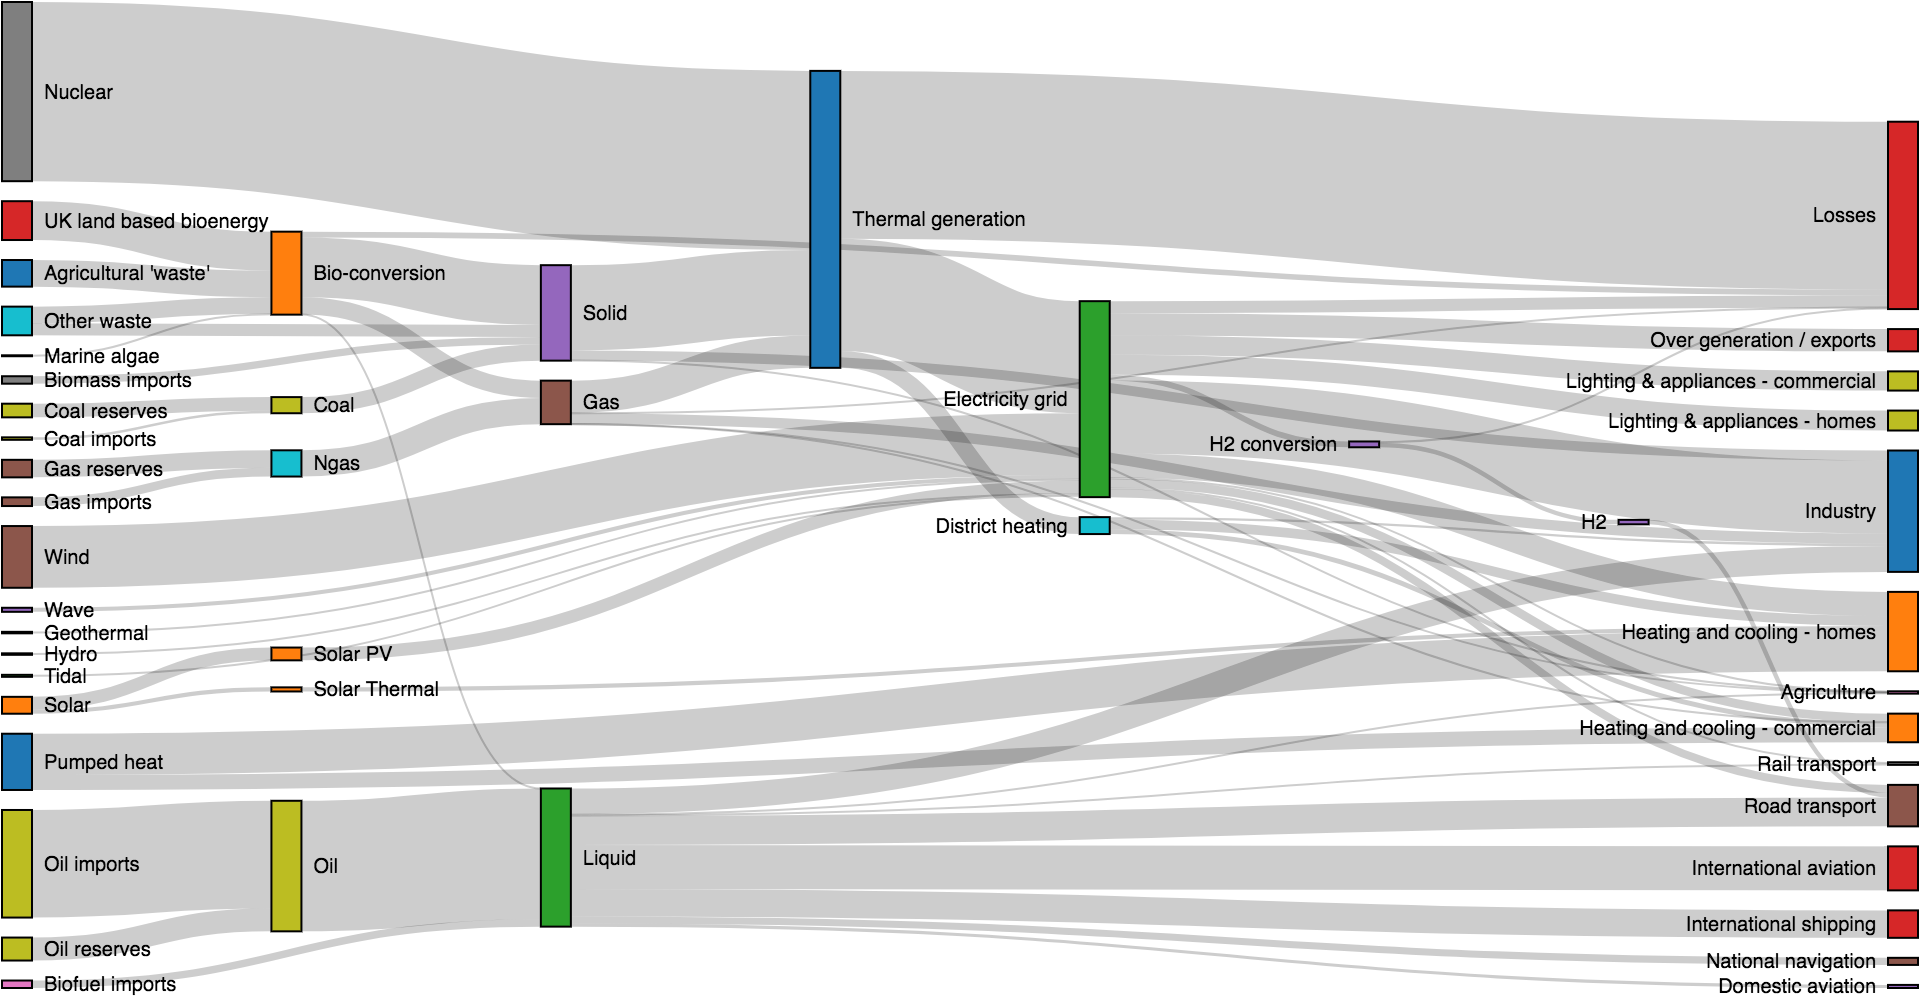
Source: Department of Energy & Climate Change, Tom Counsell.

For an interactive editor, see Flow-o-Matic.

Installing

If you use NPM, npm install d3-sankey. Otherwise, download the latest release. You can also load directly from unpkg.com. AMD, CommonJS, and vanilla environments are supported. In vanilla, a d3 global is exported:

<script src="https://unpkg.com/d3-array@1"></script>
<script src="https://unpkg.com/d3-collection@1"></script>
<script src="https://unpkg.com/d3-path@1"></script>
<script src="https://unpkg.com/d3-shape@1"></script>
<script src="https://unpkg.com/d3-sankey@0"></script>
<script>

var sankey = d3.sankey();

</script>

API Reference

# d3.sankey() <>

Constructs a new Sankey generator with the default settings.

# sankey(arguments…) <>

Computes the node and link positions for the given arguments, returning a graph representing the Sankey layout. The returned graph has the following properties:

  • graph.nodes - the array of nodes
  • graph.links - the array of links

# sankey.update(graph) <>

Recomputes the specified graph’s links’ positions, updating the following properties of each link:

  • link.y0 - the link’s vertical starting position (at source node)
  • link.y1 - the link’s vertical end position (at target node)

This method is intended to be called after computing the initial Sankey layout, for example when the diagram is repositioned interactively.

# sankey.nodes([nodes]) <>

If nodes is specified, sets the Sankey generator’s nodes accessor to the specified function or array and returns this Sankey generator. If nodes is not specified, returns the current nodes accessor, which defaults to:

function nodes(graph) {
  return graph.nodes;
}

If nodes is specified as a function, the function is invoked when the Sankey layout is generated, being passed any arguments passed to the Sankey generator. This function must return an array of nodes. If nodes is not a function, it must be a constant array of nodes.

Each node must be an object. The following properties are assigned by the Sankey generator:

  • node.sourceLinks - the array of outgoing links which have this node as their source
  • node.targetLinks - the array of incoming links which have this node as their target
  • node.value - the node’s value; this is the sum of link.value for the node’s incoming links, or node.fixedValue if defined
  • node.index - the node’s zero-based index within the array of nodes
  • node.depth - the node’s zero-based graph depth, derived from the graph topology
  • node.height - the node’s zero-based graph height, derived from the graph topology
  • node.layer - the node’s zero-based column index, corresponding to its horizontal position
  • node.x0 - the node’s minimum horizontal position, derived from node.depth
  • node.x1 - the node’s maximum horizontal position (node.x0 + sankey.nodeWidth)
  • node.y0 - the node’s minimum vertical position
  • node.y1 - the node’s maximum vertical position (node.y1 - node.y0 is proportional to node.value)

See also sankey.links.

# sankey.links([links]) <>

If links is specified, sets the Sankey generator’s links accessor to the specified function or array and returns this Sankey generator. If links is not specified, returns the current links accessor, which defaults to:

function links(graph) {
  return graph.links;
}

If links is specified as a function, the function is invoked when the Sankey layout is generated, being passed any arguments passed to the Sankey generator. This function must return an array of links. If links is not a function, it must be a constant array of links.

Each link must be an object with the following properties:

  • link.source - the link’s source node
  • link.target - the link’s target node
  • link.value - the link’s numeric value

For convenience, a link’s source and target may be initialized using numeric or string identifiers rather than object references; see sankey.nodeId. The following properties are assigned to each link by the Sankey generator:

  • link.y0 - the link’s vertical starting position (at source node)
  • link.y1 - the link’s vertical end position (at target node)
  • link.width - the link’s width (proportional to link.value)
  • link.index - the zero-based index of link within the array of links

# sankey.linkSort([sort]) <>

If sort is specified, sets the link sort method and returns this Sankey generator. If sort is not specified, returns the current link sort method, which defaults to undefined, indicating that vertical order of links within each node will be determined automatically by the layout. If sort is null, the order is fixed by the input. Otherwise, the specified sort function determines the order; the function is passed two links, and must return a value less than 0 if the first link should be above the second, and a value greater than 0 if the second link should be above the first, or 0 if the order is not specified.

# sankey.nodeId([id]) <>

If id is specified, sets the node id accessor to the specified function and returns this Sankey generator. If id is not specified, returns the current node id accessor, which defaults to the numeric node.index:

function id(d) {
  return d.index;
}

The default id accessor allows each link’s source and target to be specified as a zero-based index into the nodes array. For example:

var nodes = [
  {"id": "Alice"},
  {"id": "Bob"},
  {"id": "Carol"}
];

var links = [
  {"source": 0, "target": 1}, // Alice → Bob
  {"source": 1, "target": 2} // Bob → Carol
];

Now consider a different id accessor that returns a string:

function id(d) {
  return d.id;
}

With this accessor, you can use named sources and targets:

var nodes = [
  {"id": "Alice"},
  {"id": "Bob"},
  {"id": "Carol"}
];

var links = [
  {"source": "Alice", "target": "Bob"},
  {"source": "Bob", "target": "Carol"}
];

This is particularly useful when representing graphs in JSON, as JSON does not allow references. See this example.

# sankey.nodeAlign([align]) <>

If align is specified, sets the node alignment method to the specified function and returns this Sankey generator. If align is not specified, returns the current node alignment method, which defaults to d3.sankeyJustify. The specified function is evaluated for each input node in order, being passed the current node and the total depth n of the graph (one plus the maximum node.depth), and must return an integer between 0 and n - 1 that indicates the desired horizontal position of the node in the generated Sankey diagram.

# sankey.nodeSort([sort]) <>

If sort is specified, sets the node sort method and returns this Sankey generator. If sort is not specified, returns the current node sort method, which defaults to undefined, indicating that vertical order of nodes within each column will be determined automatically by the layout. If sort is null, the order is fixed by the input. Otherwise, the specified sort function determines the order; the function is passed two nodes, and must return a value less than 0 if the first node should be above the second, and a value greater than 0 if the second node should be above the first, or 0 if the order is not specified.

# sankey.nodeWidth([width]) <>

If width is specified, sets the node width to the specified number and returns this Sankey generator. If width is not specified, returns the current node width, which defaults to 24.

# sankey.nodePadding([padding]) <>

If padding is specified, sets the vertical separation between nodes at each column to the specified number and returns this Sankey generator. If padding is not specified, returns the current node padding, which defaults to 8.

# sankey.extent([extent]) <>

If extent is specified, sets the extent of the Sankey layout to the specified bounds and returns the layout. The extent bounds are specified as an array [[x0, y0], [x1, y1]], where x0 is the left side of the extent, y0 is the top, x1 is the right and y1 is the bottom. If extent is not specified, returns the current extent which defaults to [[0, 0], [1, 1]].

# sankey.size([size]) <>

An alias for sankey.extent where the minimum x and y of the extent are ⟨0,0⟩. Equivalent to:

sankey.extent([[0, 0], size]);

# sankey.iterations([iterations]) <>

If iterations is specified, sets the number of relaxation iterations when generating the layout and returns this Sankey generator. If iterations is not specified, returns the current number of relaxation iterations, which defaults to 6.

Alignments

See sankey.nodeAlign.

# d3.sankeyLeft(node, n) <>

left

Returns node.depth.

# d3.sankeyRight(node, n) <>

right

Returns n - 1 - node.height.

# d3.sankeyCenter(node, n) <>

center

Like d3.sankeyLeft, except that nodes without any incoming links are moved as right as possible.

# d3.sankeyJustify(node, n) <>

justify

Like d3.sankeyLeft, except that nodes without any outgoing links are moved to the far right.

Links

# d3.sankeyLinkHorizontal() <>

Returns a horizontal link shape suitable for a Sankey diagram. The source accessor is defined as:

function source(d) {
  return [d.source.x1, d.y0];
}

The target accessor is defined as:

function target(d) {
  return [d.target.x0, d.y1];
}

For example, to render the links of a Sankey diagram in SVG, you might say:

svg.append("g")
    .attr("fill", "none")
    .attr("stroke", "#000")
    .attr("stroke-opacity", 0.2)
  .selectAll("path")
  .data(graph.links)
  .join("path")
    .attr("d", d3.sankeyLinkHorizontal())
    .attr("stroke-width", function(d) { return d.width; });

d3-sankey's People

Contributors

1wheel avatar geekplux avatar jasondavies avatar jfsiii avatar mbostock avatar monfera avatar neilrackett avatar riccardoscalco avatar sillitoe avatar syntagmatic avatar tomwanzek avatar

Stargazers

 avatar  avatar  avatar  avatar  avatar  avatar  avatar  avatar  avatar  avatar  avatar  avatar  avatar  avatar  avatar  avatar  avatar  avatar  avatar  avatar  avatar  avatar  avatar  avatar  avatar  avatar  avatar  avatar  avatar  avatar  avatar  avatar  avatar  avatar  avatar  avatar  avatar  avatar  avatar  avatar  avatar  avatar  avatar  avatar  avatar  avatar  avatar  avatar  avatar  avatar  avatar  avatar  avatar  avatar  avatar  avatar  avatar  avatar  avatar  avatar  avatar  avatar  avatar  avatar  avatar  avatar  avatar  avatar  avatar  avatar  avatar  avatar  avatar  avatar  avatar  avatar  avatar  avatar  avatar  avatar  avatar  avatar  avatar  avatar  avatar  avatar  avatar  avatar  avatar  avatar  avatar  avatar  avatar  avatar  avatar  avatar  avatar  avatar  avatar  avatar

Watchers

 avatar  avatar  avatar  avatar  avatar  avatar  avatar  avatar  avatar  avatar  avatar  avatar  avatar  avatar  avatar  avatar  avatar  avatar  avatar  avatar  avatar  avatar  avatar  avatar  avatar  avatar  avatar  avatar  avatar  avatar

d3-sankey's Issues

Up to date example/block?

Hi there!

I am trying to use d3-sankey on a single HTML page visualization, vanilla JS, very straightforward.

But all examples I can find use some old version of the package, for example
https://www.d3-graph-gallery.com/graph/sankey_basic.html
https://bl.ocks.org/d3noob/06e72deea99e7b4859841f305f63ba85

I want to use the latest version to take advantage of the sankey.nodeId() function which doesn't seem to be available in the old version used by all examples. Simpy replacing the d3-sankey to the latest version breaks the example, the API seems to be quite different.

Is there an up to date example available and I am just missing it? If not, I think it would help a lot. Thanks! :)

Support cycles.

Hi, I searched for sankey cycles support and found some issues debating this some time ago. Among approaches with some working code, perhaps https://github.com/soxofaan/d3-plugin-captain-sankey seems the most interesting. It seems his author expected it to be subsumed into an official d3 repo (which I presume would be this one) at some point. But it's not clear to me what has happened since.

What's the status of this?
Thanks.

d3-sankey not functioning with ES6 imports, or just not functioning,

Im trying to use d3-sankey and for the most part very faithfully to examples such as this: https://bl.ocks.org/d3noob/013054e8d7807dff76247b81b0e29030
The one difference being I am using ES6 imports to pull in the plug in like so:

import * as d3Sankey from "d3-sankey";

and I am currently using the actual data from the example:

        var testData = {
    "nodes":[
    {"node":0,"name":"node0"},
    {"node":1,"name":"node1"},
    {"node":2,"name":"node2"},
    {"node":3,"name":"node3"},
    {"node":4,"name":"node4"}
    ],
    "links":[
    {"source":0,"target":2,"value":2},
    {"source":1,"target":2,"value":2},
    {"source":1,"target":3,"value":2},
    {"source":0,"target":4,"value":2},
    {"source":2,"target":3,"value":2},
    {"source":2,"target":4,"value":2},
    {"source":3,"target":4,"value":4}
    ]}

Later on when I push my data through the sankey function, it emerges unchanged, yet no errors are thrown. And then of course the transforms all fail because properties like d.x and d.y that d3-sankey would be inserting are not being inserted. Strangely I'm not getting any errors, d3-sankey seems to be not getting hit at all even though Im pretty confident I have imported it properly and it is a function. Below is the code - Any help greatly appreciated:

    function update(data) {


            // Set the sankey diagram properties.
            //NOTHING SEEMS TO BE HAPPENING HERE
            var aSankey = d3Sankey.sankey()
                .size([gWidth, gHeight]);


            var path = d3Sankey.sankeyLinkHorizontal();


            aSankey
                .nodes(testData.nodes)
                .links(testData.links);


                console.log(testData);
            // add in the links
            var link = dataLr.append("g").selectAll(".link")
                .data(testData.links)
                .enter().append("path")
                .attr("class", "link")
                .attr("d", path)
                .style("stroke-width", function(d) { return Math.max(1, d.dy); })
                .sort(function(a, b) { return b.dy - a.dy; });


            // add the link titles
            link.append("title")
                .text(function(d) {
                    //console.log(d);
                    return d.source.name + " → " +
                        d.target.name + "\n" + format(d.value);
                });


            // add in the nodes
            var node = dataLr.append("g").selectAll(".node")
                .data(testData.nodes)
                .enter().append("g")
                .attr("class", "node")
                .attr("transform", function(d) {
                    //console.log(d);
                  //THESE PROPERTIES ARE NOT PRESENT IN THE SANKEY DATA:
                    return "translate(" + d.x + "," + d.y + ")";
                    //return "translate(" + 20 + "," + 50 + ")";
                });

Sankey with Typescript

I installed d3 and d3-sankey, including their @types with via npm. If I do:

import * as d3 from 'd3';
import * as dd3 from 'd3-sankey';

.....
var sankey = d3.sankey()
.nodeWidth(15)
.nodePadding(10)
.extent([[1, 1], [width - 1, height - 6]]);

I cant get I running, it's not recognizing sankey() as a method on d3.

Uncaught (in promise): TypeError: Cannot read property 'getAttribute' of null TypeError: Cannot read property 'getAttribute' of null at Selection.selection_attr [as attr]
...

Type definition for sankey

Hi,
Are there any plans for creating a type definition file for consuming via typescript? I have code that uses this library, which needs to be ported to Typescript. Not sure how to tackle this problem. I am also relatively new to typescript.

Thanks!

Cannot use with Browserify?

I've been trying to use NPM to import d3-sankey into a visualisation I've been working on.

Either the documentation isn't clear or I'm going about this incorrectly.

The readme file recommends:

<script src="https://unpkg.com/d3-sankey@0"></script>
<script>

var sankey = d3.sankey();

</script>

However, this does not allow the kind of version control I want to use via package.json and Browserify.

So I have resorted to using this in my main JavaScript file:

var d3 = require("d3")
var sankey = require("d3-sankey").sankey
var sankeyLinkHorizontal = require("d3-sankey").sankeyLinkHorizontal

When I try to call d3.sankey() as recommended in the documentation, this obviously won't work.

So I have to use sankey = sankey() and so on instead...

I'm concerned I'm missing out on some key functionality by not having these as methods of d3 and by having separate callouts for sankey and sankeyLinkHorizontal -- though it could be that the issue I'm having with sankeyLinkHorizontal is unrelated.

In any case, some clearer documentation about the relationship between the plugin and D3 and how one might use in a Browserify situation would be a welcome change.

Hope this feedback helps!

nodePadding as a function?

It would be great to be able to pass a function into nodePadding, so that different nodes can have different padding.

My particular use case for this is showing hierarchical data, for which the nodes on the top level have a larger font size than the ones in the lower level.

image

Currently with a global nodePadding value, the padding is driven by the larger font size, and leaves unnecessary space between the nodes with the smaller font size.

Control/Understand node placement

Ive got two issues with sankey right now. That are related. Attached is my current graphic that is being produced. The first problem is that the inputs vs. outputs to the center node are not equal. That is by design, but the result is that the output links are clustered near the top of the node rather than the vertical center, which doesn't make sense to me. Can I control this?

The second is the placement of the target nodes on rthe right side of the diagram. Why would they float to the bottom, rather than also centering themselves vertically? Hard to understand. Can I control it?

image

Sankey link stroke gradient reference being corrupted by transition function

NOTE: Also posted as d3-transition issue #84.

I am setting the stroke of the Sankey links to a function that typically returns a color spec (i.e. #678 or rgb(255,64.0)). I recently added the capability for the stroke setting function to also return a gradient definition reference, such as "url(#grd_lb03)". I'm using the "Bostock Update Pattern" to manage the nodes and links. I am using the ".transition()" function when updating the links. However, I've discovered that is during the update cycle, when the stroke function is now returning a gradient definition reference, the transition function is inappropriately munching the URL so that I sometimes lose leading zeros in the URL string, such as "url(#grd_lb3)" in my earlier example. If I move the transition function call after stroke setting clause, the URL is not affected. This appears to be a bug in the transition function, trying to deal with the URL as if it is a color spec.

Snippet:

 // UPDATE old elements present in new data
this._Links.select("path")
    .attr("stroke", linkStrokeFunction)

    // This needs to be after the stroke setting due to an apprent bug in D3 that tries to transform a gradient defintiion URL reference during transition
    .transition().duration(this.STANDARD_TRANSITION_DURATION).delay(this.STANDARD_TRANSITION_DELAY)

    .attr("d", this._D3SankeyLinkHorizontal())
    .attr("stroke-width", (d: any) => Math.max(2, d.width))
    ;

Weird shadows on link-paths

On an angular project I used d3-sankey to create sankey diagramm. I followed the examples to create sankey diagramm:
https://beta.observablehq.com/@mbostock/d3-sankey-diagram
http://bl.ocks.org/d3noob/c2637e28b79fb3bfea13
and supports for typescript definitions.
The problem is with the links created. They have a black path in them, when I set the opacity less then 1.
opacity 0 4

When I set the opacity to 1, there are no shadows( I am not sure to call them shadows):
opacity 1.

I want to apply color gradients on the links like in the example of mbostock and to do that I have to set opacity to a value like 0.5.

Here is my code:

createSankey() {
    const margin = { top: 50, right: 50, bottom: 50, left: 50 },
    width = 100 * 6 - margin.left - margin.right,
    height = 90 * 4 - margin.top - margin.bottom;
    this.chartProps.margin = margin;
    this.chartProps.svg = d3.select('#id').append('svg')
        .attr('width', width + margin.left + margin.right)
        .attr('height', height + margin.top + margin.bottom)
      .append('g')
        .attr('transform', 
          'translate(' + margin.left + ',' + margin.top + ')');

    this.chartProps.sankeyy = sankeyGraph()
      .nodes(this.dataset.nodes)
      .links(this.dataset.links)
      .nodeWidth(36)
      .nodePadding(40)
      .size([width, height]);

    this.chartProps.sankeyy(this.dataset);

    const linkk = this.chartProps.svg.append('g')
        .attr('stroke-opacity', 0.5)
      .selectAll('g')
      .data(this.dataset.links)
      .enter().append('g')
        .style('mix-blend-mode', 'multiply');

    const link = linkk.append('path')
    link.attr('d', sankeyLinkHorizontal())
      .attr('stroke', 'grey')
      .attr('stroke-width', d => Math.max(1, d.width));

    link.append('title')
      .text(d => `${d.source.name} → ${d.target.name}\n${(d.value)}`);

    const _this = this;
    this.chartProps.nodes = this.chartProps.svg.append('g')
    .selectAll('g')
    .data(this.dataset.nodes)
    .enter().append('g')
      .attr('transform', d => 
          'translate(' + d.x0 + ',' + d.y0 + ')')
    .call(d3.drag()
      .on('start', function(d) {
        d3.select(this).raise().classed('active', true);
      })
      .on('drag', function(d: any)  {
        const a = d.y0;
        d.x0 = Math.max(0, Math.min(width - _this.chartProps.sankeyy.nodeWidth(), d3.event.x));
        d.y0  = Math.max(0, Math.min(height - d.y1 + d.y0, d3.event.y));
        d.x1 = d.x0 + _this.chartProps.sankeyy.nodeWidth();
        d.y1 = d.y0 + d.y1 - a;
        d3.select(this)
          .attr('transform', 'translate(' + d.x0 + ',' + d.y0 + ')');
          
        _this.chartProps.sankeyy.update(_this.dataset);
        link.attr("d", sankeyLinkHorizontal());
      })
      .on('end', function(d)  {
        d3.select(this).raise().classed('active', false);
      }));

    this.chartProps.nodes.append('rect')
        .attr('height', d => d.y1 - d.y0)
        .attr('width', d => d.x1 - d.x0)
        .style('fill', (d, i) => d3.schemeCategory10[i])
      .append('title')
        .text(d => `${d.name}\n${(d.value)}`);

    this.chartProps.nodes.append('text')
      .attr('x', d => d.x0 < width / 2 ? d.x1 - d.x0 + 6 : 0 - 6)
      .attr('y', d => (d.y1 - d.y0) / 2)
      .attr('dy', '0.35em')
      .attr('text-anchor', d => d.x0 < width / 2 ? 'start' : 'end')
      .text(d => d.name);
    
  }

Am I missing something, like setting an attribute etc. ?

Dummy nodes to avoid confusing intersections?

If you have links like A→B→C and another link that skips a layer like A→C, it’s really easy for the A→C link to intersect the B node. To illustrate in the energy flow diagram:

Sankey diagram

Here the 46 TWh link from Solid (in purple) to Industry (in blue) spuriously intersects Thermal generation and Electricity grid. Likewise the 49 Twh link from Gas to Industry intersects Electricity grid. This is mitigated only by the stroke opacity indicating overlap and that the tangents are not horizontal where the spurious intersection occurs.

One way to reduce these intersections would be to introduce dummy nodes (invisible nodes) in the intermediate layers. Since the link from Solid to Industry spans five layers, you might insert four intermediate dummy nodes: Solid→dummy→dummy→dummy→dummy→Industry. The first would help avoid intersection with Thermal generation, the next with Electricity grid, and so on. Ideally, the dummy nodes would only be used if the link intersected a node… although detecting intersection is tricky, since it requires making an assumption about how the links are rendered, and then complex Bézier math. Another possibility is that we don’t require horizontal tangents for the strokes when using the dummy nodes.

In any case, this isn’t easy—it will also require changing the representation of links so that a path (a sequence of control points) is returned rather than just a source and a target position. But I do think it could make a substantive improvement to the overall layout.

Support link.id.

Like from d3-force, link.id. It would allow you to specify an accessor function that computes a unique string identifier for a given node; that function would then be applied to each input node, then joined with the source and target of each input link to compute the graph.

For example, if you said:

sankey.nodeId(d => d.name);

You could then give as input:

{
  "nodes": [
    {"name": "A"},
    {"name": "B"},
    {"name": "C"}
  ],
  "links": [
    {"source": "A", "target": "B", "value": 1},
    {"source": "A", "target": "C", "value": 2},
    {"source": "B", "target": "C", "value": 3}
  ]
}

Link path with gradient is not visible

I'm new to d3 and I mostly played with the sankey example and filled it with my own data. Further, I took this example https://bl.ocks.org/micahstubbs/3c0cb0c0de021e0d9653032784c035e9 and applied it to the latest version of Mike Bostocks example.

In some cases, my gradient will not be rendered and I'm wondering why.
Here is a live example: https://bl.ocks.org/wiesson/87c7714081e1b1f24e5b36b4335b09c2

Here is an example image:
missing-link

If I do a minor change to the path:

M487.5,53.92715034058265
M487.5,53.92714034058265 // 53.92715 vs 53.92714

it will render as desired. Whats wrong here? If I remove the gradient, it works perfectly. I also tried to round the value from 73.45653630669118 to 70 but no difference.

Host d3-sankey.js somewhere

Could it be as easy as

<script src="https://d3js.org/d3.v4.js"></script>
<script src="https://d3js.org/d3-sankey.v0.js"></script>

?

@xaranke @mbostock

API Documentation v Source Code

In response to a community request, I drew up a TypeScript definition for the d3-sankey module and submitted a PR to DefinitelyTyped

In the process of doing so, I noticed that the API documentation does not appear to be in line with the actual source code. If there is interest, I don't mind preparing a PR to this repo to address the matter.

Most prominently, there are

  • layout generator methods, which are not documented size(...) and link(), and
  • wide-spread references to the use of accessor functions, when there are none used at present.
  • no explanation, of the node/link properties required or mutated by the layout generator (comparable to d3-force simulation nodes/links)

The key TS interface for the layout generator can be found here as part of PR 16051 for comparison.

While I already drafted some JSDoc style comments in the definitions, some of it is geared to the TS world (e.g. additional interfaces, explanation of generics)

However, with some mutual fine tuning, we could align the API documentation comparable to other D3 modules and the TS definitions.

Let me know, if you are interested. Cheers, T.

QUESTION: Nodes and links?? Size and Huge data.

Dear Sir,

I am from Austria and I am working as Junior Researcher at the university of applied sciences St. Pölten. Here we have a Data Visualization group where we specify on data visualization and all kinds of stuff and your libraries are like our holy grail. I would need you help to a very specific library and problem and question regarding this. I am using the old verison of sankey.js.

There for a specific project I would like to extend a existing everytime I load more nodes and links to the visualization and would like to base the svg height dynamically on the nodes. Therefore it would be necessary to set a minimum height for each node of 10px for example. I dunno how to exactly change the library or if I am allowed too in order to make the height based on the nodes.
Another problem we are facing is that we want overlays for the nodes in a form of another rectangle which is smaller that overlays each node source and target. I fixed this by simply adding every rectangle twice... Dunnno slight workaround. Anyway the other problem is the real thing I would need your help or the help of one of your great community members.

You can see this link for a shortvideo about the visualization and the problem occuring. It visualizes the flow of media transparency data for Austria.
https://drive.google.com/file/d/0B1xMwDuWYZI8dGxuei1UQ3JrTFk/view?usp=sharing

UPDATE:

I already found out how to set the minimum size and maximum size of the nodes, but now there is another problem. I tried to set the maximum and minimum size of each not to 10 and 500 px. You can guess it already, that the problem is now with the paths between them. Even if the paths are small there are sometimes too many and they are attached at the bottom of the node. Is there a way to let the paths start from the middle of the node?

parameterize the sorting algorithm in resolveCollisions()

I'm new to d3-sankey and d3.js in general, thanks for this software, it's just amazingly powerful.
One feature is missing in sankey : the ability to customize the sorting algorithm used in resolveCollisions().
I'm building a diagram where I need vertical nodes to be sorted by name instead of "ascendingBreadth". I modified the source code by putting my own sorting function and it works like a charm; but it would be much better if the sorting function could be passed as a parameter to sankey().

Property 'Sankey' doesn't exist on @types/d3

d3.sankey()function doesn't exist in d3 package, even though I have installed d3-sankey package.

import * as d3 from 'd3';
import { sankey as Sankey } from 'd3-sankey';

var sankey = d3
.sankey()
.nodeWidth(15)
.nodePadding(10)
.extent([1, 1], [dimensions.innerWidth - 1, dimensions.innerHeight - 6]);

Property 'sankey' does not exist on type 'typeof import("/node_modules/@types/d3/index")'.

Drag does not work in the example

Drag of nodes does not work (the same for the bl.ock mentioned in issue #6 )
Here is what I get in the Chrome Console:

Uncaught TypeError: Cannot read property 'y' of undefined
at SVGGElement.dragmove ((index):138)
at e.apply (d3.min.js:2)
at b (d3.min.js:1)
at Object.l [as mouse] (d3.min.js:1)
at r (d3.min.js:1)
at d3.min.js:1

The code seems ok and similar to other bl.ocks for d3 v4 sankeys.
The issue stems from the custom built d3.min.js.
Substituting

  <script src="d3.min.js"></script>

with

  <script src="//d3js.org/d3.v4.min.js"></script>
  <script src="//unpkg.com/d3-sankey@0"></script>

fixes everything.

TypeError: sankey is not a function

Building a project on top of Meteor & React, using the sankey-d3 NPM package gives me this TypeError. I looked for a potential alternative on Atmosphere (Meteor's package manager), but found nothing. Well, yeah, 1 package with 1 install... But that one gave me this:

While processing files with ecmascript (for target web.browser): packages/redaty:raphael/raphael.js:2866:28: packages/redaty:raphael/raphael.js: "Raphael" is read-only

So, noped out of there and removed it again. I have NPM installed the 'd3' package as well and looking in my node_modules directory I see all the d3 folders loading correctly. The code involved is right here:

import React, { Component } from 'react';

import * as d3 from 'd3';

import { scaleLinear } from 'd3-scale';
import { min, max } from 'd3-array';
import { select } from 'd3-selection';
import { sankey } from 'd3-sankey';

class Graph extends React.Component {
    constructor(props) {
        super(props);

        this.createLineGraph = this.createLineGraph.bind(this);
        this.createBarChart = this.createBarChart.bind(this);
        this.createPieChart = this.createPieChart.bind(this);
        this.createSankeyGraph = this.createSankeyGraph.bind(this);
        // this.createRadialChart = this.createRadialChart.bind(this);

        this.createTheGraphs = this.createTheGraphs.bind(this);

        this.state = {
 
        };

    }

    getDimensions() {
        const margin = {top: 20, right: 20, bottom: 20, left: 20},
            padding = {top: 40, right: 40, bottom: 40, left: 40},
            outerWidth = parseInt(this.props.size[0]),
            outerHeight = parseInt(this.props.size[1]),
            innerWidth = outerWidth - margin.left - margin.right,
            innerHeight = outerHeight - margin.top - margin.bottom,
            width = innerWidth - padding.left - padding.right,
            height = innerHeight - padding.top - padding.botto,
            radius = parseInt(min([innerWidth, innerHeight]) / 2),
            donutHole = this.props.type === "DONUT" ? radius / 2 : 0,
            color = d3.scaleLinear()
                .domain([1, this.props.data.length])
                .interpolate(d3.interpolateHcl)
                .range([d3.rgb("#AF2192"), d3.rgb("#98D719")]);

        // DON'T DO DATA MAPPING ON SANKEY GRAPH SINCE DATA STRUCTURE IS DIFFERENT
        if (this.props.type !== "SANKEY") {

            // HIGHEST VALUE OF ITEMS IN DATA ARRAY
            const dataMax = max(this.props.data.map(item => item.value)),
                dataSpread = (innerWidth / this.props.data.length),
                // DEPEND SCALE OF ITEMS ON THE Y AXIS BASED ON HIGHEST VALUE
                yScale = scaleLinear()
                    .domain([0, dataMax])
                    .range([0, innerHeight]),
                // GENERATE THE LINE USING THE TOTAL SPACE AVAILABLE FROM THE SIZE PROP DIVIDED BY THE LENGTH OF THE DATA ARRAY
                lineGen = d3.line()
                    .x((d, i) => i * dataSpread)
                    .y(d => innerHeight - yScale(d))
                    // CURVEMONOTONEX GAVE THE BEST RESULTS
                    .curve(d3.curveMonotoneX);

            dimensions = {margin, padding, outerWidth, outerHeight, innerWidth, innerHeight, radius, donutHole, color, dataMax, dataSpread, yScale, lineGen};

        } else {

            dimensions = {margin, padding, outerWidth, outerHeight, innerWidth, innerHeight, radius, donutHole, color};

        }

    }

    createLineGraph(data) {
        const lineNode = this.node;

        // GET DIMENSIONS IN A GLOBAL-VAR-LIKE WAY
        this.getDimensions();

        // SVG ELEMENT INCLUDING THE INSIDE MARGIN
        var SVG = select(lineNode)
            .attr('width', dimensions.outerWidth)
            .attr('height', dimensions.outerHeight)
            .append('g')
            .attr('width', dimensions.innerWidth)
            .attr('height', dimensions.innerHeight)
            .attr('transform', 'translate(' + dimensions.margin.left + ',' + dimensions.margin.top +')')

        SVG.append('path')
            .attr('d', dimensions.lineGen(this.props.data.map(item => item.value)))
            .attr('stroke', (d, i) => dimensions.color(i))
            .attr('stroke-width', '6')
            .attr('fill', 'none')

        SVG.append('path')
            .attr('d', dimensions.lineGen(this.props.data2.map(item => item.value)))
            .attr('stroke', '#0847D8')
            .attr('stroke-width', '6')
            .attr('fill', 'none')

        // IF DOTS (POINTS) ARE ENABLED IN THE COMPONENT PROPS, SHOW THEM
        if (this.props.withDots) {
            var g = SVG.append('g')

            g.selectAll('circle')
                .data(this.props.data.map(item => item.value))
                .enter()
                .append('circle')

            g.selectAll('circle')
                .data(this.props.data.map(item => item.value))
                .exit()
                .remove()            

            g.selectAll('circle')
                .data(this.props.data.map(item => item.value))
                .attr('cx', (d, i) => i * dimensions.dataSpread)
                .attr('cy', d => dimensions.innerHeight - dimensions.yScale(d))
                .attr('r', '6')
                .attr('width', '3')
                .attr('height', '3')
                .attr('fill', '#3637FA')
                .attr('stroke', '#FFFFFF')
                .attr('stroke-width', '2')
        }
    }

    createBarChart(node) {
        const barNode = this.node;

        // GET DIMENSIONS IN A GLOBAL-VAR-LIKE WAY
        this.getDimensions();

        var SVG = select(barNode)
            .attr('width', dimensions.outerWidth)
            .attr('height', dimensions.outerHeight)
            .append('g')
            .attr('width', dimensions.innerWidth)
            .attr('height', dimensions.innerHeight)
            .attr('transform', 'translate(' + dimensions.margin.left + ',' + dimensions.margin.top +')')

        SVG.selectAll('rect')
            .data(this.props.data.map(item => item.value))
            .enter()
            .append('rect')
        
        SVG.selectAll('rect')
            .data(this.props.data.map(item => item.value))
            .exit()
            .remove()
        
        SVG.selectAll('rect')
            .data(this.props.data.map(item => item.value))
            .style('fill', (d, i) => dimensions.color(i))
            .attr('x', (d,i) => i * dimensions.dataSpread)
            .attr('y', d => dimensions.innerHeight - dimensions.yScale(d))
            .attr('height', d => dimensions.yScale(d))
            .attr('width', dimensions.dataSpread - 10)
    }

    createPieChart(data) {
        const pieNode = this.node;

        const [pieData] = [this.props.data.map(item => item.value)];

        console.log(dimensions.donutHole);

        // GET DIMENSIONS IN A GLOBAL-VAR-LIKE WAY
        this.getDimensions();

        var ARC = d3.arc()
            .outerRadius(dimensions.radius - 20)
            .innerRadius(dimensions.donutHole);

        var PIE = d3.pie()
            .sort(null)
            .value((d) => d);

        var SVG = select(pieNode)
            .attr('width', dimensions.outerWidth)
            .attr('height', dimensions.outerHeight)
            .append('g')
            .attr('width', dimensions.innerWidth)
            .attr('height', dimensions.innerHeight)
            .attr('transform', 'translate(' + dimensions.innerWidth / 2 + ',' + dimensions.innerHeight / 2 +')');

        var g = SVG.selectAll('.arc')
            .data(PIE(pieData))
            .enter()
            .append('g')
            .attr('class', 'arc');

        g.append('path')
            .attr('d', ARC)
            .style('fill', (d, i) => dimensions.color(i))
    }

    createSankeyGraph(data) {
        // PLACEHOLDER MASTER GRAPH

        const sankeyNode = this.node;
        
        // GET DIMENSIONS IN A GLOBAL-VAR-LIKE WAY
        this.getDimensions();

        var formatNumber = d3.format(',.0f'),
            format = (d) => {formatNumber(d) + " Potential Guests"},
            color = d3.scaleOrdinal(d3.schemeCategory10);

        var sankey = sankey()
            .nodeWidth(15)
            .nodePadding(10)
            .extent([1, 1], [dimensions.innerWidth - 1, dimensions.innerHeight - 6]);

        var SVG = select(pieNode)
            .append('g')
            .attr('transform', 'translate(' + dimensions.margin.left + ',' + dimensions.margin.top +')');

        var link = SVG.append('g')
            .attr('class', 'links')
            .selectAll('g');

        // d3.json(data, function(error, data) {
        //     if (error) throw error;

            sankey(data);

            link = link
                .data(data.links)
                .enter()
                .append('path')
                .attr('d', d3.sankeyLinkHorizontal())
                .attr('stroke-width', (d) => Math.max(1, d.width));

            link.append('title')
                .text((d) => d.source.name + " → " + d.target.name + "\n" + format(d.value))

            node = node
                .data(data.nodes)
                .enter()
                .append('g')

            node.append('rect')
                .attr('x', d => d.x0)
                .attr('y', d => d.y0)
                .attr('height', d => d.y1 - d.y0)
                .attr('width', d => d.x1 - d.x0)
                .attr('fill', (d, i) => color(i))
                .attr('stroke', 'black');

            node.append('text')
                .attr('x', d => d.x0 - 6)
                .attr('y', d => (d.y1 + d.y0) / 2)
                .attr('dy', '.35em')
                .attr('text-anchor', 'end')
                .text(d => d.name)
                .filter(d => d.x0 < dimensions.innerWidth / 2)
                .attr('x', d => d.x1 + 6)
                .attr('text-anchor', 'start');

            node.append('title')
                .text(d => d.name + "\n" + format(d.value));

        // });
    }

    createTheGraphs() {
        (this.props.type === "LINE") ? this.createLineGraph() : "";
        (this.props.type === "BAR") ? this.createBarChart() : "";
        (this.props.type === "PIE" || this.props.type === "DONUT") ? this.createPieChart() : "";
        (this.props.type === "SANKEY") ? this.createSankeyGraph() : "";
        (this.props.type === "RADIAL") ? this.createRadialChart() : "";
    }

    componentDidMount() {
        this.createTheGraphs();
    }

    componentDidUpdate() {
        this.createTheGraphs();
    }

    render() {
        return(
            <div className="Graph">
                <svg className='Graph_Container' ref={node => this.node = node}></svg>
                <h2>{this.props.type} Placeholder</h2>
            </div>
        );
    }
}

Graph.propTypes = {

};

export default Graph;

Ignore all the other graphs, just copied the whole thing. All the other charts are being rendered properly, so all their d3 code is obviously working. I just added the code for the Sankey graph last.

  • Just removed duped post, after submitting that one I got a 404 from GitHub <3

Better layout heuristics?

We are too aggressive about push nodes towards the center of its source and target neighbors, rather than containing the node within their spans.

[Feature request] searching nodes based on String and numeric id

Correct me if i'm wrong. The current d3-sankey only allows searching nodes based on numeric ID. it will be good if we can search by node name. For example, the JSON file below, we can simply store the links in DB easily.

{ "nodes":[ {"name":"Barry"}, {"name":"Frodo"}, {"name":"Elvis"}, {"name":"Sarah"}, {"name":"Alice"} ], "links":[ {"source":"Barry","target":"Elvis","value":2}, {"source":"Frodo","target":"Elvis","value":2}, {"source":"Frodo","target":"Sarah","value":2}, {"source":"Barry","target":"Alice","value":2}, {"source":"Elvis","target":"Sarah","value":2}, {"source":"Elvis","target":"Alice","value":2}, {"source":"Sarah","target":"Alice","value":4} ]}

Possible modification is to include a find id by string method. at:
Function find(nodeById, id)

Cheers.

Disappearing Links

I tried to create a perfectly rectangle sankey diagram by giving equal number for values in each layer, but it resulted in having the top and bottom rows of links disappeared. When I edit path curve points and round some numbers, they're revealed.
screen shot 2017-07-27 at 11 07 15 am

Specify node and link colors

Would it be possible to add an API function that takes in an associative array which defines keys that represent either the name of a node or some representation of a link, and then specifies color values?

So something like,

"nodeColors": {
   "Nuclear": "#FF0000",
   "Other waste": "#0000FF",
   "default": "#000000"
}

Maybe for links, an array of objects:

"linkColors": [
  {"source":"Nuclear", "target":"Nuclear", "color":"#00FF00"},
  {"source":"Nuclear", "target":"Other waste", "color":"#000000"}
]

If this is already possible, please let me know.

Node placement problem

Hello,

I'm trying to create a chart with this library but for some reason some nodes get placed a bit weirdly, please see the screenshot. I'd expect the B and F node to be placed further down so that they don't overlap the other elements (since there's plenty of space for that). I basically copied the example, styled it, and replaced the data with my own, otherwise the example code is intact. Not sure if this is a bug or if there's some reason why the chart is drawn like this. I'd be happy to try to fix it and submit a PR but I just wanted to confirm that this behaviour is not by design before I give it a shot. Thank you

screen shot 2016-04-15 at 15 28 48

My data:

var data = {
  nodes:[
    {name:"A"},
    {name:"B"},
    {name:"C"},
    {name:"D"},
    {name:"E"},
    {name:"F"},
    {name:"G"}
  ],
  links:[
    {source:0, target:1, value:100},
    {source:0, target:2, value:200},
    {source:1, target:3, value:40},
    {source:1, target:2, value:40},
    {source:1, target:6, value:20},
    {source:2, target:4, value:200},
    {source:2, target:5, value:40},
    {source:5, target:6, value:40},
  ]
}

I don't see the chart, but just the nodes as text

Trying to implement sankey to the latest version of Angular. I followed this gist, but the only thing I get is the Nodes in plain text instead of the graph.

I made a plunker with a minimum installation to reproduce the issue

Short story,

I import the libraries on my component:

    import * as d3 from 'd3';
    import * as d3Sankey from 'd3-sankey';

Called a DrawChart() on ngOnInit:

    ngOnInit() {
          this.DrawChart();
    }

Implement the DrawChart() function:

    private DrawChart() {
        
                var svg = d3.select("#sankey"),
                    width = +svg.attr("width"),
                    height = +svg.attr("height");
        
                var formatNumber = d3.format(",.0f"),
                    format = function (d: any) { return formatNumber(d) + " TWh"; },
                    color = d3.scaleOrdinal(d3.schemeCategory10);
        
                var sankey = d3Sankey.sankey()
                    .nodeWidth(15)
                    .nodePadding(10)
                    .extent([[1, 1], [width - 1, height - 6]]);
        
                var link = svg.append("g")
                    .attr("class", "links")
                    .attr("fill", "none")
                    .attr("stroke", "#000")
                    .attr("stroke-opacity", 0.2)
                    .selectAll("path");
        
                var node = svg.append("g")
                    .attr("class", "nodes")
                    .attr("font-family", "sans-serif")
                    .attr("font-size", 10)
                    .selectAll("g");
        
                d3.json("../../../assets/vendors/uk2015.json", function (error, energy: any) {
                    if (error) throw error;
                    
                    sankey(energy);
        
                    link = link
                        .data(energy.links)
                        .enter().append("path")
                        .attr("d", d3Sankey.sankeyLinkHorizontal())
                        .attr("stroke-width", function (d: any) { return Math.max(1, d.width); });
        
                    link.append("title")
                        .text(function (d: any) { return d.source.name + " → " + d.target.name + "\n" + format(d.value); });
        
                    node = node
                        .data(energy.nodes)
                        .enter().append("g");
        
                    node.append("rect")
                        .attr("x", function (d: any) { return d.x0; })
                        .attr("y", function (d: any) { return d.y0; })
                        .attr("height", function (d: any) { return d.y1 - d.y0; })
                        .attr("width", function (d: any) { return d.x1 - d.x0; })
                        .attr("fill", function (d: any) { return color(d.name.replace(/ .*/, "")); })
                        .attr("stroke", "#000");
        
                    node.append("text")
                        .attr("x", function (d: any) { return d.x0 - 6; })
                        .attr("y", function (d: any) { return (d.y1 + d.y0) / 2; })
                        .attr("dy", "0.35em")
                        .attr("text-anchor", "end")
                        .text(function (d: any) { return d.name; })
                        .filter(function (d: any) { return d.x0 < width / 2; })
                        .attr("x", function (d: any) { return d.x1 + 6; })
                        .attr("text-anchor", "start");
        
                    node.append("title")
                        .text(function (d: any) { return d.name + "\n" + format(d.value); });
                });
            }
    
        }

No error on console or something that will point me to the right direction.

Vertical alignement of Nodes

Hello,
First off, very nice library!

For my specific use-case, there is an option that I am needing, and I can't find the way to make it myself, through fidling in the library..

That would be to be able to vertically align nodes, kind of like with the nodeAlign option but in the vertical level.

In my specific case, I would like to make the node "stick" to the top, as the current results are not very satisfactory for a one-node first level and multiple-node next levels . See picture to understand the issue.

image

Thanks again for the great library!

Is this repository active?

I've seen several good contributions in terms of pull requests in this repo that haven't been responded to for quite some time (some in over a year), as well as issues.

Is this repository active, or if not, is there someone else who has continued this project?

Sankey diagram

Hello,

I want to show totals in the squares as it is written in this picture. How can I make it ? Or can someone make it?
image

Allow some nodes to have fixed positions?

Hello,
First of all I am a big fan of all d3 related :)

While sankey does a great job with its layout capabilities, I am missing the simple ability of placing a node at a given X,Y.
Our design requires us to place a node at a corner like in the following picture:

image

I've managed to add a simple function accountForStickyNodesPosition to sankeys source which solves my need, and thought to share it here and get a feedback.

sankey.layout = function(iterations) {
  ...
  accountForStickyNodesPosition();
  return sankey;
};
...
function accountForStickyNodesPosition() {
  nodes.forEach(function(node) {
    node.y = (node.YPos) ? parseInt(node.YPos) : node.y;
    node.x = (node.XPos) ? parseInt(node.XPos) : node.x;
  });
}

later all it takes is to add one of the following props YPos and XPos to your chosen node like so

var data = {
  links: [
    { source: "Root", target: "A", value: "100" },
    { source: "Root", target: "B", value: "80" },
    ...
  ],
  nodes: [
    { name: "Root", YPos: '0' },
    { name: "A" },
    { name: "B" },
    ...
  ],
};

maybe there is a better way of doing this, would like to hear your thoughts.

possible bug in resolveCollisions

Changed line 244 in sankey.js, in order to properly fit chart (removing overlaps in links).

if (dy > 0) {
to
if (dy > -nodePadding) {

Request: Variable node width

Hello, I would appreciate D3!

Request to d3-sankey:
Is there an API for changing the width of each node according to the information of each node?
Currently the width of all nodes is the same, but I would like to be able to change each node width according to node properties such as node.length or node.lengthProportion.

graph.nodes.forEach(function(node) {
        node.x1 = (node.x0 = x0 + Math.max(0, Math.min(x - 1, Math.floor(align.call(null, node, x)))) * kx) + dx;
   // dx is the constant number, but could it be variable?

Nodes and links limitation

Hello,
I have an application with a fairly high number of nodes (107) and links (224). Every time I try to draw the diagram, the page freezes and seems never to finish the calculations. When I reduced the number of nodes to 10 and links to 20, I could draw the chart without problems.

So, my question is, is there a limit of nodes and links to which this library can be applied? I have waited for more than 2 minutes for the drawing to show up but nothing happens. Should I wait longer (P.S.: speed is not critical for me)?

I am using a function to map the source and target nodes. If instead I use the standard approach with indexes, would it be faster?

Possible infinite loop in sankey generator

I believe I have found an infinite loop behavior in the sankey generator. To reproduce it, I'm calling the sankey generator multiple times with different data (different nodes and links). If you could see the code that I have attached, the slider freezes when it reaches the year 2004 (actually, I don't know why 2004, the data is similar to all the others). The sankey function is called in line 22 of sankey_migration.js

Thank you for d3js and sankey.

sankey_migration_infinite_loop.zip

Include TypeScript definition?

Hi!
I use the DefinitelyTyped D3 TypeScript definitions quite regularly, and I noticed that d3-sankey doesn't have a definition.

GIven the API surface is like half a dozen methods, it probably would be pretty trivial to do. Am happy to do so myself (was hoping to use d3-sankey in the TypeScript chapter of the book I'm working on), but am wondering whether you'd rather include the def with the lib itself or if I should maintain it separately using DefinitelyTyped? Personally I'd prefer to just PR into this repo and include it that way as then TypeScript will just grab the version with the module and not require a separate installation from the @types npm org.

Recommend Projects

  • React photo React

    A declarative, efficient, and flexible JavaScript library for building user interfaces.

  • Vue.js photo Vue.js

    🖖 Vue.js is a progressive, incrementally-adoptable JavaScript framework for building UI on the web.

  • Typescript photo Typescript

    TypeScript is a superset of JavaScript that compiles to clean JavaScript output.

  • TensorFlow photo TensorFlow

    An Open Source Machine Learning Framework for Everyone

  • Django photo Django

    The Web framework for perfectionists with deadlines.

  • D3 photo D3

    Bring data to life with SVG, Canvas and HTML. 📊📈🎉

Recommend Topics

  • javascript

    JavaScript (JS) is a lightweight interpreted programming language with first-class functions.

  • web

    Some thing interesting about web. New door for the world.

  • server

    A server is a program made to process requests and deliver data to clients.

  • Machine learning

    Machine learning is a way of modeling and interpreting data that allows a piece of software to respond intelligently.

  • Game

    Some thing interesting about game, make everyone happy.

Recommend Org

  • Facebook photo Facebook

    We are working to build community through open source technology. NB: members must have two-factor auth.

  • Microsoft photo Microsoft

    Open source projects and samples from Microsoft.

  • Google photo Google

    Google ❤️ Open Source for everyone.

  • D3 photo D3

    Data-Driven Documents codes.