corteva / rioxarray Goto Github PK
View Code? Open in Web Editor NEWgeospatial xarray extension powered by rasterio
Home Page: https://corteva.github.io/rioxarray
License: Other
geospatial xarray extension powered by rasterio
Home Page: https://corteva.github.io/rioxarray
License: Other


![dependabot[bot] avatar](https://avatars.githubusercontent.com/in/29110?v=4 "dependabot[bot]")


Currently rioxarray.open_rasterio can open subdatasets, but the 1-D (usually time) dimension is lost.
The xarray.open_rasterio function exists, but it has issues with loss of CRS information due to export to PROJ string. Additionally, it would be nice to have the data loaded into standard netCDF locations (e.g. nodatavals should use _FillValue).
Currently there are band-specific attributes stored in the attrs. However, this can be potentially lossy when performing xarray operations. So, I am thinking about storing them in the coordinates as arrays along the band dimension. This will also be useful when selecting a specific band as you will only have the subset of data associated with the band.
Proposed coordinates:
Additionally. I am thinking about adding a profile and or metadata coordinate to store the profile information from the raster not stored in other attributes to persist when writing. For example - compression, tiling, etc...
This should make things simpler and more reliable for #76.
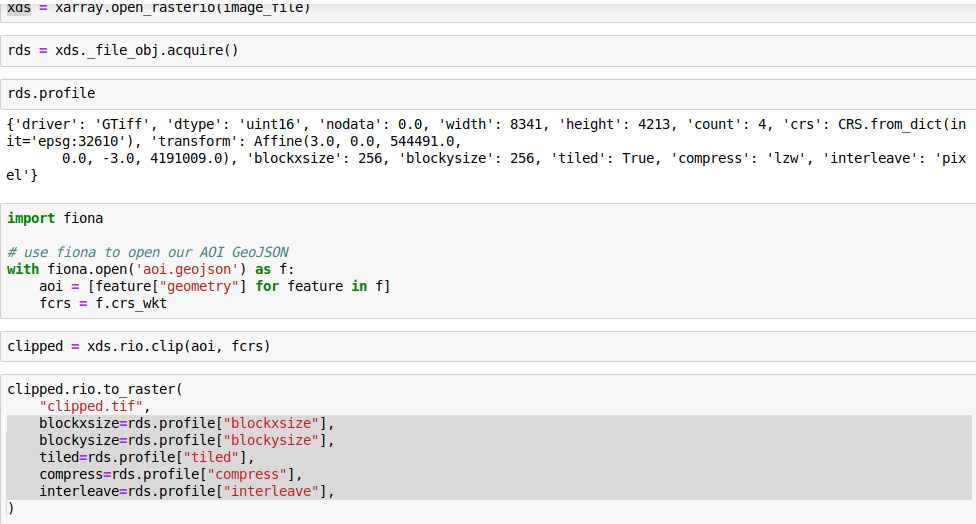
I have a question that I am not able to figure out using previous issues and other stackoverflow posts. My question is similar to #47, but I could not make work with my dataset. I am attempting to reproject and export images in a geotiff format.
If I have an xarray dataset d. For reproducibility, here I have uploaded d as a zip archive to this issue.
import os
os.environ['GDAL_DATA'] = r"C:\Program Files\GDAL\gdal-data"
import xarray as xr
import rioxarray
import pandas as pd

data = xr.open_dataset('test.nc')

d = data.SWE

d.rio.set_spatial_dims('lon','lat', inplace=True)
d.rio.set_crs("epsg:4326")
d.rio.reproject('+proj=aea +lat_1=29.5 +lat_2=45.5 +lat_0=23 +lon_0=-96 +x_0=0 +y_0=0 +datum=WGS84 +units=m +no_defs')

oName = rf"C:\workspace\ririe\test\{pd.to_datetime(d.time.values).strftime('%Y-%m-%d')}.tif"

d.rio.to_raster(oName)
This outputs a raster but is projected in the original epsg:4326 projection. How can I fix this?
# Name                    Version                   Build  Channel
rioxarray                 0.0.23                   pypi_0    pypi
xarray                    0.15.0                   pypi_0    pypi
import rioxarray
import xarray as xr
#Sentinel-5P data
xds = xr.open_dataset(r'S5P_NRTI_L2__NO2____20190513T181819_20190513T182319_08191_01_010301_20190513T185033.nc', group="/PRODUCT")
data = xds.nitrogendioxide_tropospheric_column
data.rio.to_raster("test1.tif")
gives error: "x dimension not found. 'set_spatial_dims()' can address this." rioxarray.exceptions.DimensionError: x dimension not found. 'set_spatial_dims()' can address this.
I am wondering if the maintainers here would consider allowing the addition of a keyword that would allow user to turn off the recalculation of the transform in to_raster(). Currently, the tranform is always recalculated:
with rasterio.open(
....
transform=self.transform(recalc=True)
...)
I would propose something like:
def to_raster(
…
trans_recalc = True
…)
and
with rasterio.open(
....
transform=self.transform(recalc=trans_recalc)
...)
Any objections?
It would be a nice feature to be able to load in subdatasets from rasterio.
Currently the nodata property searches for nodata in _FillValue. But it is not always the case (e.g. open_rasterio uses nodatavals). Also, the logic for getting/setting nodata in reproject is needs to be better generalized. Additionally, when writing to_raster is is probably to set the nodata value to the one in encoding if it exists and to use fillna to unset NaN values with the encoding value.
Would probably be a good idea to highlight the CRS get/set features so it is more transparent.
Currently, you could set the nodata or crs metadata in the attrs, but it won't be re-discovered if you already attempted to access them (reguardless if it was found or not). These methods would reset the cache properly so the accessor knows to re-search for these properties.
$ radon cc --min B rioxarray --total-average
rioxarray/rioxarray.py
    M 1080:4 RasterArray.to_raster - B
    M 697:4 RasterArray.reproject - B
    M 861:4 RasterArray.clip_box - B
    M 290:4 XRasterBase.write_crs - B
    M 529:4 RasterArray.nodata - B
    M 562:4 RasterArray.resolution - B
    M 603:4 RasterArray._check_dimensions - B
    M 1172:4 RasterDataset.crs - B
    M 223:4 XRasterBase.crs - B
    M 922:4 RasterArray.clip - B
rioxarray/_io.py
    F 197:0 open_rasterio - E
    M 60:4 RasterioArrayWrapper._get_indexer - B
    M 118:4 RasterioArrayWrapper._getitem - B
    F 176:0 _parse_tags - B

70 blocks (classes, functions, methods) analyzed.
Average complexity: A (3.5714285714285716)
http://radon.readthedocs.org/en/latest/index.html
https://www.codacy.com/
Does rioxarray allow loading image data from the COG overviews into xarray?
I didn't find it but just wanted to make sure I didn't miss it.
It would be useful to write the dataframe out to a geotiff file.
data = xr.open_dataset('https://oceandata.sci.gsfc.nasa.gov:443/opendap/MODIST/L3SMI/2020/001/T2020001.L3m_DAY_CHL_chl_ocx_4km.nc')
data = data.rename({"lon": "longitude", "lat": "latitude"})

data.rio.set_spatial_dims(x_dim='longitude', y_dim='latitude')
data.rio.write_crs('EPSG:4826', inplace=True)
data.rio.clip(geometries=regional, crs='EPSG:4826')

---------------------------------------------------------------------------
DimensionError                            Traceback (most recent call last)
<ipython-input-44-7be6870bde44> in <module>
      1 data.rio.set_spatial_dims(x_dim='longitude', y_dim='latitude')
      2 data.rio.write_crs('EPSG:4826', inplace=True)
----> 3 data.rio.clip(geometries=regional, crs='EPSG:4826')

/opt/tljh/user/lib/python3.7/site-packages/rioxarray/rioxarray.py in clip(self, geometries, crs, all_touched, drop, invert)
   1505             clipped_dataset[var] = (
   1506                 self._obj[var]
-> 1507                 .rio.set_spatial_dims(x_dim=self.x_dim, y_dim=self.y_dim, inplace=True)
   1508                 .rio.clip(
   1509                     geometries,

/opt/tljh/user/lib/python3.7/site-packages/rioxarray/rioxarray.py in set_spatial_dims(self, x_dim, y_dim, inplace)
    500
    501         data_obj = self._get_obj(inplace=inplace)
--> 502         set_dims(data_obj, x_dim, y_dim)
    503         return data_obj
    504

/opt/tljh/user/lib/python3.7/site-packages/rioxarray/rioxarray.py in set_dims(obj, in_x_dim, in_y_dim)
    493                 obj.rio._x_dim = x_dim
    494             else:
--> 495                 raise DimensionError(f"x dimension not found: {x_dim}")
    496             if y_dim in obj.dims:
    497                 obj.rio._y_dim = y_dim

DimensionError: x dimension not found: longitudeHi,
I'm trying to clip using a geometry but cannot find the x dimension even after using set_spatial_dims .
The regional geometry is in the details section.
Thank you in advance!
A clipped version of the file
pip show rioxarrayName: rioxarray
Version: 0.0.23
Summary: rasterio xarray extension.
Home-page: https://github.com/corteva/rioxarray
Author: rioxarray Contributors
Author-email: [email protected]
License: BSD license
Location: /opt/tljh/user/lib/python3.7/site-packages
Requires: scipy, xarray, rasterio, pyproj, pillow
Required-by:
# The Geometry:
{'type': 'FeatureCollection',
'name': 'regional_test',
'features': [{'type': 'Feature',
'properties': {'id': 0},
'geometry': {'type': 'MultiPolygon',
'coordinates': [[[[-70.97970167, -26.0388336409],
[-70.983784738, -21.0026871197],
[-70.0718506076, -21.0020545141],
[-70.0677675396, -26.0382247972],
[-70.97970167, -26.0388336409]]]]}}]}
The following works:
surface_model_SJER_xarr = rioxarray.open_rasterio("data/NEON-DS-Airborne-Remote-Sensing/SJER/DSM/SJER_dsmCrop.tif", masked=True)
terrain_model_SJER_xarr= rioxarray.open_rasterio("data/NEON-DS-Airborne-Remote-Sensing/SJER/DTM/SJER_dtmCrop.tif", masked=True)

terrain_model_SJER_xarr_matched = terrain_model_SJER_xarr.rio.reproject_match(surface_model_SJER_xarr)

canopy_height_SJER_xarr = surface_model_SJER_xarr - terrain_model_SJER_xarr_matched
plt.figure()
canopy_height_SJER_xarr.plot(robust=True, cmap="viridis")
plt.title("Canopy Height Model for San Joaquin Experimental Range, Z Units: Meters")
plt.savefig("fig/03-SJER-CHM-map-05.png")
canopy_height_SJER_xarr.rio.to_raster("./data/outputs/CHM_SJER.tif")
But when I try to reproject_match the other way around, it fails
surface_model_SJER_xarr = rioxarray.open_rasterio("data/NEON-DS-Airborne-Remote-Sensing/SJER/DSM/SJER_dsmCrop.tif", masked=True)
terrain_model_SJER_xarr= rioxarray.open_rasterio("data/NEON-DS-Airborne-Remote-Sensing/SJER/DTM/SJER_dtmCrop.tif", masked=True)

terrain_model_SJER_xarr_matched = surface_model_SJER_xarr.rio.reproject_match(terrain_model_SJER_xarr)

canopy_height_SJER_xarr = surface_model_SJER_xarr - terrain_model_SJER_xarr_matched
plt.figure()
canopy_height_SJER_xarr.plot(robust=True, cmap="viridis")
plt.title("Canopy Height Model for San Joaquin Experimental Range, Z Units: Meters")
plt.savefig("fig/03-SJER-CHM-map-05.png")
canopy_height_SJER_xarr.rio.to_raster("./data/outputs/CHM_SJER.tif")
The error is below and occurs at the ploting stage because canopy_height_SJER_xarr is empty
---------------------------------------------------------------------------
IndexError                                Traceback (most recent call last)
<ipython-input-8-e24efe9d95e4> in <module>
      4 canopy_height_SJER_xarr = surface_model_SJER_xarr - terrain_model_SJER_xarr_matched
      5 plt.figure()
----> 6 canopy_height_SJER_xarr.plot(robust=True, cmap="viridis")
      7 plt.title("Canopy Height Model for San Joaquin Experimental Range, Z Units: Meters")
      8 plt.savefig("fig/03-SJER-CHM-map-05.png")

~/miniconda3/lib/python3.7/site-packages/xarray/plot/plot.py in __call__(self, **kwargs)
    463
    464     def __call__(self, **kwargs):
--> 465         return plot(self._da, **kwargs)
    466
    467     @functools.wraps(hist)

~/miniconda3/lib/python3.7/site-packages/xarray/plot/plot.py in plot(darray, row, col, col_wrap, ax, hue, rtol, subplot_kws, **kwargs)
    200     kwargs["ax"] = ax
    201
--> 202     return plotfunc(darray, **kwargs)
    203
    204

~/miniconda3/lib/python3.7/site-packages/xarray/plot/plot.py in newplotfunc(darray, x, y, figsize, size, aspect, ax, row, col, col_wrap, xincrease, yincrease, add_colorbar, add_labels, vmin, vmax, cmap, center, robust, extend, levels, infer_intervals, colors, subplot_kws, cbar_ax, cbar_kwargs, xscale, yscale, xticks, yticks, xlim, ylim, norm, **kwargs)
    695
    696         # Replace pd.Intervals if contained in xval or yval.
--> 697         xplt, xlab_extra = _resolve_intervals_2dplot(xval, plotfunc.__name__)
    698         yplt, ylab_extra = _resolve_intervals_2dplot(yval, plotfunc.__name__)
    699

~/miniconda3/lib/python3.7/site-packages/xarray/plot/utils.py in _resolve_intervals_2dplot(val, func_name)
    463     if _valid_other_type(val, [pd.Interval]):
    464         if func_name == "pcolormesh":
--> 465             val = _interval_to_bound_points(val)
    466         else:
    467             val = _interval_to_mid_points(val)

~/miniconda3/lib/python3.7/site-packages/xarray/plot/utils.py in _interval_to_bound_points(array)
    433
    434     array_boundaries = np.array([x.left for x in array])
--> 435     array_boundaries = np.concatenate((array_boundaries, np.array([array[-1].right])))
    436
    437     return array_boundaries

IndexError: index -1 is out of bounds for axis 0 with size 0
canopy_height_SJER_xarr

<xarray.DataArray (band: 1, y: 0, x: 0)>
array([], shape=(1, 0, 0), dtype=float64)
Coordinates:
  * y            (y) float64
  * x            (x) float64
  * band         (band) int64 1
    spatial_ref  int64 0
I'd expect for reproject_match to work when reprojecting and clipping a larger array to match a smaller one. In fact this has worked for me when using the HARV DTM and DSM, not sure why it is failing here. Both DSM and DTM are already the same crs, in both the case that fails and where it works.
rioxarray --version.19
The data can be downloaded here: https://ndownloader.figshare.com/articles/2009586/versions/10
https://travis-ci.com/github/corteva/rioxarray/jobs/299942174
ImportError while loading conftest '/Users/travis/build/corteva/rioxarray/test/conftest.py'.

test/conftest.py:5: in <module>

    from rioxarray.rioxarray import UNWANTED_RIO_ATTRS

rioxarray/__init__.py:8: in <module>

    import rioxarray.rioxarray  # noqa

rioxarray/rioxarray.py:19: in <module>

    import rasterio.warp

../../../miniconda/envs/test/lib/python3.7/site-packages/rasterio/__init__.py:22: in <module>

    from rasterio._base import gdal_version

E   ImportError: dlopen(/Users/travis/miniconda/envs/test/lib/python3.7/site-packages/rasterio/_base.cpython-37m-darwin.so, 2): Library not loaded: @rpath/libwebp.7.dylib

E     Referenced from: /Users/travis/miniconda/envs/test/lib/libtiff.5.dylib

E     Reason: Incompatible library version: libtiff.5.dylib requires version 9.0.0 or later, but libwebp.7.dylib provides version 8.0.0
I'm on the most recent version of rioxarray, .18
The data file I'm using, "NEON-DS-Airborne-Remote-Sensing/HARV/DTM/HARV_dtmCrop.tif" can be downloaded here: https://ndownloader.figshare.com/articles/2009586/versions/10
DTM_UTM = xarray.open_rasterio("data/NEON-DS-Airborne-Remote-Sensing/HARV/DTM/HARV_dtmCrop.tif")

from rasterio.crs import CRS
crs = CRS.from_epsg(4326)

reprojected = DTM_UTM.rio.reproject(dst_crs=crs)
# this is a float
reprojected.rio.nodata
reprojected_path = "data/NEON-DS-Airborne-Remote-Sensing/HARV/DTM/HARV_dtmCrop_WGS84.tif"
reprojected.rio.to_raster(reprojected_path)

DTM_WGS84 = xarray.open_rasterio(reprojected_path)
DTM_WGS84.rio.nodata # this is now a string because it was saved to a raster but it should be a float or int
'-9999.0'
Is this fixable? I tried converting the nodata value to an int first before saving but the issue still came up. I see that there is also a nodatavals attribute in my dataset that actually contains a float in a tuple, so I can use that, but I'm curious if it is possible to handle the nodata value issue since I'm designing a geospatial python lesson that uses rioxarray. Thanks for the great library!
Looks like the clip function in QGIS defaults to match the extent of the masked geometry:
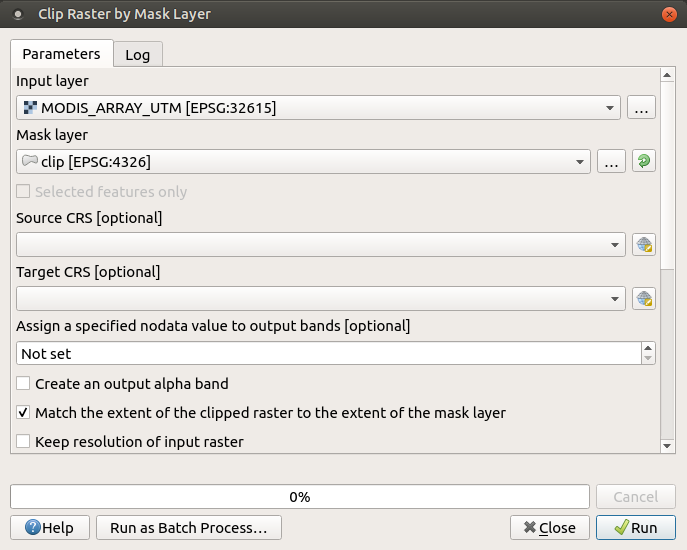
But, it also has the option to keep the original resolution of the original raster. I am thinking about adding the drop argument to the clip() function to preserve the original raster an only return a masked version.
Related to ihttps://github.com/pydata/xarray/issues/501
NotGeoreferencedWarning: Dataset has no geotransform set. The identity matrix may be returned.
  s = DatasetReader(path, driver=driver, sharing=sharing, **kwargs)
FutureWarning: The `encoding` argument to `DataArray` is deprecated, and . will be removed in 0.13. Instead, specify the encoding when writing to disk or set the `encoding` attribute directly.
  encoding=self._obj.encoding,
I used the attached NetCDF file.
>>> xds = xds.rio.set_crs("epsg:4326")
>>> xds.rio.clip(roi_gdf['geometry'][0], "epsg:4326")

---------------------------------------------------------------------------
MissingCRS                                Traceback (most recent call last)
<ipython-input-57-d9c37b3214e5> in <module>
----> 1 xds.rio.clip(roi_gdf['geometry'][0], "epsg:4326")

/opt/tljh/user/lib/python3.7/site-packages/rioxarray/rioxarray.py in clip(self, geometries, crs, all_touched, drop, invert)
   1469         for var in self.vars:
   1470             clipped_dataset[var] = self._obj[var].rio.clip(
-> 1471                 geometries, crs=crs, all_touched=all_touched, drop=drop, invert=invert
   1472             )
   1473         return clipped_dataset

/opt/tljh/user/lib/python3.7/site-packages/rioxarray/rioxarray.py in clip(self, geometries, crs, all_touched, drop, invert)
   1039         if self.crs is None:
   1040             raise MissingCRS(
-> 1041                 "CRS not found. Please set the CRS with 'set_crs()' or 'write_crs()'."
   1042             )
   1043         dst_crs = CRS.from_user_input(crs_to_wkt(crs))

MissingCRS: CRS not found. Please set the CRS with 'set_crs()' or 'write_crs()'.

>> xds = xds.rio.set_spatial_dims('lat', 'lon', inplace=False)

>> xds = xds.rio.write_crs("epsg:4326")

>>> xds.rio.clip(roi_gdf['geometry'][0], "epsg:4326")
---------------------------------------------------------------------------
DimensionError                            Traceback (most recent call last)
<ipython-input-61-d9c37b3214e5> in <module>
----> 1 xds.rio.clip(roi_gdf['geometry'][0], "epsg:4326")

/opt/tljh/user/lib/python3.7/site-packages/rioxarray/rioxarray.py in clip(self, geometries, crs, all_touched, drop, invert)
   1469         for var in self.vars:
   1470             clipped_dataset[var] = self._obj[var].rio.clip(
-> 1471                 geometries, crs=crs, all_touched=all_touched, drop=drop, invert=invert
   1472             )
   1473         return clipped_dataset

/opt/tljh/user/lib/python3.7/site-packages/rioxarray/rioxarray.py in clip(self, geometries, crs, all_touched, drop, invert)
   1050         clip_mask_arr = geometry_mask(
   1051             geometries=geometries,
-> 1052             out_shape=(int(self.height), int(self.width)),
   1053             transform=self.transform(),
   1054             invert=not invert,

/opt/tljh/user/lib/python3.7/site-packages/rioxarray/rioxarray.py in height(self)
    515         if self._height is not None:
    516             return self._height
--> 517         self._height = self._obj[self.y_dim].size
    518         return self._height
    519

/opt/tljh/user/lib/python3.7/site-packages/rioxarray/rioxarray.py in y_dim(self)
    499             return self._y_dim
    500         raise DimensionError(
--> 501             "x dimension not found. 'set_spatial_dims()' can address this."
    502         )
    503

DimensionError: x dimension not found. 'set_spatial_dims()' can address this.I'm trying to clip a MultiPolygon of a netCDF file but rioxarray cannot find the necessary crs information.
Until this point I had been only using xds.sel.
I've attached the netCDF file, and the multipolygon's geojson.
test.nc.zip
region_test.geojson.zip
Ubuntu 18.04.3 and MacOS 10.15.3
Almost all packages are freshly installed through Conda
A clipped version of the netCDF file
rioxarray --versionNodata from xarray.open_rasterio is always NaN. This is problematic with integer data (writing to_raster) or for clarity purposes.
merge_arrays errors when I give it 5 arrays of the same shape that have different distributions of nan values. I'd like to merge these arrays together to fill the nan values using the default "first" method.
merge.merge_arrays(xarrs[0])---------------------------------------------------------------------------
ValueError Traceback (most recent call last)
<ipython-input-14-b3a3e4fb1782> in <module>
----> 1 merge.merge_arrays(xarrs[0])
~/miniconda3/envs/geo/lib/python3.6/site-packages/rioxarray/merge.py in merge_arrays(dataarrays, bounds, res, nodata, precision, method, parse_coordinates)
111 merged_data, merged_transform = _rio_merge(
112 [RasterioDatasetDuck(dataarray) for dataarray in dataarrays],
--> 113 **{key: val for key, val in input_kwargs.items() if val is not None},
114 )
115 merged_shape = merged_data.shape
~/miniconda3/envs/geo/lib/python3.6/site-packages/rasterio/merge.py in merge(datasets, bounds, res, nodata, precision, indexes, method)
229 temp_shape = (output_count, trows, tcols)
230 temp = src.read(out_shape=temp_shape, window=src_window,
--> 231 boundless=False, masked=True, indexes=indexes)
232
233 # 5. Copy elements of temp into dest
~/miniconda3/envs/geo/lib/python3.6/site-packages/rioxarray/merge.py in read(self, window, out_shape, *args, **kwargs)
41 for iii in range(data_window.shape[0]):
42 new_data[iii] = numpy.array(
---> 43 Image.fromarray(data_window[iii]).resize((width, height))
44 )
45 data_window = new_data
~/miniconda3/envs/geo/lib/python3.6/site-packages/PIL/Image.py in fromarray(obj, mode)
2664 obj = obj.tostring()
2665
-> 2666 return frombuffer(mode, size, obj, "raw", rawmode, 0, 1)
2667
2668
~/miniconda3/envs/geo/lib/python3.6/site-packages/PIL/Image.py in frombuffer(mode, size, data, decoder_name, *args)
2607 return im
2608
-> 2609 return frombytes(mode, size, data, decoder_name, args)
2610
2611
~/miniconda3/envs/geo/lib/python3.6/site-packages/PIL/Image.py in frombytes(mode, size, data, decoder_name, *args)
2540
2541 im = new(mode, size)
-> 2542 im.frombytes(data, decoder_name, args)
2543 return im
2544
~/miniconda3/envs/geo/lib/python3.6/site-packages/PIL/Image.py in frombytes(self, data, decoder_name, *args)
823 # unpack data
824 d = _getdecoder(self.mode, decoder_name, args)
--> 825 d.setimage(self.im)
826 s = d.decode(data)
827
ValueError: tile cannot extend outside image
I'm not sure why this occurs since all of the DataArrays are the same shape.
for i in xarrs[0]:
    print(i.shape)
    print(i.rio.crs)
    print(i.dtype)
(4, 2750, 5209)
EPSG:32612
float64
(4, 2750, 5209)
EPSG:32612
float64
(4, 2750, 5209)
EPSG:32612
float64
(4, 2750, 5209)
EPSG:32612
float64
(4, 2750, 5209)
EPSG:32612
float64
They all have the same coordinates and bounds as well, since I have used reproject_match to match them to another grid.
I get a different error If I try to merge with higher precision:
merge.merge_arrays(xarrs[0], precision=30)---------------------------------------------------------------------------
ValueError Traceback (most recent call last)
<ipython-input-33-5697c4cd28e3> in <module>
----> 1 merge.merge_arrays(xarrs[0], precision=30)
~/miniconda3/envs/geo/lib/python3.6/site-packages/rioxarray/merge.py in merge_arrays(dataarrays, bounds, res, nodata, precision, method, parse_coordinates)
111 merged_data, merged_transform = _rio_merge(
112 [RasterioDatasetDuck(dataarray) for dataarray in dataarrays],
--> 113 **{key: val for key, val in input_kwargs.items() if val is not None},
114 )
115 merged_shape = merged_data.shape
~/miniconda3/envs/geo/lib/python3.6/site-packages/rasterio/merge.py in merge(datasets, bounds, res, nodata, precision, indexes, method)
229 temp_shape = (output_count, trows, tcols)
230 temp = src.read(out_shape=temp_shape, window=src_window,
--> 231 boundless=False, masked=True, indexes=indexes)
232
233 # 5. Copy elements of temp into dest
~/miniconda3/envs/geo/lib/python3.6/site-packages/rioxarray/merge.py in read(self, window, out_shape, *args, **kwargs)
41 for iii in range(data_window.shape[0]):
42 new_data[iii] = numpy.array(
---> 43 Image.fromarray(data_window[iii]).resize((width, height))
44 )
45 data_window = new_data
~/miniconda3/envs/geo/lib/python3.6/site-packages/PIL/Image.py in resize(self, size, resample, box)
1886 self.load()
1887
-> 1888 return self._new(self.im.resize(size, resample, box))
1889
1890 def rotate(
ValueError: height and width must be > 0
I would think that the output would follow rasterio's merge "first" rule and that nodata pixels in one array would be filled by pixels in another array. I'm looking for an output that is a single 4 band raster. I'm happy to provide some test data if the problem isn't immediately clear, though it might take a bit since I can't provide the data I'm currently trying to merge and I'd need to get another example. Thanks for checking this out!
rioxarray --versionI'm trying to use rioxarray.open_rasterio to create an xarray dataarray from a COG and then use hvplot to visualize it, which takes a Cartopy crs argument.
This is a bit embarrassing but I can't figure out how to obtain a crs proj or epsg code from rioxarray.open_rasterio.
If I use xarray.open_rasterio I have .crs, which gives me the proj or epsg code, but with rioxarray.open_rasterio I see spatial_ref, which contains wkt.
Example:
# from https://openaerialmap.org/
cog_url = (
    "https://oin-hotosm.s3.amazonaws.com/"
    "5d7dad0becaf880008a9bc88/0/5d7dad0becaf880008a9bc89.tif"
)
import xarray as xr
xr.open_rasterio(cog_url).crs
yields:
'+init=epsg:3857'
But rioxarray:
import rioxarray as rx
rioxarray.open_rasterio(cog_url).spatial_ref
yields:
<xarray.DataArray 'spatial_ref' ()>
array(0)
Coordinates:
    spatial_ref  int64 0
Attributes:
    spatial_ref:  PROJCS["WGS 84 / Pseudo-Mercator",GEOGCS["WGS 84",DATUM["WG...
    crs_wkt:      PROJCS["WGS 84 / Pseudo-Mercator",GEOGCS["WGS 84",DATUM["WG...
I think I'm definitely missing something here. 😕
import rioxarrayImport seems to fail on Python 3.5 with version 0.0.15.
Python 3.5 does not seem to be part of the Travics-CI suite.
>>> import rioxarray
Traceback (most recent call last):
  File "<stdin>", line 1, in <module>
  File "/home/david/.conda/envs/xclim3.5/lib/python3.5/site-packages/rioxarray/__init__.py", line 8, in <module>
    import rioxarray.rioxarray  # noqa
  File "/home/david/.conda/envs/xclim3.5/lib/python3.5/site-packages/rioxarray/rioxarray.py", line 1104
    **profile_kwargs,
                    ^
SyntaxError: invalid syntax
>>>
rioxarray --versionSome places are using recalc=True and some are not. I think it is important to be consistent on that. The reasoning for this is for the case where a user subsets the data and the transform of the window is different. One option would be to add methods for slicing data that re-calculate the transform in the attributes. But, probably need some more thought on the subject.
Also, it would be good to check for cases where transform exists in the attrs and coordinate values do not exist when re-calculating the transform for rio.transform (i.e. when reading raster with parse_coordinates=False).
~/scripts/rioxarray/rioxarray/rioxarray.py in reproject_match(self, match_data_array, resampling)
    648             dst_crs,
    649             dst_affine_width_height=(dst_affine, dst_width, dst_height),
--> 650             resampling=resampling,
    651         )
    652

~/scripts/rioxarray/rioxarray/rioxarray.py in reproject(self, dst_crs, resolution, dst_affine_width_height, resampling)
    607             name=self._obj.name,
    608             data=dst_data,
--> 609             coords=_make_coords(self._obj, dst_affine, dst_width, dst_height, dst_crs),
    610             dims=tuple(dst_dims),
    611             attrs=new_attrs,

~/scripts/rioxarray/rioxarray/rioxarray.py in _make_coords(src_data_array, dst_affine, dst_width, dst_height, dst_crs)
    175             src_data_array[coord].dims,
    176             src_data_array[coord].values,
--> 177             src_data_array[coord].attrs,
    178         )
    179     new_coords = _warp_spatial_coords(src_data_array, dst_affine, dst_width, dst_height)

~/scripts/terrain-compute/.venv/lib/python3.6/site-packages/xarray/core/variable.py in __init__(self, dims, data, attrs, encoding, fastpath)
   1622         if self.ndim != 1:
   1623             raise ValueError('%s objects must be 1-dimensional' %
-> 1624                              type(self).__name__)
   1625
   1626         # Unlike in Variable, always eagerly load values into memory

ValueError: IndexVariable objects must be 1-dimensional
This can happen when not dropping the band coordinate after open_rasterio and using squeeze for a single band raster:
import xarray
xds = xarray.open_rasterio("file.tif").squeeze()Currently only x,y and latitude,longitude are supported. But, sometime people use lat& lon etc... See: https://gis.stackexchange.com/questions/328128/extracting-data-within-geometry-shape/328320#comment535454_328320
It would be useful to allow users to define it themselves. Either set_geometry or set_xy?
Also, this would mean that the check for x,y coordinates would have to be delayed until users use a function that needs it.
Current workaround:
>>> import xarray
>>> xds = xarray.Dataset(coords={"lon": [1, 2], "lat": [3, 4]})
>>> xds
<xarray.Dataset>
Dimensions:  (lat: 2, lon: 2)
Coordinates:
  * lon      (lon) int64 1 2
  * lat      (lat) int64 3 4
Data variables:
    *empty*
>>> xds.rename({"lon": "longitude", "lat": "latitude"})
<xarray.Dataset>
Dimensions:    (latitude: 2, longitude: 2)
Coordinates:
  * longitude  (longitude) int64 1 2
  * latitude   (latitude) int64 3 4
Data variables:
*empty*Again, mostly just to highlight the feature.
It is often times useful to write a dataset to a raster. This is only possible if the data is 2D as the band dimension is taken by the different variables.
It would be nice to support metadata and writing band descriptions.
I am just curious if you ever thought about using the Affine object as the transform value rather than a tuple of the coefficients?
I'm currently working with a large set of CF-Compliant data from CORDEX and CMIP5 and attempting to integrate some of the neat features of rioxarray into a project that performs all manner of analyses on xarray-readable data.
I've followed some of the advice needed to add a projection to the netCDF4 file the code that seems to assuage the issues looks similar to:
import rioxarray
import xarray
import geojson
import rasterio.crs

nc = "/some/netcdf/tas.nc"
g = list()
with open("/foo/bar/file.geojson") as gj:
    g.append(geojson.load(gj)[0]["geometry"])

ds = xarray.open_dataset(nc)
crs = 4326
crs = rasterio.crs.CRS().from_epsg(crs)
dss = ds.tas
dss = dss.rio.set_spatial_dims(x_dim="lon", y_dim="lat")
dss = dss.rio.write_crs(crs.to_dict())
clipped = dss.rio.clip(g, crs=crs, all_touched=True)
I think I'm running into an issue where although the data is not projected, the values for longitude run from 0-360 starting from Greenwich. Seeing as most climate data seems to follow the "lat_bnds" -> (-90, +90), "lon_bnds" -> (0, +360), I'm wondering whether there's anything formally within rioxarray to deal with this.
A work-around for this is to subtract 360 from all lons > 180, re-assign these new lons to the ds.lon, then use ds.sortby("lon"). This seems a bit "hacky" but seems to work for now. Is there a better way?
It will be removed in rasterio, fiona. Already dropped in pyproj.
The Windows CI builds are failing. I can reproduce this locally with a conda-forge environment.
This is a problem with the conda-forge GDAL builds. In the call to xarray.open_rasterio() in the tests the NetCDF file is being opened as HDF5, and so not including useful transform and coordinate information.
It is very similar to https://gis.stackexchange.com/questions/179132/gdal-nc-rasters-opened-as-netcdf-network-common-data-format-under-linux-an , but with conda-forge instead of OSGEO packages.
From the command line, I see the same behaviour using rio info and gdalinfo. I can work around it with gdalinfo NETCDF:MODIS_ARRAY.nc, which forces the use of the NetCDF driver. Unfortunately, specifying the driver with rasterio.open('MODIS_ARRAY.nc', driver='netCDF') doesn't work, with a not recognized as a supported file format. error.
I've also tried setting the environment variable GDAL_SKIP=HDF5 HDF5Image, but gdal and rasterio both fail to load the file at all.
It's definitely a build issue and not related to these test NetCDFs because I get the same errors with other NetCDF files.
With CPL_DEBUG=ON, gdalinfo includes in it's log when opening the file:
GDAL_netCDF: driver detected file type=5, libnetcdf detected type=3
Warning 1: NetCDF driver detected file type=5, but libnetcdf detected type=3
Find time to fix the conda-forge Windows GDAL build.
It will be missing the correct libnetcdf or environment variable. There could be an old osgeo ticket with more information about the problem being fixed in their packaging.
The osgeo4w ticket I was thinking of is https://trac.osgeo.org/osgeo4w/ticket/521 , it may or may not be the same fix for the conda-forge gdal builds.
https://github.com/opendatacube/datacube-core/blob/develop/datacube/utils/geometry/_base.py
Currently it raises an exception as it cannot initialize from it. Thinking about checking for the crs_str attribute.
In geopandas 7+ they are now using the pyproj.CRS class (https://geopandas.readthedocs.io/en/latest/projections.html). This can potentially be problematic if the user has GDAL 2 installed with pyproj wheels in this example: https://corteva.github.io/rioxarray/stable/examples/clip_geom.html
It will likely also cause issues with: https://github.com/corteva/geocube
Currently when passing in WKT2 or a pyproj.CRS or a proj string/dict with type=crs in it and you have GDAL 2 installed, rasterio will raise an error. However, this is not an issue with pyproj.CRS. It can accept anything. It just cannot be accepted by everything until GDAL 3 becomes more widely used.
So, I am thinking about using the pyproj.CRS to bridge the divide internally. The rasterio..crs.CRS will still be exposed to users since this is rioxarray and it can be accepted by pyproj.CRS just fine.
The internal logic would look like:
from pyproj import CRS
crs = CRS.from_user_input(crs_input)
if gdal_version < 3:
    wkt = crs.to_wkt("WKT1_GDAL")
else:
wkt = crs.to_wkt()From: #8
The only other helpful long term solution would be to use windowed writing like we do in trollimage to achieve better performance with dask (saving chunk by chunk), but this has its own issues we've discovered with GDAL's in-memory caching and making large output files if you don't have a lot of memory available.
ping @djhoese
https://ci.appveyor.com/project/snowman2/rioxarray/builds/30418759
pytest --cov-report term-missing --cov=rioxarray
ImportError while loading conftest 'C:\projects\rioxarray\test\conftest.py'.
test\conftest.py:5: in <module>
    from rioxarray.rioxarray import UNWANTED_RIO_ATTRS
rioxarray\__init__.py:8: in <module>
    import rioxarray.rioxarray  # noqa
rioxarray\rioxarray.py:18: in <module>
    import rasterio.warp
c:\miniconda3-x64\envs\test\lib\site-packages\rasterio\__init__.py:22: in <module>
    from rasterio._base import gdal_version
E   ImportError: DLL load failed: The specified module could not be found.
crop is probably the better name for clipping/cropping rasters.
Could be nice to support that in the interface
I'm working again with the NEON data, I have a file, terrain, in UTM that is initially the same size as another raster I would like to do raster math with later. I reproject to WGS84. When I then reproject this back to UTM, a nodata border is created. This behavior makes it difficult to to do raster math with xarrays and ideally the nodata border would be removed using something similar to this solution.
However I haven't been able to remove the nodata border since xarray doesn't support 2D boolean indexing. Is there was a better way to handle this in the reprojection stage?
The data can be accessed here: https://ndownloader.figshare.com/articles/2009586/versions/10
import os
os.chdir("..")
import xarray
import rioxarray
surface = xarray.open_rasterio("data/NEON-DS-Airborne-Remote-Sensing/HARV/DSM/HARV_dsmCrop.tif")
terrain = xarray.open_rasterio("data/NEON-DS-Airborne-Remote-Sensing/HARV/DTM/HARV_dtmCrop.tif")
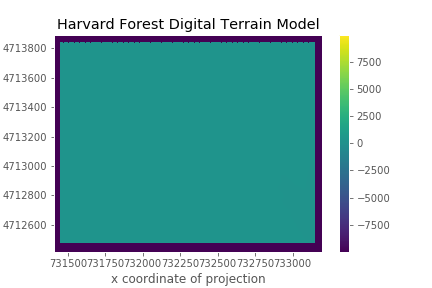
terrain.where(terrain != terrain.rio.nodata).plot()
surface.plot()
print(terrain.shape)
print(surface.shape)
from rasterio.crs import CRS
terrain_WGS84 = terrain.rio.reproject(dst_crs=CRS.from_epsg(4326))
print(terrain_WGS84.shape)
terrain_WGS84.plot()
terrain_WGS84_to_UTM = terrain_WGS84.rio.reproject(dst_crs=terrain.rio.crs)
terrain_WGS84_to_UTM.where(terrain_WGS84_to_UTM!=terrain_WGS84_to_UTM.rio.nodata).plot()
(terrain_WGS84_to_UTM.sel(band=1)==terrain_WGS84_to_UTM.rio.nodata).plot() The end result is attached
Ideally, when reprojecting back, the nodata border would not exist. Maybe this should be handled by removing all rows and all columns that are all filled with nodata, but I haven't been able to accomplish this with xarray or numpy functions operating on DataArrays (to preserve metadata). I'm able to generate a mask of all rows or columns that have all of a nodata value, but not sure where to go from there or where it is best to incorporate this in the reproject function.
import numpy as np
partial_mask = np.all(terrain_WGS84_to_UTM.sel(band=1)==terrain_WGS84_to_UTM.rio.nodata, axis=1)
rioxarray --version'0.0.18'
See: https://ci.appveyor.com/project/snowman2/rioxarray/builds/25539185
Traceback (most recent call last):
  File "C:\Miniconda3-x64\lib\site-packages\conda\exceptions.py", line 1043, in __call__
    return func(*args, **kwargs)
  File "C:\Miniconda3-x64\lib\site-packages\conda\cli\main.py", line 84, in _main
    exit_code = do_call(args, p)
  File "C:\Miniconda3-x64\lib\site-packages\conda\cli\conda_argparse.py", line 80, in do_call
    module = import_module(relative_mod, __name__.rsplit('.', 1)[0])
  File "C:\Miniconda3-x64\lib\importlib\__init__.py", line 127, in import_module
    return _bootstrap._gcd_import(name[level:], package, level)
  File "<frozen importlib._bootstrap>", line 1006, in _gcd_import
  File "<frozen importlib._bootstrap>", line 983, in _find_and_load
  File "<frozen importlib._bootstrap>", line 967, in _find_and_load_unlocked
  File "<frozen importlib._bootstrap>", line 677, in _load_unlocked
  File "<frozen importlib._bootstrap_external>", line 728, in exec_module
  File "<frozen importlib._bootstrap>", line 219, in _call_with_frames_removed
  File "C:\Miniconda3-x64\lib\site-packages\conda\cli\main_create.py", line 10, in <module>
    from .install import install
  File "C:\Miniconda3-x64\lib\site-packages\conda\cli\install.py", line 19, in <module>
    from ..core.index import calculate_channel_urls, get_index
  File "C:\Miniconda3-x64\lib\site-packages\conda\core\index.py", line 9, in <module>
    from .package_cache_data import PackageCacheData
  File "C:\Miniconda3-x64\lib\site-packages\conda\core\package_cache_data.py", line 15, in <module>
    from conda_package_handling.api import InvalidArchiveError
  File "C:\Miniconda3-x64\lib\site-packages\conda_package_handling\api.py", line 3, in <module>
    from libarchive.exception import ArchiveError as _LibarchiveArchiveError
  File "C:\Miniconda3-x64\lib\site-packages\libarchive\__init__.py", line 1, in <module>
    from .entry import ArchiveEntry
  File "C:\Miniconda3-x64\lib\site-packages\libarchive\entry.py", line 6, in <module>
    from . import ffi
  File "C:\Miniconda3-x64\lib\site-packages\libarchive\ffi.py", line 27, in <module>
    libarchive = ctypes.cdll.LoadLibrary(libarchive_path)
  File "C:\Miniconda3-x64\lib\ctypes\__init__.py", line 434, in LoadLibrary
    return self._dlltype(name)
  File "C:\Miniconda3-x64\lib\ctypes\__init__.py", line 356, in __init__
    self._handle = _dlopen(self._name, mode)
TypeError: LoadLibrary() argument 1 must be str, not None
During handling of the above exception, another exception occurred:
A declarative, efficient, and flexible JavaScript library for building user interfaces.
🖖 Vue.js is a progressive, incrementally-adoptable JavaScript framework for building UI on the web.
TypeScript is a superset of JavaScript that compiles to clean JavaScript output.
An Open Source Machine Learning Framework for Everyone
The Web framework for perfectionists with deadlines.
A PHP framework for web artisans
Bring data to life with SVG, Canvas and HTML. 📊📈🎉
JavaScript (JS) is a lightweight interpreted programming language with first-class functions.
Some thing interesting about web. New door for the world.
A server is a program made to process requests and deliver data to clients.
Machine learning is a way of modeling and interpreting data that allows a piece of software to respond intelligently.
Some thing interesting about visualization, use data art
Some thing interesting about game, make everyone happy.
We are working to build community through open source technology. NB: members must have two-factor auth.
Open source projects and samples from Microsoft.
Google ❤️ Open Source for everyone.
Alibaba Open Source for everyone
Data-Driven Documents codes.
China tencent open source team.