Giter Club home page Giter Club logo

flush-it's Introduction

Flush-It

"Flush-It" is small web map application that shows how far and where the wastewater in the Allegheny County Sanitary Authority (ALCOSAN) service area from a specific address goes before getting to the ALCOSAN treatement facility. It uses data and geoprocessing services from 3 Rivers Wet Weather.

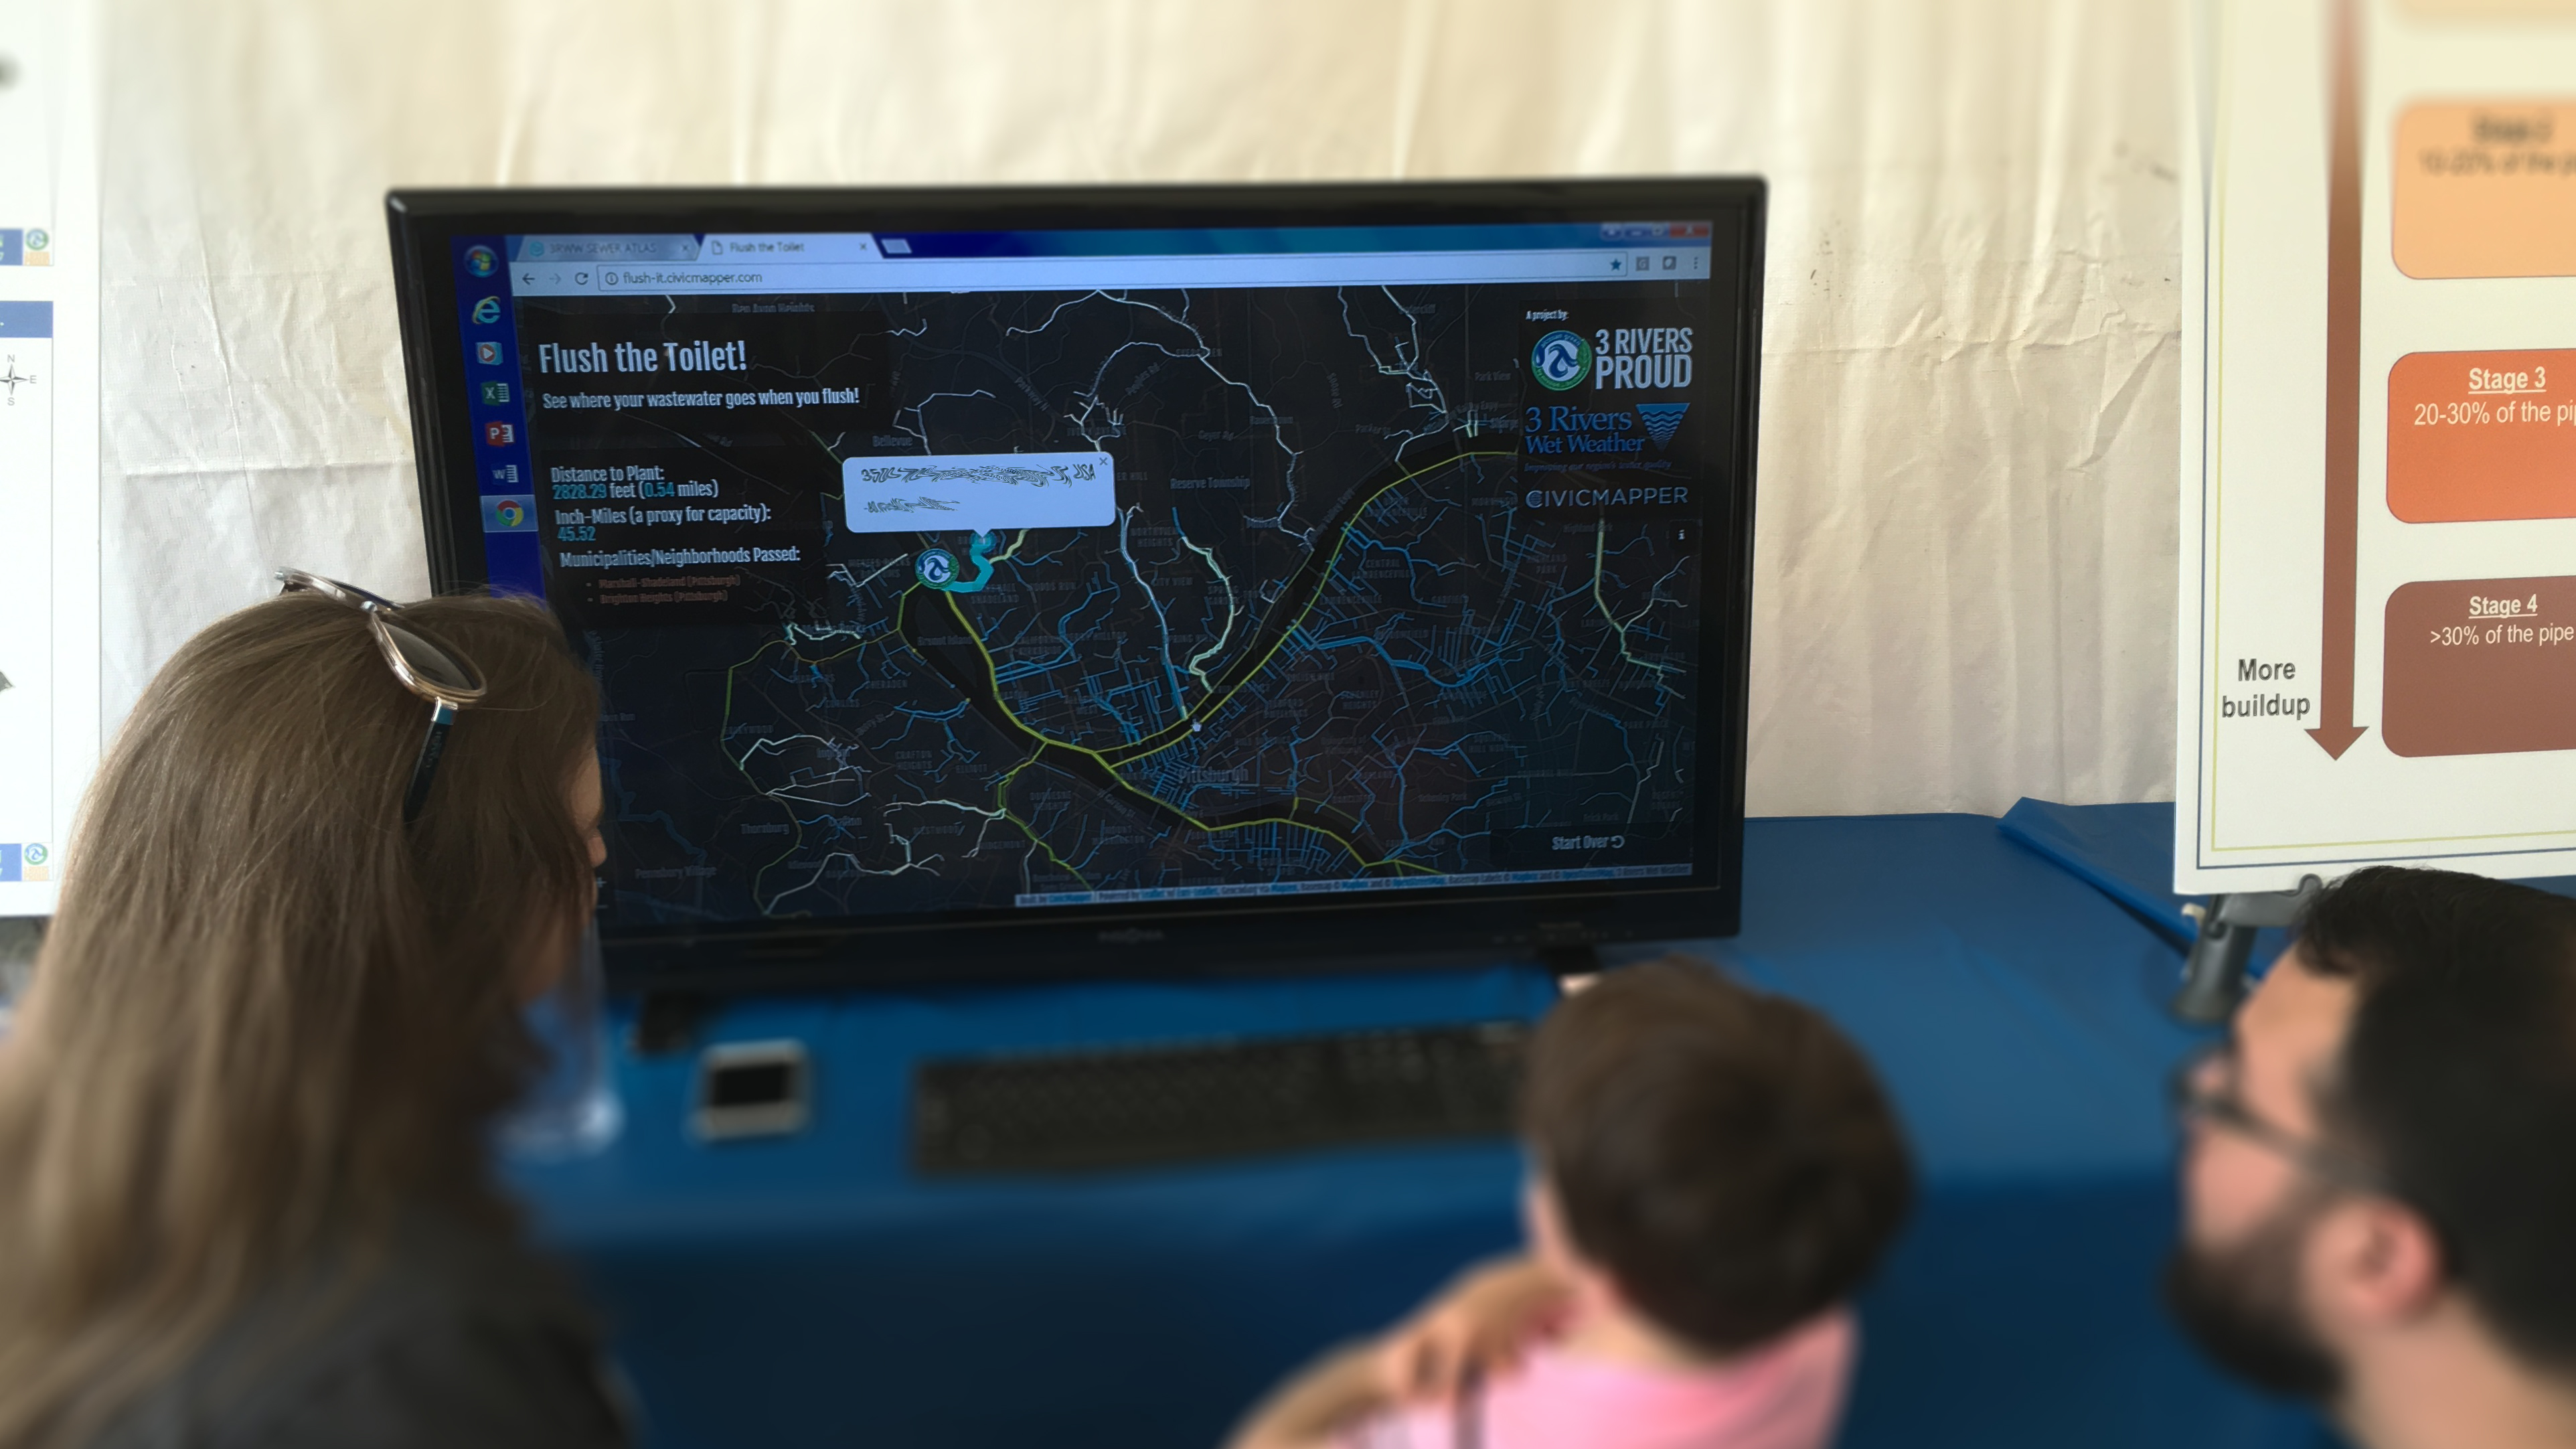
It was first built for ALCOSAN's 2017 Open House, where it was set up as an interactive demo.

Usage

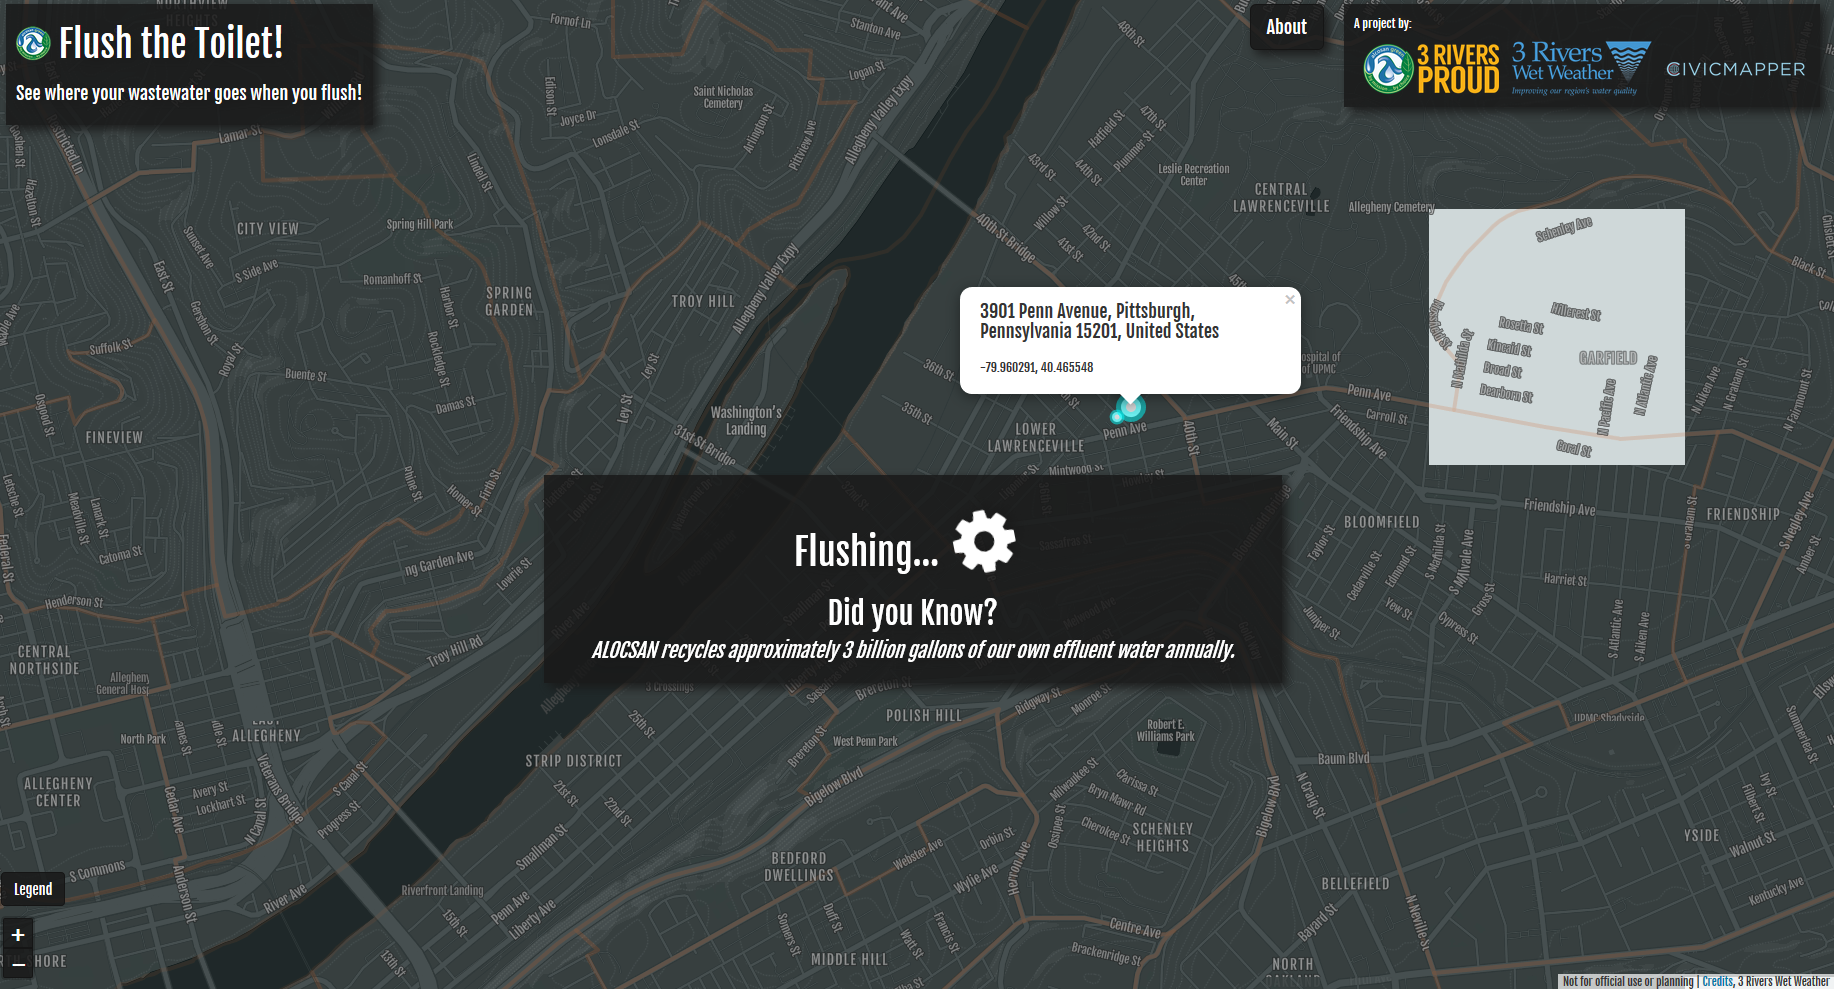
  1. Enter an address where it says "Enter an address".
  2. A dropdown will appear with matching addresses; click/tap the address for which you want to flush the toilet from.
  3. Wait a little bit.
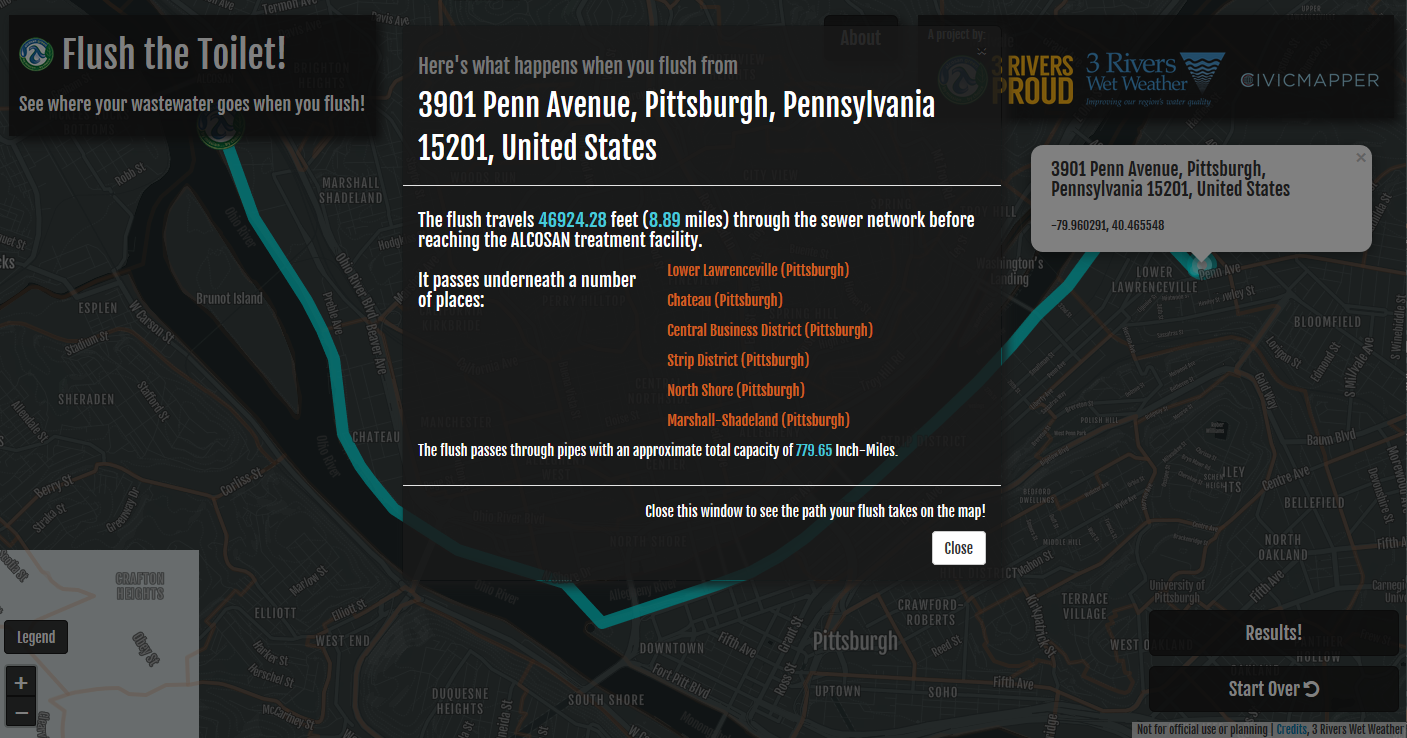
  4. The traced path and a summary of the trace (e.g., length) will appear on screen.
  5. Pan/zoom around the map to see the path of your flush.
  6. Click/tap "Start Over" to start over.

Development and Deployment

Note: this application requires access to secured web services containing multi-municipal infrastructure data, not all of which is publicly available. We don't yet have a way to offer secured access to those services to the general public. If you're interested in the software behind the site you should still be able to get the basic map running following steps below; however, the sewer network won't appear and the downstream network trace will not work.

"Flush-It" is a Python-Flask web application with a basic Twitter Bootstrap- and jQuery-supported UI. It utilizes LeafletJS and Esri-Leaflet for web mapping. The base map (not including the sewer data) comes from OpenStreetMap via Mapbox. Mapbox provides geocoding functionality. Some client-side geoprocessing is performed with Mapbox's TurfJS library.

We're using a combination of pipenv and npm for package management (for python and javascript, respectively); GulpJS is handling client-side site builds and will spin up a development environment for you.

We developed this in a Windows environment; it should also work in POSIX environments. If you want to attempt developing on this in Windows, we strongly recommend:

  • using Cmder (the full installation flavor that includes Git-for-Windows) for a shell
  • running the official Python 3 installer (to ensure Python is accessible on system the path)
  • running the official NodeJS installer (to ensure Node is accessible on the system path)

Installation

This assumes you already have working Python 3+ (w/ pip) and working NodeJS (w/ npm) installations locally, and that you have no problem running those things from the command line (see above)

In a shell in the root of the repository, run the following commands to setup the python environment.

  • pip install pipenv - we use pipenv for simplified package and virtualenv management
  • pipenv install - this will install all python dependencies spec'd in the pipfile

Then (still in the shell in the root of the repository), for client-side javascript libraries:

  • npm install - this installs all the NodeJS dependencies.

Note about NPM dependencies

(2018/03/06) Currently a bug in the way NPM's writes the package.json and package-lock.json files tends to remove one GitHub-based dependency, Leaflet-Control-Custom, from the dependency list if any other packages are installed/upgraded. The workaround for now is to re-install that dependency after any other installations/upgrades:

npm install git+https://[email protected]/ConstLhq/Leaflet.Control.Custom.git#615dc10062cdf1c5e478053d74850b74768ccc76

Python-Flask Configuration

The Python-Flask application depends on a config.py file with some important variables required by the application for authentication to secured services and other things. A config.example.py file is included with this repo containing the variables used by the application.

Running the development environment

To get a development environment running, run these commands in one console:

  • pipenv shell - this will activate the virtual environment for Python
  • then run gulp - this will run the python web app, build the client side app, listen for changes to the source code, and turn on browser synchronization w/live reload.

You'll see the site at http://127.0.0.1:3000/

Shutting down the development environment

When you're ready to stop developing, ctrl-c will shut the development server both the python-flask dev server and the Gulp watch/build/synchronization process.

In the console running pipenv shell, type exit to shut down the python virtual environment.

Deployment

Build the site with gulp build.

The site is currently being deployed to PythonAnywhere.

Python-Flask re-configuration

When deploying you'll need to add credentials for the ArcGIS Server services to the config.py file (or rewrite that to pull those things from your deployment environment - whatever you like)

In the config file, the *_CLIENT_TYPE parameters for ArcGIS Server token generation must be changed from requestip to referrer in production.

flush-it's People

Contributors

dependabot[bot] avatar fossabot avatar garrettbuyan avatar gassc avatar

Stargazers

 avatar

Watchers

 avatar  avatar  avatar

flush-it's Issues

IE 11 / TurfJS 5 compatibility

In IE11, we're get an error that kills the map at the start: Object doesn't support property or method 'fill' from a piece of code in TurfJS 5: CoordinateList.coordArrayType=new Array(0).fill(null);. We'll need to find an appropriate polyfill/shim for this and any other similar things we encounter.

ArcGIS Server token request error handling with retry

Currently, if the application can't get a token from the ArcGIS Server endpoint (on ROK Tech), we only show a message to the effect of "couldn't get the token, sorry". It doesn't attempt to retry the request.
image

Since the problem is fairly rare, a short term solution is in cfe8ef7, which advises the end-user to refresh the browser window. This almost always works.

The real solution of course is to attempt to retry acquiring that token using a randomized and exponential back-off and retry approach.

Tasks for Public Beta

  • Legend: Enable popup when hovering over the “i” or have the legend shown in the lower right hand corner. Addressed with 3c433db
  • Enable a “cool facts” or “did you know?” popup about ALCOSAN so when user zoom onto the treatment plant, fun facts show. Addressed with 73f4f62
  • Have a disclosure at the bottom stating “Not for official use or planning”. Addressed with 0102f1f
  • Enable hyperlinks or popups so users can get information as to what Inch-Miles mean and what Regionalization means (“The transferring of ownership of trunk sewers, wet weather control facilities, and related infrastructure from customer municipalities to ALCOSAN.”
  • When a user zooms to a streets view or property view, popup disclosure stating “Not actual representation of sewer lateral connection”. At Open House, we observed a few users comments, “Hey, my line ties to the sewer in the back of the house not front”etc. Sewer laterals not shown; About/FAQ content addresses this question specifically
  • Regionalization: Display the calculated length of regionalized pipe in the trace. In most cases it would be 0; however, it would entice a user to question what it means. See Issue #4
  • Calculate approximate flow rate time to plant. Enable popup/hyperlink clearly disclosing the approximation and perhaps how it is calculated. This can be complicated- might have to work with the flow model.
  • If possible, enable a flushing sound when processing calculations.

Trace Results modal action needs to close any other modals, nav

Before the Trace Results modal appears, any other open modals need to be automatically closed (the About modal) and the navigation should be collapsed (if already collapsed, which would only be the case on a mobile device). Otherwise, expect weird behavior!

Trace comparison to Regionalization Extents

Goal: Display the calculated length of regionalized pipe in the trace. In most cases it would be 0; however, it would entice a user to question what it means.

This requires modification of 3RWW's network trace service, so that, in addition to the trace result geometry, it returns a summary of pipes within the trace that are also potentially going to be regionalized. Since the regionalization data changes frequently and is being managed in a separate database, the most straightforward way to identify this will be to implement some spatial intersects on the trace results with available regionalization data.

Since that kind of analysis will require more processing time, we'll turn that functionality in the trace service off by default (we don't need that for other applications that utilize the Sewer Atlas trace service), but call it for this app.

good search after bad search fails

When searching a workable address after having searched an unworkable address (address outside of the ALCOSAN boundary), the trace fails with an undefined error message. At that point, hitting "start over" and using the workable address again, the trace proceeds normally.

This may be a matter of ensuring proper resets are hit in the the unworkable address callback.

Order of municipalities from trace

The sort order of them munis in the results pop-up reflects the basic limitation of the underlying geometric network trace function used in ArcGIS Server: it returns traced records in "database order", not in trace order. There are a couple possible solutions to this:

Option 1: On the client-side, dissolve the trace results using TurfJS in a single line (as best as possible). Traverse vertices of that line top-to-bottom to get intersecting municipalities. (We have some of this code implemented currently).

Option 2: Do the same as Option 1, but on the server side withing the geoprocessing tool. Less work for the client.

Option 3: When publishing the version of the sewer network used for tracing, add a "stream order"-like attribute that can used either in the server-side geoprocessing tool to re-order trace results, or in the client-side trace post-processing steps to get the pipe's position in the network.

Trace from landmarks

Not all viewers of this site might be from the area or have an address in mind.

The geocoder supports searching by place names, e.g., PNC Park, Cathedral of Learning, Pittsburgh Zoo, etc. We can update the search bar and docs to make it clear that's an option as well.

Auto-zoom behavior on small screens

User comment:

the smaller version zooms out to full view after mapping the route. this is a bit confusing because the route is not entirely visible in the small window until you zoom in

Will investigate; not sure if this is a bug or an expectation about behavior. Either way, possible solution would be to disable zoom-to-extents behavior on small screens, using standard screen breakpoints.

Composite Sewer Atlas layer

Need a single, composite, cached version of the sewer atlas--pipes and structures--that works nicely at various scales and works with the black background of this map.

Identify CSO in trace summary

The trace returns all pipes downstream of an address, including those in Combined Sewer Areas that encounter overflow splits and go towards either the plant or the river. We can test for when that happens, and call it out with a message like this:

"Uh-oh! It looks like your sewer connection flows to a Combined Sewer Outfall (CSO)! When it rains, there is a chance that your toilet flushes go straight into the river. Learn more about the combined sewer systems in our region, why they exist, and what ALCOSAN is doing to address them and this sort of problem here.

(something like that)

...with links out to the various 3RWW and ALCOSAN web resources on the topic.

More detailed trace information

User comment:

it would be interesting to know how far the waste flows before it reaches the CSO or before it reaches the interceptor system

Recommend Projects

  • React photo React

    A declarative, efficient, and flexible JavaScript library for building user interfaces.

  • Vue.js photo Vue.js

    🖖 Vue.js is a progressive, incrementally-adoptable JavaScript framework for building UI on the web.

  • Typescript photo Typescript

    TypeScript is a superset of JavaScript that compiles to clean JavaScript output.

  • TensorFlow photo TensorFlow

    An Open Source Machine Learning Framework for Everyone

  • Django photo Django

    The Web framework for perfectionists with deadlines.

  • D3 photo D3

    Bring data to life with SVG, Canvas and HTML. 📊📈🎉

Recommend Topics

  • javascript

    JavaScript (JS) is a lightweight interpreted programming language with first-class functions.

  • web

    Some thing interesting about web. New door for the world.

  • server

    A server is a program made to process requests and deliver data to clients.

  • Machine learning

    Machine learning is a way of modeling and interpreting data that allows a piece of software to respond intelligently.

  • Game

    Some thing interesting about game, make everyone happy.

Recommend Org

  • Facebook photo Facebook

    We are working to build community through open source technology. NB: members must have two-factor auth.

  • Microsoft photo Microsoft

    Open source projects and samples from Microsoft.

  • Google photo Google

    Google ❤️ Open Source for everyone.

  • D3 photo D3

    Data-Driven Documents codes.