Giter Club home page Giter Club logo

joinery's Introduction

joinery

joinery [joi-nuh-ree]
1. In woodworking, the craft of joining together pieces of wood to produce more complex items.
2. In Java, a data analysis library for joining together pieces of data to produce insight.

Build Status Codecov Maven Central

quick start

Remember FizzBuzz (of course you do!), well imagine you have just solved the puzzle (well done!) and you have written the results to a comma-delimited file for further analysis. Now you want to know how many times are the strings Fizz, Buzz, and FizzBuzz printed out.

You could answer this question any number of ways, for example you could modify the original program, or reach for Python/pandas, or even (for the sadistic among us, you know who you are) type out a one-liner at the command prompt (probably including cut, sort, and uniq).

Well, now you have one more option. This option is especially good if you are 1) using Java already and 2) may need to integrate your solution with other Java applications in the future.

You can answer this question with joinery.

df.groupBy("value")
  .count()
  .sortBy("-number")
  .head(3)

Printing out the resulting data frame gives us the following table.

  	   value 	number
 0	Fizz    	    27
 1	Buzz    	    14
 2	FizzBuzz	     6

See FizzBuzz.java for the complete code.

next steps

Get the executable jar and try it for yourself.

$ java -jar joinery-dataframe-1.10-jar-with-dependencies.jar shell
# Joinery -- Data frames for Java, 1.10-deb702e
# OpenJDK 64-Bit Server VM, Oracle Corporation, 1.8.0_92-internal
# Rhino 1.7 release 2 2009 03 22
> df = new DataFrame()
[empty data frame]
> df.add("value")
[empty data frame]
> [10, 20, 30].forEach(function(val) {
      df.append([val])
  })
> df
        value
 0	   10
 1	   20
 2	   30

>

maven

Since version 1.10, joinery is included in the central repo. If you are upgrading from a prior version, note the new group id.

<dependency>
  <groupId>sh.joinery</groupId>
  <artifactId>joinery-dataframe</artifactId>
  <version>1.10</version>
</dependency>

utilities

joinery includes some tools to make working with data frames easier. These tools are available by running joinery.DataFrame as an application.

$ java joinery.DataFrame
usage: joinery.DataFrame [compare|plot|show|shell] [csv-file ...]

show

Show displays the tabular data of a data frame in a gui window.

$ java joinery.DataFrame show data.csv

Screenshot of show window

plot

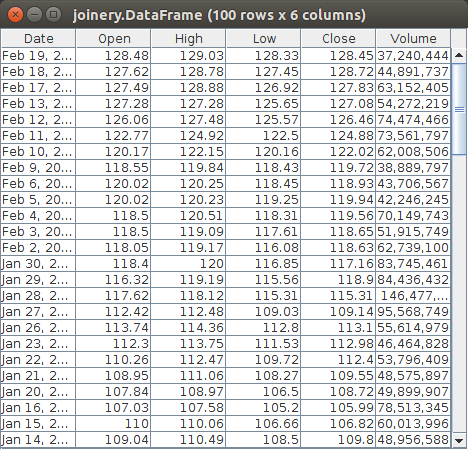
Plot displays the numeric data of a data frame as a chart.

$ java joinery.DataFrame plot data.csv

Screenshot of plot window

shell

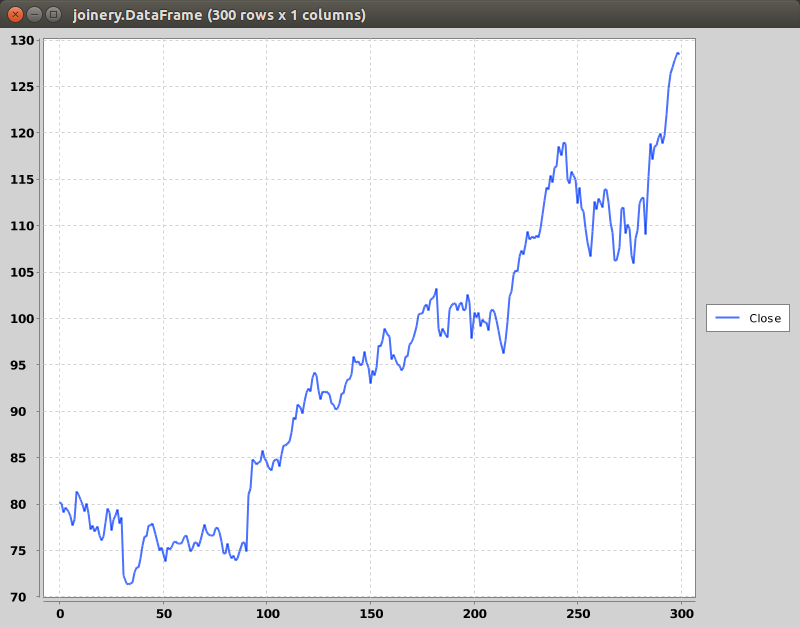
Launches an interactive JavaScript shell for working with data frames.

$ java joinery.DataFrame shell
# Joinery -- Data frames for Java, 1.10-deb702e
# OpenJDK 64-Bit Server VM, Oracle Corporation, 1.8.0_92-internal
# Rhino 1.7 release 2 2009 03 22
> df = DataFrame.readCsv("https://www.quandl.com/api/v1/datasets/GOOG/NASDAQ_AAPL.csv")
              Date	  Open	  High	   Low	        Close	             Volume
    0	2015-03-20	128.25	128.4	125.16	 125.90000000	  68695136.00000000
    1	2015-03-19	128.75	129.25	127.4	 127.50000000	  45809490.00000000
    2	2015-03-18	127.0	129.16	126.37	 128.47000000	  65270945.00000000
    3	2015-03-17	125.9	127.32	125.65	 127.04000000	  51023104.00000000
    4	2015-03-16	123.88	124.95	122.87	 124.95000000	  35874300.00000000
    5	2015-03-13	124.4	125.4	122.58	 123.59000000	  51827283.00000000
    6	2015-03-12	122.31	124.9	121.63	 124.45000000	  48362719.00000000
    7	2015-03-11	124.75	124.77	122.11	 122.24000000	  68938974.00000000
    8	2015-03-10	126.41	127.22	123.8	 124.51000000	  68856582.00000000

... 8649 rows skipped ...

 8658	1980-12-12	0.0	4.12	4.11	   4.11000000	  14657300.00000000

> df.types()
[class java.util.Date, class java.lang.String, class java.lang.String, class java.lang.String, class java.lang.Double, class java.lang.Double]
> df.sortBy("Date")
              Date     Open     High     Low            Close                Volume
 8658	1980-12-12	0.0	4.12	4.11	   4.11000000	  14657300.00000000
 8657	1980-12-15	0.0	3.91	3.89	   3.89000000	   5496400.00000000
 8656	1980-12-16	0.0	3.62	3.61	   3.61000000	   3304000.00000000
 8655	1980-12-17	0.0	3.71	3.7 	   3.70000000	   2701300.00000000
 8654	1980-12-18	0.0	3.82	3.8 	   3.80000000	   2295300.00000000
 8653	1980-12-19	0.0	4.05	4.04	   4.04000000	   1519700.00000000
 8652	1980-12-22	0.0	4.25	4.23	   4.23000000	   1167600.00000000
 8651	1980-12-23	0.0	4.43	4.41	   4.41000000	   1467200.00000000
 8650	1980-12-24	0.0	4.66	4.64	   4.64000000	   1500100.00000000

... 8649 rows skipped ...

    0	2015-03-20	128.25	128.4	125.16	 125.90000000	  68695136.00000000

> .reindex("Date")
	       Open	High	 Low	        Close	             Volume
1980-12-12	0.0	4.12	4.11	   4.11000000	  14657300.00000000
1980-12-15	0.0	3.91	3.89	   3.89000000	   5496400.00000000
1980-12-16	0.0	3.62	3.61	   3.61000000	   3304000.00000000
1980-12-17	0.0	3.71	3.7 	   3.70000000	   2701300.00000000
1980-12-18	0.0	3.82	3.8 	   3.80000000	   2295300.00000000
1980-12-19	0.0	4.05	4.04	   4.04000000	   1519700.00000000
1980-12-22	0.0	4.25	4.23	   4.23000000	   1167600.00000000
1980-12-23	0.0	4.43	4.41	   4.41000000	   1467200.00000000
1980-12-24	0.0	4.66	4.64	   4.64000000	   1500100.00000000

... 8649 rows skipped ...

2015-03-20	128.25	128.4	125.16	 125.90000000	  68695136.00000000

> .retain("Close")
	                Close
1980-12-12	   4.11000000
1980-12-15	   3.89000000
1980-12-16	   3.61000000
1980-12-17	   3.70000000
1980-12-18	   3.80000000
1980-12-19	   4.04000000
1980-12-22	   4.23000000
1980-12-23	   4.41000000
1980-12-24	   4.64000000

... 8649 rows skipped ...

2015-03-20	 125.90000000

> .plot(PlotType.AREA)

documentation

The complete api documentation for the DataFrame class is available at https://joinery.sh

joinery's People

Contributors

benmccann avatar cardillo avatar dependabot[bot] avatar lejon avatar whiletruelearn avatar

Stargazers

 avatar  avatar  avatar  avatar  avatar  avatar  avatar  avatar  avatar  avatar  avatar  avatar  avatar  avatar  avatar  avatar  avatar  avatar  avatar  avatar  avatar  avatar  avatar  avatar  avatar  avatar  avatar  avatar  avatar  avatar  avatar  avatar  avatar  avatar  avatar  avatar  avatar  avatar  avatar  avatar  avatar  avatar  avatar  avatar  avatar  avatar  avatar  avatar  avatar  avatar  avatar  avatar  avatar  avatar  avatar  avatar  avatar  avatar  avatar  avatar  avatar  avatar  avatar  avatar  avatar  avatar  avatar  avatar  avatar  avatar  avatar  avatar  avatar  avatar  avatar  avatar  avatar  avatar  avatar  avatar  avatar  avatar  avatar  avatar  avatar  avatar  avatar  avatar  avatar  avatar  avatar  avatar  avatar  avatar  avatar  avatar  avatar  avatar  avatar  avatar

Watchers

 avatar  avatar  avatar  avatar  avatar  avatar  avatar  avatar  avatar  avatar  avatar  avatar  avatar  avatar  avatar  avatar  avatar  avatar  avatar  avatar  avatar  avatar  avatar  avatar  avatar  avatar  avatar  avatar  avatar  avatar  avatar  avatar  avatar  avatar  avatar  avatar  avatar  avatar  avatar  avatar  avatar  avatar  avatar

joinery's Issues

Creating a new column based on existing columns + function

The function provided as argument would be iterated through the rows and its output would be stored in the newly created column.

I can think of many use cases but the one why I am posting is: creating mid prices from bid and ask columns for time series of prices.

Ideally the iterated function would accept the whole current row as argument. The row itself would be a Map so as to be able to access individual items using the column name, not using their position.

There is a long way to go for joinery!

Joinery misses too many useful api. For example, I cannot even set a specific type for fields from .csv file in the method of read_csv method. Joinery just reads original String type as Double and I just can do nothing about this.

better support for timeseries data

this will take some significant refactoring since currently the row and column indices are hard coded as strings (and parsing to/from datetime types is not a solution).

should the column and row indices have parameter types

after toying with this idea a bit, it isn't trivial to make the row and column indices generic, but with a little work and/or casting it could work. the biggest challenge is how to represent the type of index returned by grouping (could be any object type or a list depending on the number of columns). at this point I don't think it is worth the added complexity.

Export to CSV does not write row names

The Serialization.<V>writeCsv(final DataFrame<V> df, final OutputStream output) method doesn't write the row names if dfis a dataframe which has row names.

Extra argument apply?

Hi,

How can i add an extra argument numShares?
public void getStaticProfile(int numShares) {
this.service.getDf().apply(new Function<Object,Number>() {
public Number apply(Object value) {
BigDecimal b = new BigDecimal(value.toString());
System.out.println(b);
return b.multiply(new BigDecimal(numShares));
}
});

}

Rgds,

JJ

Support for Factors

It would be great to have factors (like in R) as type for columns. I didn't find something similar. Are there any plans in this directions?

Calculate covariance, is it posible?

Could you show me a way to calculate the covariance of this Dataframe?
0 1
0_left 29789,00000000 29657,00000000
0_right 39140,00000000 26047,00000000
0 1380349,00000000 698550,00000000

Rgds,

JJ

convert throws if column contains longs and then doubles

the initial convert implementation only checked the first row for type conversions, therefore it was possible it would detect a column as Long numeric value but later in the frame a Double would be found causing the conversion to fail. though it is rather expensive, convert shouldn't be used all that often (the most common use will be just after reading from disk) so I think it is safe to scan the entire column to test the conversion.

Coercion methods

More of a question/potential enhancement request than anything. Basically, I was just wondering what it would take to create methods to coerce existing objects into a DataFrame object? I would imagine 2d Arrays would be fairly easy to handle (although I could be completely wrong). My hope was that as I get some other work wrapped up on some readers/parsers for Stata formatted files (as well as others in the future) it'd be possible to build the classes/methods around an idea of being able to coerce the data into a DataFrame (then there'd be the advantage of joins/unions of files from different statistical software platforms). Also, I haven't looked too much into the documentation yet, but if there is a way to retain any metadata with the file that would be helpful as well (e.g., variable labels (distinct from column names), value labels (e.g., analogous to descriptions in a look up table in a SQL database), etc...).

Add ability to plot to user provided component

This isn't an issue (sorry), just wanted to say thanks for making this. As a programmer who used pandas religiously in grad school, and now forced to program in pure Java, this is a godsend.

PS, wondering what it would take to embed the dataframe plot into an existing JFrame/JPanel? I have an existing JPanel with a JFree chart in there, and would love to swap it out with the plot that's mostly controlled by the dataframe.

javascript shell improvements

would be nice to add tab completion for objects, fix the method resolution issues (this is especially tricky since nashorn uses dynalink and rhino has an internal prioritization mechanism), add ability to source script files.

Recommend Projects

  • React photo React

    A declarative, efficient, and flexible JavaScript library for building user interfaces.

  • Vue.js photo Vue.js

    ๐Ÿ–– Vue.js is a progressive, incrementally-adoptable JavaScript framework for building UI on the web.

  • Typescript photo Typescript

    TypeScript is a superset of JavaScript that compiles to clean JavaScript output.

  • TensorFlow photo TensorFlow

    An Open Source Machine Learning Framework for Everyone

  • Django photo Django

    The Web framework for perfectionists with deadlines.

  • D3 photo D3

    Bring data to life with SVG, Canvas and HTML. ๐Ÿ“Š๐Ÿ“ˆ๐ŸŽ‰

Recommend Topics

  • javascript

    JavaScript (JS) is a lightweight interpreted programming language with first-class functions.

  • web

    Some thing interesting about web. New door for the world.

  • server

    A server is a program made to process requests and deliver data to clients.

  • Machine learning

    Machine learning is a way of modeling and interpreting data that allows a piece of software to respond intelligently.

  • Game

    Some thing interesting about game, make everyone happy.

Recommend Org

  • Facebook photo Facebook

    We are working to build community through open source technology. NB: members must have two-factor auth.

  • Microsoft photo Microsoft

    Open source projects and samples from Microsoft.

  • Google photo Google

    Google โค๏ธ Open Source for everyone.

  • D3 photo D3

    Data-Driven Documents codes.