Giter Club home page Giter Club logo

nest's Introduction

NeST

DOI

Analysis of nested hierarchical structure in spatial transcriptomic data

Please see our manuscript at https://www.nature.com/articles/s41467-023-42343-x.

Installation

For best results, or to run the rpy2 based functionality, installing in an isolated conda environment is recommended. A full installation including NeST and the provided examples can be created by following the following steps:

  1. Clone the NeST repository
  2. Navigate inside the repository in a command prompt
  3. Create the conda environment using the provided environment file: conda env create environment.yml
  4. Activate the conda environment: conda activate nest
  5. Install the NeST package locally: pip install .
  6. To run examples, navigate inside the examples/ directory and run jupyter notebook.

NeST can also be directly installed through pip as pip install nest-analysis.

Installation may take several minutes on a typical computer. If conda takes a long time, using mamba or micromamba instead may speed up the process (https://mamba.readthedocs.io/en/latest/index.html).

A Docker container with NeST and a fully configured environment is also available at https://hub.docker.com/r/blwalker/nest, or as docker pull blwalker/nest:latest.

Usage

Here we overview the main functions available in NeST along with examples from Slideseq (Stickels et al 2021) and Seqfish (Moffitt et al 2018) datasets. See /examples for further information and full running example. Example analysis typically takes ~5-10 minutes on a typical computer, depending on dataset.

Nested Hierarchical Structure

We load the adata object through squidpy wrapped by the nest.data.get_data function, which can be used to load a variety of datasets including all used in the manuscript.

adata = nest.data.get_data(dataset)

Next we compute the single-gene hotspots representing enriched areas of individual genes, over the full transcriptome.

nest.compute_gene_hotspots(adata, verbose=True, eps=75, min_samples=5, min_size=50)

Finally, we identify areas of coexpression. The parameter threshold represents a minimum Jaccard similarity between hotspots to be connected in the hotspot similarity network, and the parameter resolution controls the Leiden algorithm clustering of the network. min_size and min_genes serve for post-processing of the resulting coexpression hotspots to filter out coexpression hotspots that are very small.

nest.coexpression_hotspots(adata, threshold=0.35, min_size=30, min_genes=8, resolution=2.0)

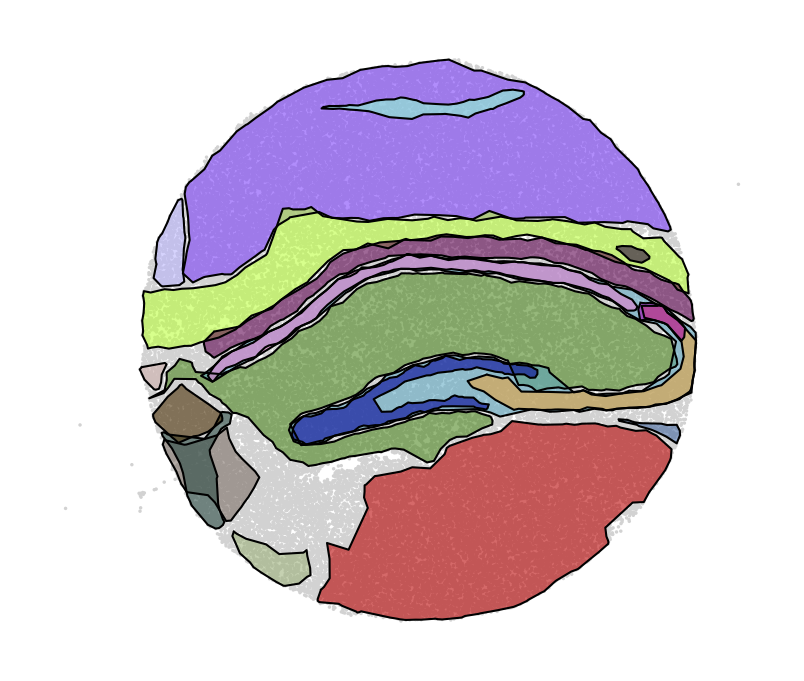
By computing boundaries (parameter alpha_max controls how tightly the boundary follows the spots. Increasing the value gives a boundary with greater curvature.)

nest.compute_multi_boundaries(adata, alpha_max=0.005, alpha_min=0.00001) nest.plot.multi_hotspots(adata)

All multi hotspots

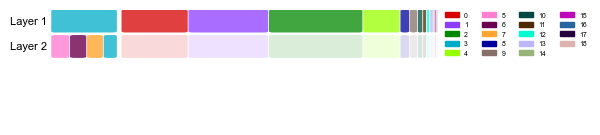
Nested structure plot allows for visualization of the nested hierarchical structure in the dataset, showing the existence of two layers (of overlapping hotspots) in the hippocampal formation, and one layer everywhere else in the dataset.

nest.plot.nested_structure_plot(adata, figsize=(5, 1.5), fontsize=8, legend_ncol=4, alpha_high=0.75, alpha_low=0.15, legend_kwargs={'loc':"upper left", 'bbox_to_anchor':(1, 1.03)})

Nested structure plot

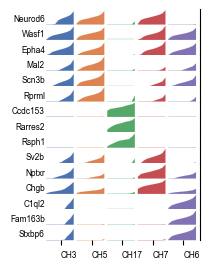
NeST is by design highly explainable as all coexpression hotspots derive directly from an ensemble of genes. We can confirm that the identified hotspots are meaningful by looking at these markers for the five coexpression hotspots representing the hippocampal formation.

markers = nest.geometric_markers(adata, [3, 5, 7, 8, 15])

markers_sub = {k: v[:3] for k, v in res.items()}

fig, ax = nest.plot.tracks_plot(adata, markers_sub, width=2.5, track_height=0.1, fontsize=6, marked_genes=[])

Tracks plot

nest's People

Contributors

bwalker1 avatar

Stargazers

Yanyu Xu avatar  avatar Jiarui Sun (孙嘉睿) avatar Sebastian Birk avatar  avatar  avatar Jasim K.B. avatar Pascal Lafrenz avatar  avatar UW_ avatar bgirma avatar Bo Zhao avatar Michael Totty avatar

Watchers

 avatar

nest's Issues

About custom dataset

Hello, it's a great work for spatial transcriptome analysis. I want to run your program on my custom dataset. How should I do? Thanks for your help.

Run the breast example

I have run the example of breast cancer, but I get a different result from step 6.Is it normal? And why is it different? I'll be appreciates if you can give an reply.

nest.coexpression_hotspots() crashes with an error

Hi,
Thank you for developing the package!

I am running into an error when trying to run nest.coexpression_hotspots(adata, threshold=0.35, min_size=30, min_genes=8, resolution=2.0):

ValueError                                Traceback (most recent call last)
File <timed exec>:2

File /zaira/miniconda3/envs/xenium/lib/python3.9/site-packages/nest/hotspot/coexpression.py:133, in coexpression_hotspots(adata, jaccard_matrix, hotspot_lookup, threshold, min_size, min_genes, cutoff, verbose, processes, divisions, use_core, core_k, resolution)
    125 tmp_df = adata.obs.merge(
    126     pd.DataFrame(multi_arrays, index=adata.obs.index),
    127     how="outer",
   (...)
    130     suffixes=("_old", None),
    131 )
    132 tmp_df.drop(tmp_df.filter(regex="_old$").columns.tolist(), axis=1, inplace=True)
--> 133 adata.obs = tmp_df
    134 new_multigene_hotspots = {
    135     str(idx): v for idx, v in enumerate(new_multigene_hotspots)
    136 }
    137 adata.uns["multi_hotspots"] = new_multigene_hotspots

File /zaira/miniconda3/envs/xenium/lib/python3.9/site-packages/anndata/_core/anndata.py:913, in AnnData.obs(self, value)
    911 @obs.setter
    912 def obs(self, value: pd.DataFrame):
--> 913     self._set_dim_df(value, "obs")

File /zaira/miniconda3/envs/xenium/lib/python3.9/site-packages/anndata/_core/anndata.py:850, in AnnData._set_dim_df(self, value, attr)
    848 if not isinstance(value, pd.DataFrame):
    849     raise ValueError(f"Can only assign pd.DataFrame to {attr}.")
--> 850 value_idx = self._prep_dim_index(value.index, attr)
    851 if self.is_view:
    852     self._init_as_actual(self.copy())

File /zaira/miniconda3/envs/xenium/lib/python3.9/site-packages/anndata/_core/anndata.py:864, in AnnData._prep_dim_index(self, value, attr)
    859 """Prepares index to be uses as obs_names or var_names for AnnData object.AssertionError
    860 
    861 If a pd.Index is passed, this will use a reference, otherwise a new index object is created.
    862 """
    863 if self.shape[attr == "var"] != len(value):
--> 864     raise ValueError(
    865         f"Length of passed value for {attr}_names is {len(value)}, but this AnnData has shape: {self.shape}"
    866     )
    867 if isinstance(value, pd.Index) and not isinstance(
    868     value.name, (str, type(None))
    869 ):
    870     raise ValueError(
    871         f"AnnData expects .{attr}.index.name to be a string or None, "
    872         f"but you passed a name of type {type(value.name).__name__!r}"
    873     )

ValueError: Length of passed value for obs_names is 3310605, but this AnnData has shape: (1041175, 273)

I believe the problem here is that the tmp_df is created by outer merging, which results in more rows than adata.obs has, hence the error. Should it be how="left" or how="inner" instead?

Thank you for your help!

Recommend Projects

  • React photo React

    A declarative, efficient, and flexible JavaScript library for building user interfaces.

  • Vue.js photo Vue.js

    🖖 Vue.js is a progressive, incrementally-adoptable JavaScript framework for building UI on the web.

  • Typescript photo Typescript

    TypeScript is a superset of JavaScript that compiles to clean JavaScript output.

  • TensorFlow photo TensorFlow

    An Open Source Machine Learning Framework for Everyone

  • Django photo Django

    The Web framework for perfectionists with deadlines.

  • D3 photo D3

    Bring data to life with SVG, Canvas and HTML. 📊📈🎉

Recommend Topics

  • javascript

    JavaScript (JS) is a lightweight interpreted programming language with first-class functions.

  • web

    Some thing interesting about web. New door for the world.

  • server

    A server is a program made to process requests and deliver data to clients.

  • Machine learning

    Machine learning is a way of modeling and interpreting data that allows a piece of software to respond intelligently.

  • Game

    Some thing interesting about game, make everyone happy.

Recommend Org

  • Facebook photo Facebook

    We are working to build community through open source technology. NB: members must have two-factor auth.

  • Microsoft photo Microsoft

    Open source projects and samples from Microsoft.

  • Google photo Google

    Google ❤️ Open Source for everyone.

  • D3 photo D3

    Data-Driven Documents codes.