Bicycle sharing systems are popular around the world. There are many services running in different countries/cities and people use these services daily because it is a clean way to travel to their destination and return the bicycle in any available station.
While people usually just take a bicycle, it is useful to plan your route in advance. These services usually offer APPs or Web Services where it is possible to check the availability of bicycles in every station in real time. However, many times, I have faced the scenario where upon arrival to the station, all the bicycles are taken and I have had to go back to the bus stop, losing time and coming away with a bad user experience.
The aim of this report is to predict the demand of bicycles in Dublin, specifically on Dublin Bike service, based on the time and some other variables described in the report. This information could be presented into the APPs or Web Services available and therefore people could plan their routes in advance, getting a better user experience from the service.
According to a study performed by "Hexa Research", the global bike rental market is expected to reach USD 4 billion by 2025. Increasing penetration, easy access, attractive pricing, and support of local authorities are among the key driving factors driving the growth of bike rental services. Leveraging of digital platforms by service providers is also expected to add to the growing adoption of rental services in the coming years. (Research, 2020)
Depending on the country/city where the service is provided, there are different business models, but the most popular one is to charge a fixed amount per year for a subscription that gives a certain amount of time to use a bicycle, then if the user exceeds that time, a small extra amount is charged to their accounts.
Included on the subscription, companies usually provide a service to their users that allows them to check the availability of bicycles in each station in real time, such as websites or mobile apps, but these services do not usually report the availability of bicycles in the future.
Based on the last premise, this report is focused on finding which algorithms of data analysis are capable of predicting the availability of bicycles per station in the future and then facilitating the addition of this new feature to the websites and mobiles apps.
What motivates me to develop this research and conduct this analysis is the fact that this is a problem that I have faced many times in my daily life. The bicycle station is a 10 minute walk from the bus stop, and while it is faster to ride a bicycle to reach my destination every day, on many occasions I have had to return to the bus stop because all the bicycles are taken on my way to the station. Therefore it would be amazing to have a system that predicts the bicycles available in the future so I can go earlier if I want to take one, or I can decide to go straightaway to the bus stop instead of losing time walking towards the bicycle station.
In this study, a dataset from Dublin Bike, a bicycle sharing system present on Dublin, is going to be used in order to perform the data analysis.
This dataset was obtained from data.smartdublin.ie and contains information about each station in Dublin during the year 2019. (Dublinbikes - data.smartdublin.ie, 2020). The dataset is also available in the folder (/datasets).
The data fields in the dataset are described as:
Number of instances: 10.741.878
Number of attributes: 11
| Label | Type | Description |
|---|---|---|
| STATION ID | numeric | Globally unique identifier of station. |
| TIME | timestamp | Time of fetching the data. |
| LAST UPDATED | timestamp | Time of last updated information. |
| NAME | text | Station name. |
| BIKE STANDS | numeric | Station total number of bikes stands. |
| AVAILABLE BIKE STANDS | numeric | Station available bike stands. |
| AVAILABLE BIKES | numeric | Station available bikes |
| STATUS | text | Station status (Open/Close). |
| ADDRESS | text | Station address. |
| LATITUDE | numeric | Station latitude. |
| LONGITUDE | numeric | Station longitude. |
Since this dataset just provides information about the bicycles, which is not enough for our prediction, a dataset with the weather information per hour during 2019 was obtained from openweathermap.org. (History Bulk weather data - OpenWeatherMap, 2020).
The dataset is also available in the folder (/datasets).
The data fields on the dataset are described as:
Number of instances: 8.955
Number of attributes: 25
| Label | Type | Description |
|---|---|---|
| dt | numeric | Time of data calculation, unix, UTC |
| dt_iso | datetime | Date and time in UTC format |
| timezone | numeric | Shift in seconds from UTC |
| city_name | text | City name |
| lat | numeric | Geographical coordinates of the location (latitude) |
| lon | numeric | Geographical coordinates of the location (longitude) |
| temp | numeric | Temperature |
| feels_like | numeric | This temperature parameter accounts for the human perception of weather |
| temp_min | numeric | Minimum temperature at the moment. |
| temp_max | numeric | Minimum temperature at the moment. |
| pressure | numeric | Atmospheric pressure (on the sea level), hPa |
| sea_level | text | Deprecated |
| grnd_level | text | Deprecated |
| humidity | numeric | Humidity, % |
| wind_speed | numeric | Wind speed. Unit Default: meter/sec |
| wind_deg | numeric | Wind direction, degrees (meteorological) |
| rain_1h | numeric | Rain volume for the last hour, mm |
| rain_3h | numeric | Rain volume for the last 3 hours, mm |
| snow_1h | numeric | Snow volume for the last hour, mm (in liquid state) |
| snow_3h | numeric | Snow volume for the last 3 hours, mm (in liquid state) |
| clouds_all | numeric | Cloudiness, % |
| weather_id | numeric | Weather condition id |
| weather_main | text | Group of weather parameters (Rain, Snow, Extreme etc.) |
| weather_description | text | Weather condition within the group |
| weather_icon | text | Weather icon id |
Data preparation and cleaning
The first step will be the preparation of the data obtained from the datasets. The first dataset obtained from "smartdublin" is separated in four files dividing the year in quarters and also contains information of every station in Dublin, but this project will be focused on the specific station St James Hospital (Luas), which is near my home. Subsequently, a new dataset file was generated using a script in python (preparation_dublin_bike.py) that is shared into the script folder of the annex. This new dataset file (filtered_dublinbikes_2019.csv) contains the information of the specific station St James Hospital for the whole year of 2019.
The next step would be to put together both datasets into one file. In order to do that the column date was split into five different columns ("year". "month", "day", "hour", "minute") for both datasets, then a new dataset file was created by matching those columns between datasets. The script used for this task is in the folder "scripts" of the annex ("join_datasets.py") and the new dataset file was generated in the folder "datasets" ("joined_dataset.csv"). The script also performed the extraction of the day of the week from the datetime and created a new column "DATE OF THE WEEK" with this data in integer format (#0: Monday ,6: Sunday).
The following step would be to clean the dataset from duplicated, useless or deprecated information, therefore columns "BIKE STANDS", "AVAILABLE BIKE STANDS", "STATION ID", "TIME", "LAST UPDATED", "NAME", "STATUS", "ADDRESS", "LATITUDE", "LONGITUDE", "YEAR", "MINUTES", "dt", "dt_iso", "timezone", "temp_min", "temp_max", "city_name", "sea_level", "grnd_level", "rain_3h", "snow_1h", "snow_3h", "weather_id", "weather_description", "weather_icon" were removed from the dataset using the script ("cleaning_dataset.py").
In the last part of the data preparation, a new attribute is to be added: how many bikes will be available in the station in the next hour. In order to fill this attribute, we will use the information available in the table for the next hour and delete the last register of the dataset which does not have any subsequent data to get information from. This task is going to be completed in the script ("cleaning_dataset.py") and it is going to generate the file "raw_final_dataset.py".
Model planning
Based on the dataset and the type of problem we are facing, we will use two different models. The first one would be multiple linear regression because it is an algorithm that is usually used to predict a variable Y from a set of variables X that are capable of explaining the value of Y. This algorithm assigns a weight to each of the variables X that is used to calculate the value to predict Y.
In this stage, a study is going to be performed, comparing the relationship between the attributes of our dataset and the bikes available. All the plots were generated by the script "model_planning_plots.py".
The comparisons were done in python and all the plots generated are available in the folder (/plots).
Here we can see tables with the results of the Pearson's correlation. (Values equal to 1 or -1 indicate a perfect positive or negative correlation, and values near to 0 indicate a very week or non-existent correlation).
Pearson's correlation
| attribute | available_bikes_1h pearson correlation |
|---|---|
| available_bikes | 0.865 |
| month | -0.135 |
| day | -0.037 |
| hour | -0.049 |
| day_of_the_week | -0.029 |
| temp | -0.128 |
| feels_like | -0.103 |
| pressure | -0.046 |
| humidity | 0.166 |
| wind_speed | -0.027 |
| wind_deg | -0.009 |
| rain_last_hour | 0.003 |
| clouds_all | 0.006 |
| weather_main | -0.024 |
Based on that table, it is clear that the there is a strong correlation between available bikes at the moment and available bikes in one hour. We can also see a weak correlation between bikes available in one hour compared to month, temperature, temperature feels like and humidity in the air. Therefore, before a data prediction is made, all the other columns with very weak or non-existent correlations are going to be removed in order to improve our prediction.
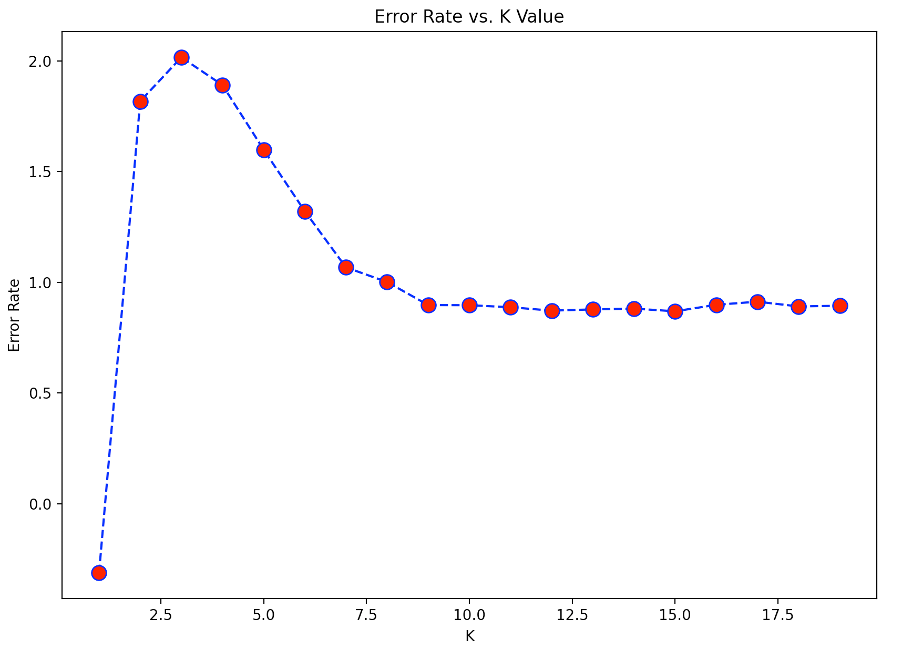
Our second model for prediction would be the K-nearest neighbors learning algorithm that, like the multiple linear regression algorithm, is based on assigning weights to certain variables so that the value of the variable to be predicted can then be calculated.
In this case, weights are assigned to the closest K neighbors depending on their distance from the sample. The smaller the distance between the sample to be calculated and any of the neighbors already calculated previously, the greater the weight of that neighbor.
Based on this plot, generated in the script ("model_building_knn.py"), we can see that the optimal K value for this analysis is around 10, because it gets a lower error rate.
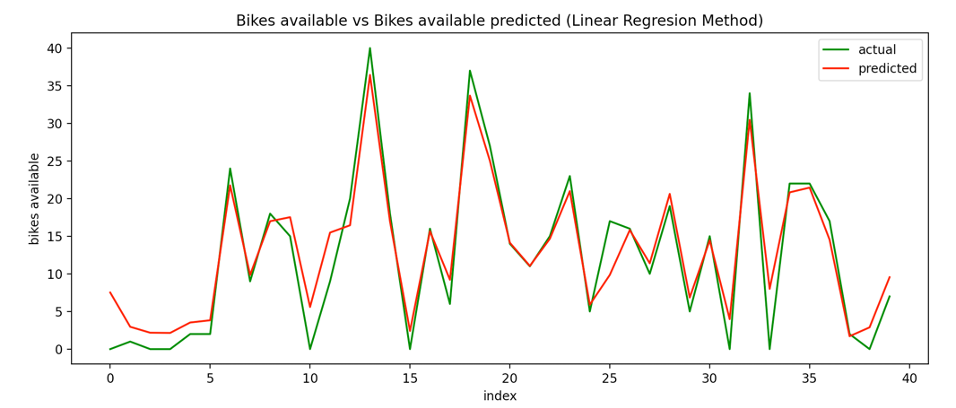
Both methods predicted the number of bikes available reasonably well. In both cases the model was trained with 80% of the information and tested with the remaining 20%.
In this first plot, we can see the result of the Linear Regression Method comparing the bikes available and the value predicted for the model in the first 40 values predicted.
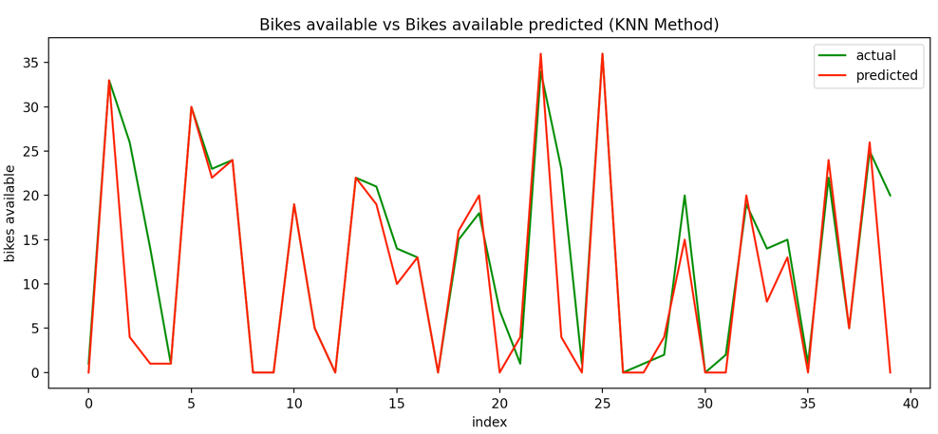
In this second plot, using the algorithm K-nearest neighbors, we can see the same comparison between bikes available and the model prediction of bikes available in the first 40 values predicted by the model.
In the following table, we can see the error comparison between both methods; Mean Absolute Error (MAE) and Root Mean Squared Error (RMSE).
| Error Type | Linear Regression | Knn |
|---|---|---|
| MAE | 3.169477 | 3.312921 |
| RMSE | 5.124050 | 5.890821 |
Both results show a similar error rate, but Linear Regression performed a little bit better than K-nearest neighbors.
In conclusion, I would say that even when the models predicted the bikes available with relatively acceptable accuracy, I realise that both models depend mainly on the numbers of bikes available at that moment. Therefore, that attribute has a Pearson's correlation of 0.865, while the rest of attributes have a Pearson's correlation of less than 0.15.
While it could mean that bicycles are equally used despite the weather conditions or the time, perhaps because the bike station is near to a hospital, I would also note that the number of bicycles put into the station by the service provider is an attribute not present in the dataset that could have changed this correlation. Usually, in order to keep up with demand, there are trucks moving bikes to the busiest stations.
With the information obtained by this report, it is also possible to predict the number of bicycles in two or more hours. While the error rate is going to increase, it would be useful information to be included in the service provider app to help customers to plan their route and improve their customer experience.
Research, H., 2020. Global Bike Rental Market To Reach USD 4.00 Billion By 2025: Hexa Research. [online] Prnewswire.com. Available at: https://www.prnewswire.com/news-releases/global-bike-rental-market-to-reach-usd-4-00-billion-by-2025-hexa-research-300816295.html [Accessed 24 July 2020].
Data.smartdublin.ie. 2020. Dublinbikes - Data.Smartdublin.Ie. [online] Available at: https://data.smartdublin.ie/dataset/dublinbikes-api [Accessed 27 July 2020].
Openweathermap.org. 2020. History Bulk Weather Data - Openweathermap. [online] Available at: https://openweathermap.org/history-bulk [Accessed 27 July 2020].
Chauhan, N., 2020. A Beginner'S Guide To Linear Regression In Python With Scikit-Learn - Kdnuggets. [online] KDnuggets. Available at: https://www.kdnuggets.com/2019/03/beginners-guide-linear-regression-python-scikit-learn.html/2 [Accessed 28 July 2020].
Stack Abuse. 2020. K-Nearest Neighbors Algorithm In Python And Scikit-Learn. [online] Available at: https://stackabuse.com/k-nearest-neighbors-algorithm-in-python-and-scikit-learn/ [Accessed 28 July 2020].
Medium. 2020. Introduction To Data Visualization In Python. [online] Available at: https://towardsdatascience.com/introduction-to-data-visualization-in-python-89a54c97fbed [Accessed 29 July 2020].
