Formatter for benchee to produce some standalone HTML with nice graphs, a data table etc. from your benchee benchmarking results :) Also allows you to export PNG images, the graphs are also somewhat explorable thanks to plotly.js!
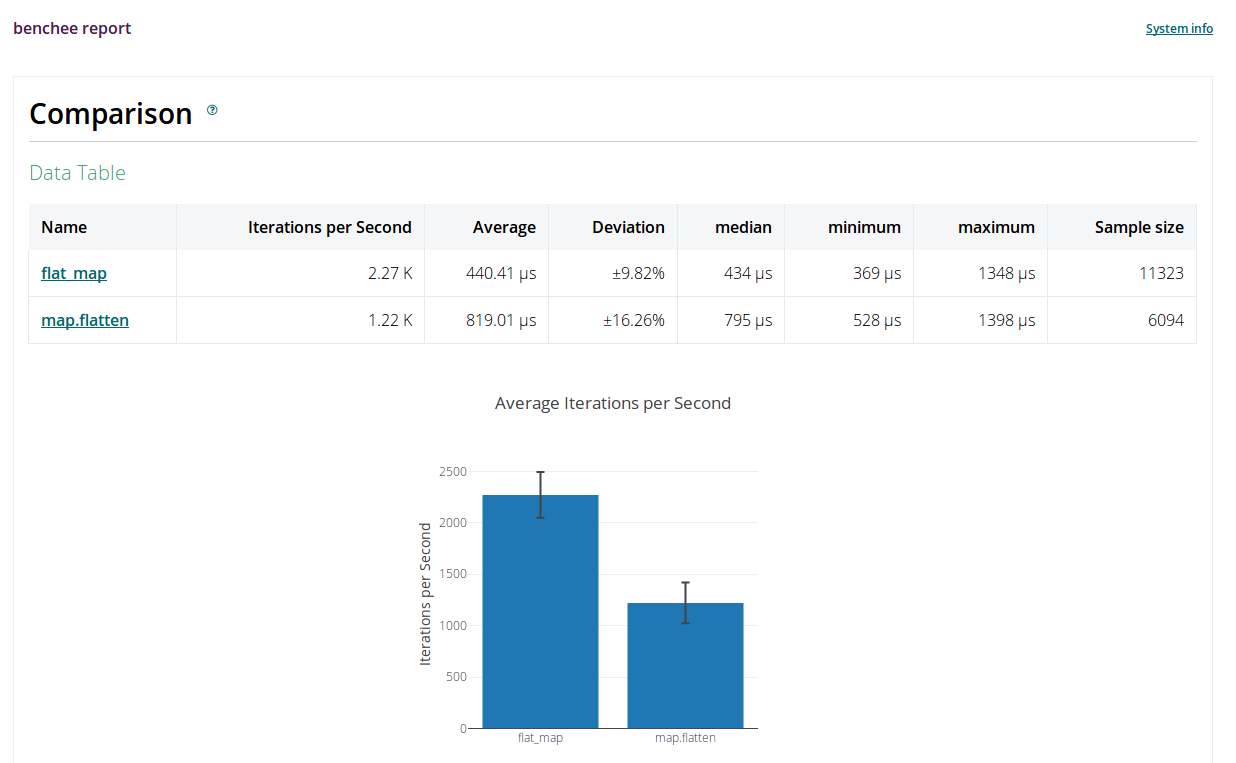
To get a taste of what this is like you can check out an online example report or look at this little screenshot:
It not only generates HTML but also assets and into the same folder. You can just take it and drop it on your server, github pages or public dropbox directory if you want it to be accessible to someone else :)
Add :benchee_html to your list of dependencies in mix.exs:
def deps do
  [
    {:benchee_html, "~> 1.0", only: :dev}
  ]
endJust use it as a formatter for benchee:
list = Enum.to_list(1..10_000)
map_fun = fn(i) -> [i, i * i] end

Benchee.run(%{
  "flat_map"    => fn -> Enum.flat_map(list, map_fun) end,
  "map.flatten" => fn -> list |> Enum.map(map_fun) |> List.flatten end
},
  formatters: [
    Benchee.Formatters.HTML,
    Benchee.Formatters.Console
  ]
  # override defaults:
  # formatters: [{Benchee.Formatters.HTML, file: "output/my.html", auto_open: false}]
)
The report index page will be written to "benchmarks/output/results.html" and opened in your standard browser automatically. Of course you can also optionally specify a tuple of {Module, options} to specify a different destination for the reports: [{Benchee.Formatters.HTML, file: "your_file.html"}]. Auto open behaviour can be overridden in the same manner: html: [{Benchee.Formatters.HTML, auto_open: false}]
Of course it also works with multiple inputs, in that case one file per input is generated:
map_fun = fn(i) -> [i, i * i] end
Benchee.run(%{
"flat_map" => fn(list) -> Enum.flat_map(list, map_fun) end,
"map.flatten" => fn(list) -> list |> Enum.map(map_fun) |> List.flatten end
},
formatters: [
{Benchee.Formatters.HTML, file: "samples_output/my.html"},
Benchee.Formatters.Console
],
time: 7,
warmup: 3,
inputs: %{
"Smaller List" => Enum.to_list(1..1_000),
"Bigger List" => Enum.to_list(1..100_000),
}
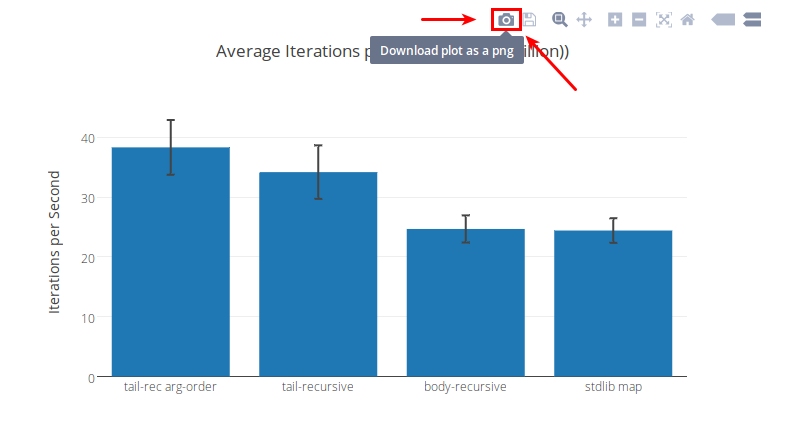
)When you hover the graphs in the HTML report, quite some plotly.js controls and links appear with which you can navigate in the graph and more.
Be aware, that currently when too many samples are recorded (> 100_000 usually) rendering might break as plotly can't handle all that data. See this issue on how to quick fix it and what could be done in the future.
When you hover the graph the controls appear and the left most of those is a camera and says "Download plot as png" - and it does what you'd expect. Refer to the image below if you need more guidance :)
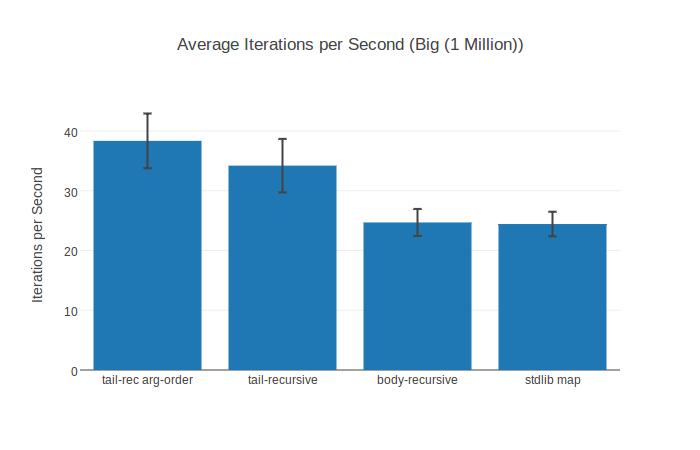
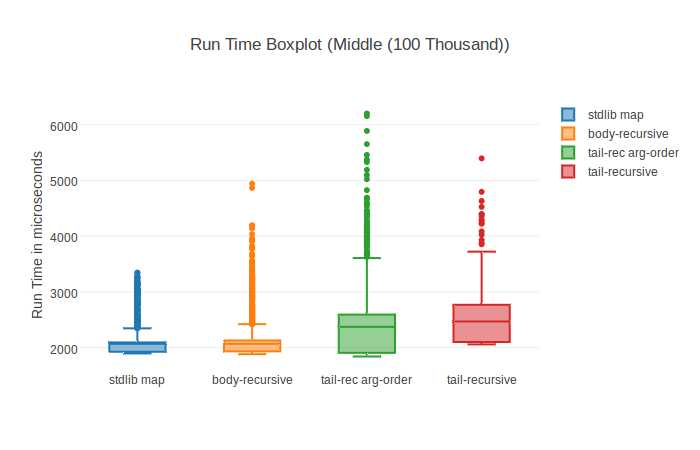
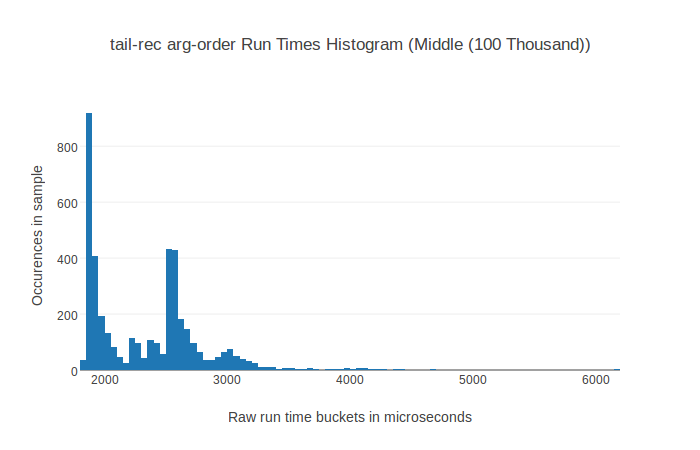
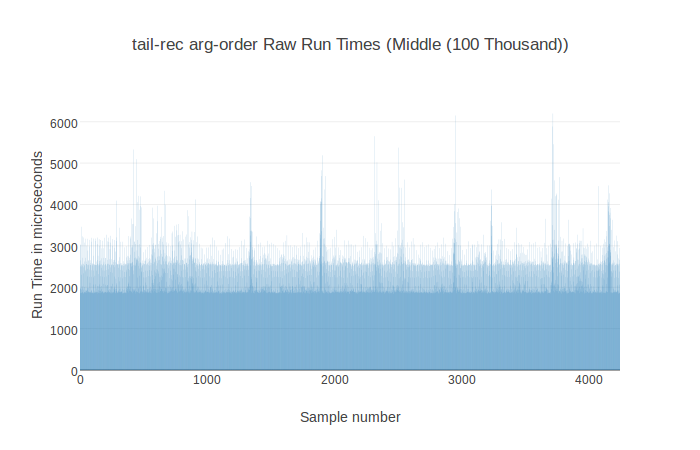
In the wiki there is a page providing an overview of the differnt chart types benchee_html produces.
For the ones that just want to scroll through, here they are once more.
Contributions to benchee_html are very welcome! Bug reports, documentation, spelling corrections, whole features, feature ideas, bugfixes, new plugins, fancy graphics... all of those (and probably more) are much appreciated contributions!
Please respect the Code of Conduct.
You can get started with a look at the open issues.
A couple of (hopefully) helpful points:
- Feel free to ask for help and guidance on an issue/PR ("How can I implement this?", "How could I test this?", ...)
- Feel free to open early/not yet complete pull requests to get some early feedback
- When in doubt if something is a good idea open an issue first to discuss it
- In case I don't respond feel free to bump the issue/PR or ping me on other places
mix deps.getto install dependenciesmix testto run testsmix credoormix credo --strictto find code style problems (not too strict with the 80 width limit for sample output in the docs)
Copyright (c) 2016 Tobias Pfeiffer
This library is released under the MIT License. See the LICENSE.md file for further details.