This repository contains source code and data for data visualizations created by Andrzej Leszkiewicz using Vega visualization grammar. The visualizations presented here can be embedded into any Power BI report using the Deneb custom visual, as well as directly into any web page or app.
Each folder in this repository usually contains one visualization example: one Vega specification file (JSON) and at least one data file (CSV or JSON). Some examples may be presented in multiple variations and therefore have more than one Vega specification file per folder.
Live visualization, generated on the fly using the files from this repository:
https://powerofbi.org/deneb-vega-data-visualization-examples/
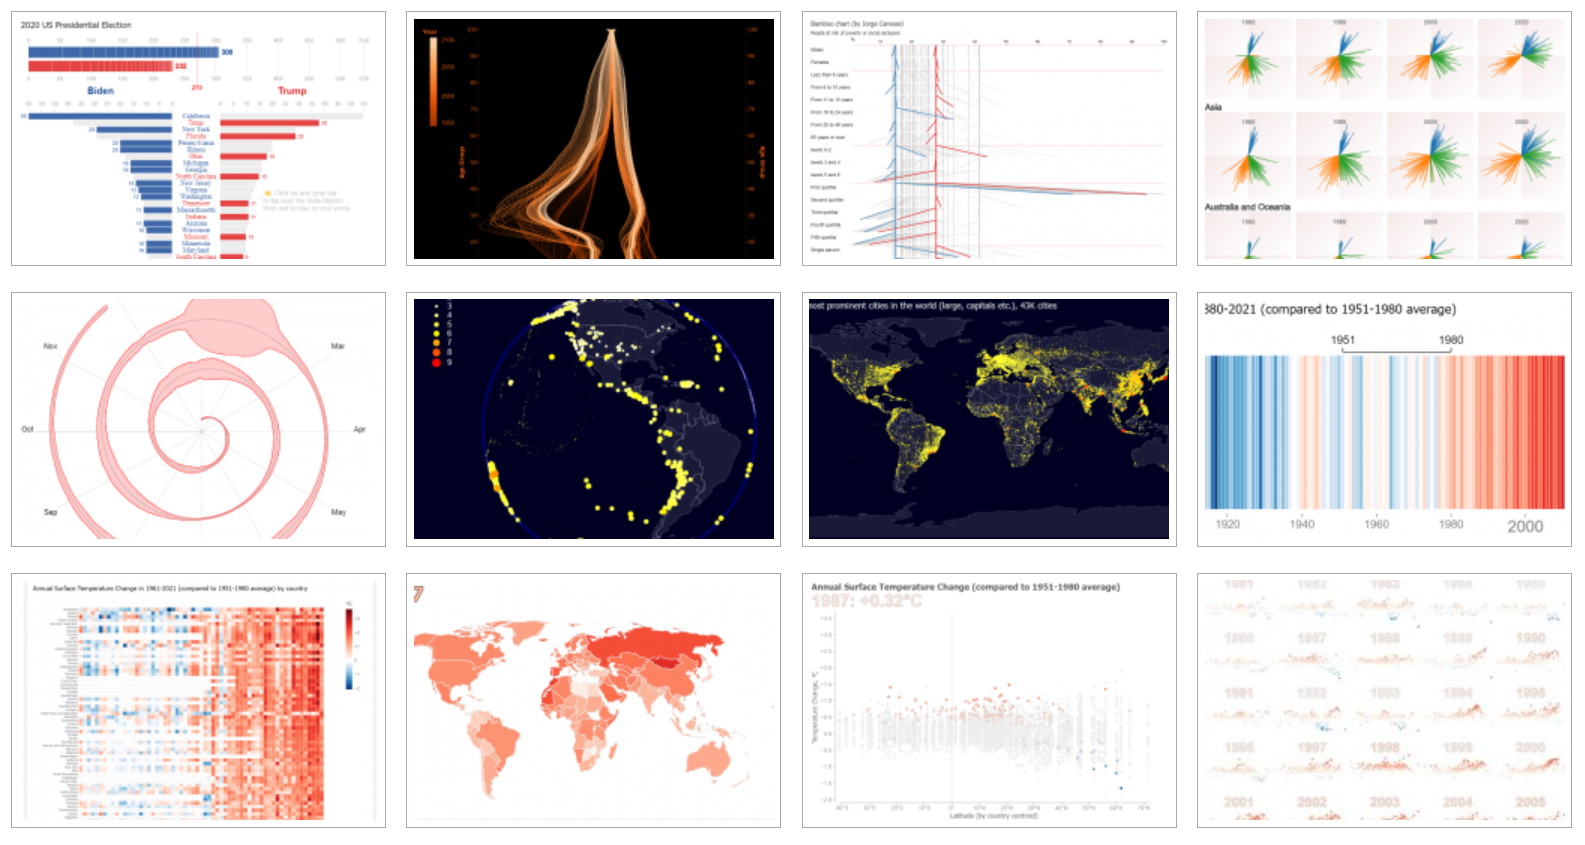
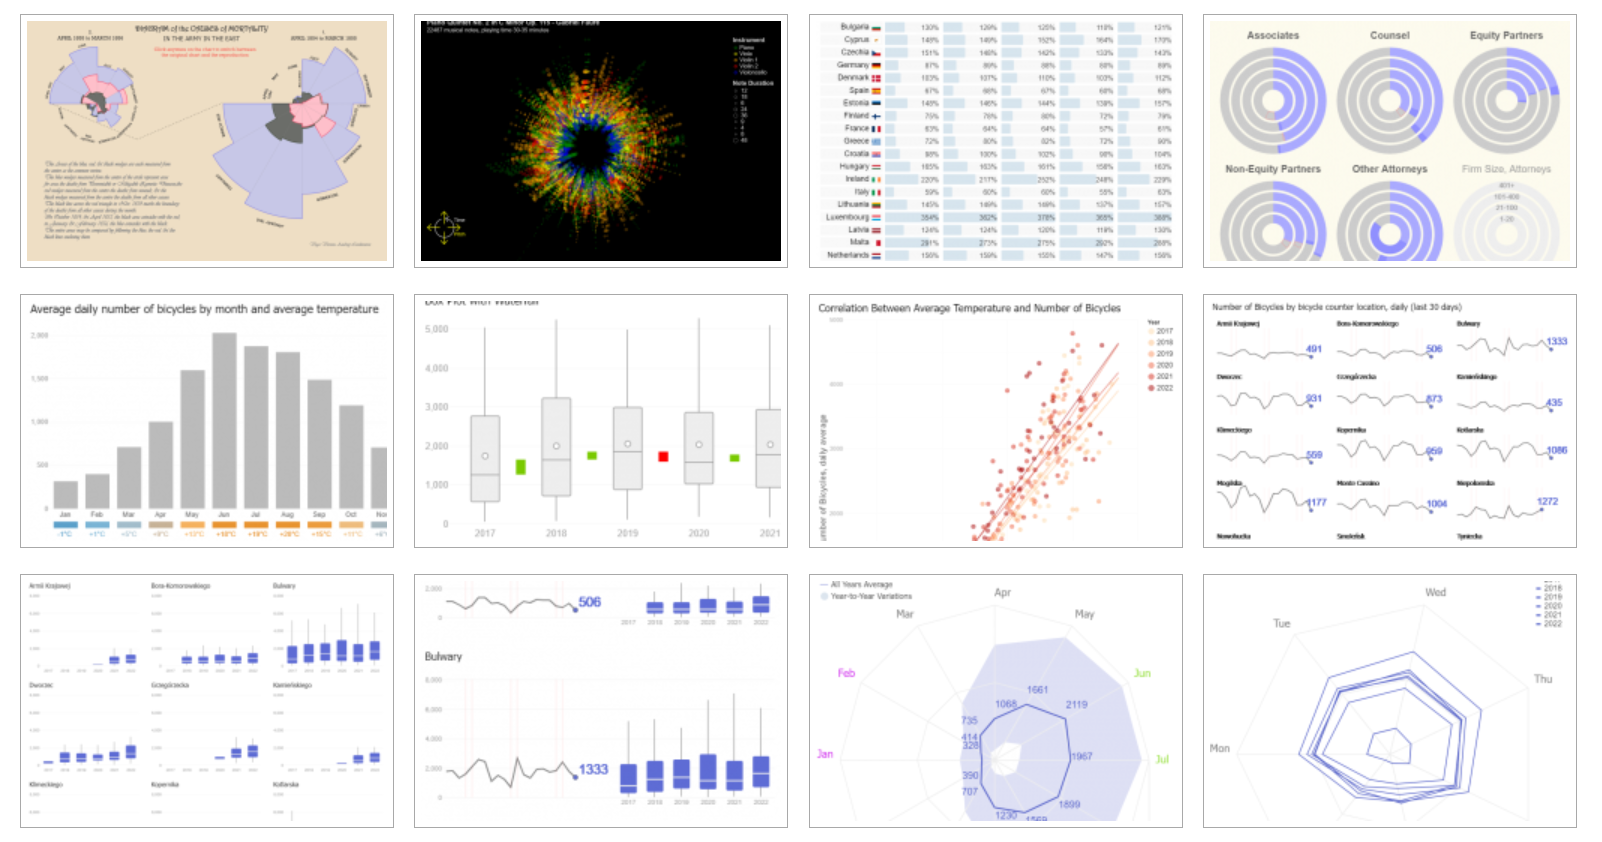
The following images are just snapshots of the visualizations. They may be outdated and incomplete.
Do you need any help with Vega visualization grammar or the Deneb custom visual for Power BI?
Create an issue at https://github.com/avatorl/Deneb-Vega-Help/ to get assistance from the author of the visualizations.
Andrzej Leszkiewicz
- Website (blog): Power of Business Intelligence
- Twitter: @avatorl
- LinkedIn: @avatorl
- YouTube: @power-of-bi
Subscribe / Follow
Deneb (custom visual for Power BI): https://deneb-viz.github.io/
Vega visualization grammar: https://vega.github.io/vega/
Data visualization templates for Deneb: https://github.com/avatorl/Deneb-Vega-Templates/.
The templates are examples of Vega data visualizations that can be used in Deneb as is or as a starting point for developing more advanced custom data visualizations.
If one of the visualizations really helped you (you have used the code for a commercial projects) or if you just want to say thank you, feel free to click the Sponsor button.
© Andrzej Leszkiewicz


