MathBox is a library for rendering presentation-quality math diagrams in a browser using WebGL. Built on top of Three.js and ShaderGraph, it provides a clean API to visualize mathematical relationships and animate them declaratively.
MathBox is used through its JS-based DOM.
For background, see the article series on Acko.net.
Demos:
- Audio Visualizer
- Cylindrical Stream
- Data/Shape Mapping
- LaTeX/HTML/GL Labels
- Quaternion Hypersphere
- Render-to-Texture History
- Vertex Warping
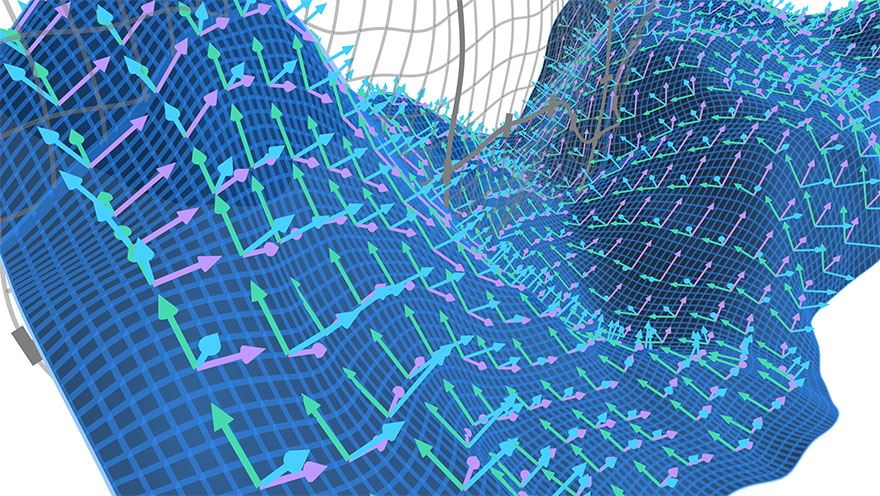
- Volumetric Vectors
Presentations:
Note: this repo uses submodules, clone it with --recursive or do a git submodule update --init after cloning.
-
via npm:
npm install mathbox
-
or CDN:
<script
  type="text/javascript"
  src="https://cdn.jsdelivr.net/npm/mathbox@latest/build/bundle/mathbox.js"
></script>
<link
  rel="stylesheet"
  href="https://cdn.jsdelivr.net/npm/mathbox@latest/build/mathbox.css"
/>
Open the included /examples to see more demos.
See:
- Quick Start for a hands on introduction.
- Glossary of terms to help get familiar with MathBox and WebGL.
- MathBox API for typical usage.
- List of Primitives for a full element reference.
- Writing Custom Shaders for info on custom shaders and GPU-side processing.
- Context API for advanced usage.
Join us in the MathBox Google Group or #mathbox on Freenode.
Construct a MathBox instance using the provided mathBox() constructor:
import { mathBox } from "mathbox";
import "mathbox/mathbox.css";

const mathbox = mathBox(options);

const three = mathbox.three;
// three.renderer, three.scene, three.camera
See threestrap for all available options. e.g. To spawn inside a specific element, do:
const element = document.querySelector("#my-thing");
const mathbox = MathBox.mathBox({ element: element });
On initialization, it returns a MathBox API object, wrapping the MathBox <root/>. You can spawn new nodes:
<cartesian
  range={[
    [-2, 2],
    [-1, 1],
    [-1, 1],
  ]}
  scale={[2, 1, 1]}
>
  <axis axis={1} />
  <axis axis={2} />
</cartesian>
via
const view = mathbox
  .cartesian({
    range: [
      [-2, 2],
      [-1, 1],
      [-1, 1],
    ],
    scale: [2, 1, 1],
  })
  .axis({
    axis: 1,
  })
  .axis({
    axis: 2,
  });
You can select objects using .select() and a CSS-like selector to get a jQuery-like selection:
mathbox.select("cartesian > axis");Use .print(), .inspect() and .debug() to show information about a selection.
- threestrap - Three.js bootstrapper
- shadergraph - Functional GLSL linker
MathBox and ShaderGraph (c) Steven Wittens 2013-2022. MIT License.
Libraries and 3rd party shaders (c) their respective authors.


