Giter Club home page Giter Club logo

xlogit's Introduction

xlogit: A Python Package for GPU-Accelerated Estimation of Mixed Logit Models.

image

Build Coverage Community Documentation Status PyPi License

Examples | Docs | Installation | API Reference | Contributing | Contact

Quick start

The following example uses xlogit to estimate a mixed logit model for choices of electricity supplier (See the data here). The parameters are:

  • X: 2-D array of input data (in long format) with choice situations as rows, and variables as columns
  • y: 1-D array of choices (in long format)
  • varnames: List of variable names that matches the number and order of the columns in X
  • alts: 1-D array of alternative indexes or an alternatives list
  • ids: 1-D array of the ids of the choice situations
  • panels: 1-D array of ids for panel formation
  • randvars: dictionary of variables and their mixing distributions ("n" normal, "ln" lognormal, "t" triangular, "u" uniform, "tn" truncated normal)

The current version of xlogit only supports input data in long format.

# Read data from CSV file
import pandas as pd
df = pd.read_csv("examples/data/electricity_long.csv")

# Fit the model with xlogit
from xlogit import MixedLogit

varnames = ['pf', 'cl', 'loc', 'wk', 'tod', 'seas']
model = MixedLogit()
model.fit(X=df[varnames],
          y=df['choice'],
          varnames=varnames,
          ids=df['chid'],
          panels=df['id'],
          alts=df['alt'],
          n_draws=600,
          randvars={'pf': 'n', 'cl': 'n', 'loc': 'n',
                    'wk': 'n', 'tod': 'n', 'seas': 'n'})
model.summary()
GPU processing enabled.
Optimization terminated successfully.
         Current function value: 3888.413414
         Iterations: 46
         Function evaluations: 51
         Gradient evaluations: 51
Estimation time= 2.6 seconds
----------------------------------------------------------------------
Coefficient         Estimate      Std.Err.         z-val         P>|z|
----------------------------------------------------------------------
pf                -0.9996286     0.0331488   -30.1557541     9.98e-100 ***
cl                -0.2355334     0.0220401   -10.6865870      1.97e-22 ***
loc                2.2307891     0.1164263    19.1605300      5.64e-56 ***
wk                 1.6251657     0.0918755    17.6887855      6.85e-50 ***
tod               -9.6067367     0.3112721   -30.8628296     2.36e-102 ***
seas              -9.7892800     0.2913063   -33.6047603     2.81e-112 ***
sd.pf              0.2357813     0.0181892    12.9627201      7.25e-31 ***
sd.cl              0.4025377     0.0220183    18.2819903      2.43e-52 ***
sd.loc             1.9262893     0.1187850    16.2166103      7.67e-44 ***
sd.wk             -1.2192931     0.0944581   -12.9083017      1.17e-30 ***
sd.tod             2.3354462     0.1741859    13.4077786      1.37e-32 ***
sd.seas           -1.4200913     0.2095869    -6.7756668       3.1e-10 ***
----------------------------------------------------------------------
Significance:  0 '***' 0.001 '**' 0.01 '*' 0.05 '.' 0.1 ' ' 1

Log-Likelihood= -3888.413
AIC= 7800.827
BIC= 7847.493

For more examples of xlogit see this Jupyter Notebook in Google Colab. Google Colab provides GPU resources for free, which will significantly speed up your model estimation using xlogit.

Quick install

Install xlogit using pip as follows:

pip install xlogit

Hint

To enable GPU processing, you must install the CuPy Python library. When xlogit detects that CuPy is properly installed, it switches to GPU processing without any additional setup. If you use Google Colab, CuPy is usually installed by default.

For additional installation details check xlogit installation instructions at: https://xlogit.readthedocs.io/en/latest/install.html

No GPU? No problem

xlogit can also be used without a GPU. However, if you need to speed up your model estimation, there are several low cost and even free options to access cloud GPU resources. For instance:

  • Google Colab offers free GPU resources with no setup required, as the service can be accessed using a web browser. Using xlogit in Google Colab is very easy as it runs out of the box without having to to install CUDA or CuPy, which are installed by default. For examples of xlogit running in Google Colab see this link.
  • Amazon Sagemaker Studio Lab offers Python runtime environments with free GPUs.
  • Google Cloud platform offers GPU processing at less than $1 USD per hour for NVIDIA Tesla K80 GPU with 4,992 CUDA cores.
  • Amazon Sagemaker offers virtual machine instances with the same TESLA K80 GPU at a similar price range of less than $1 USD per hour.

Benchmark

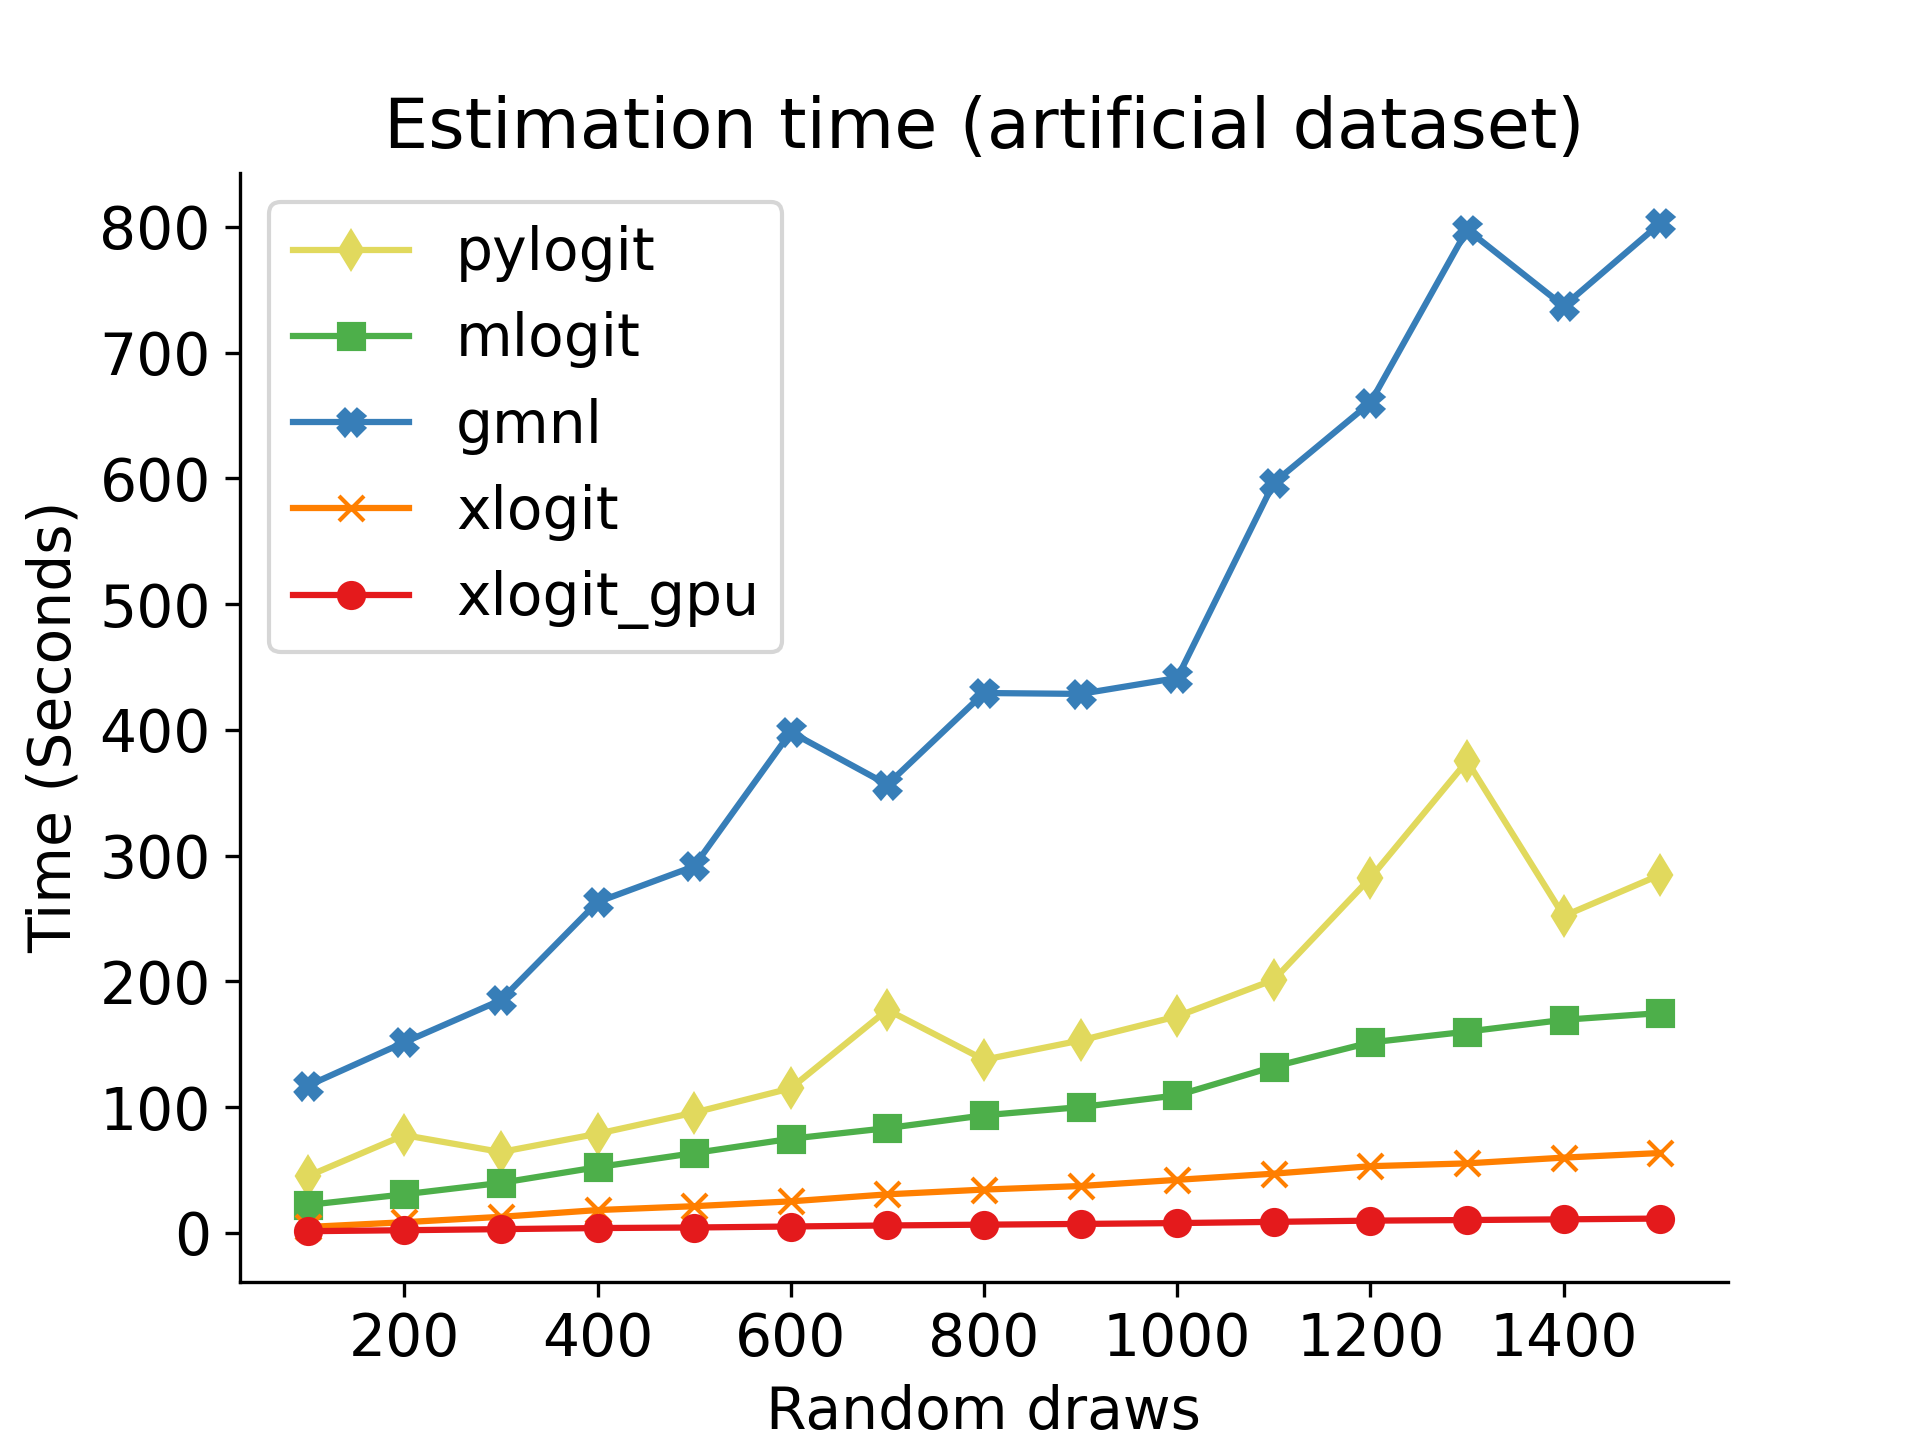
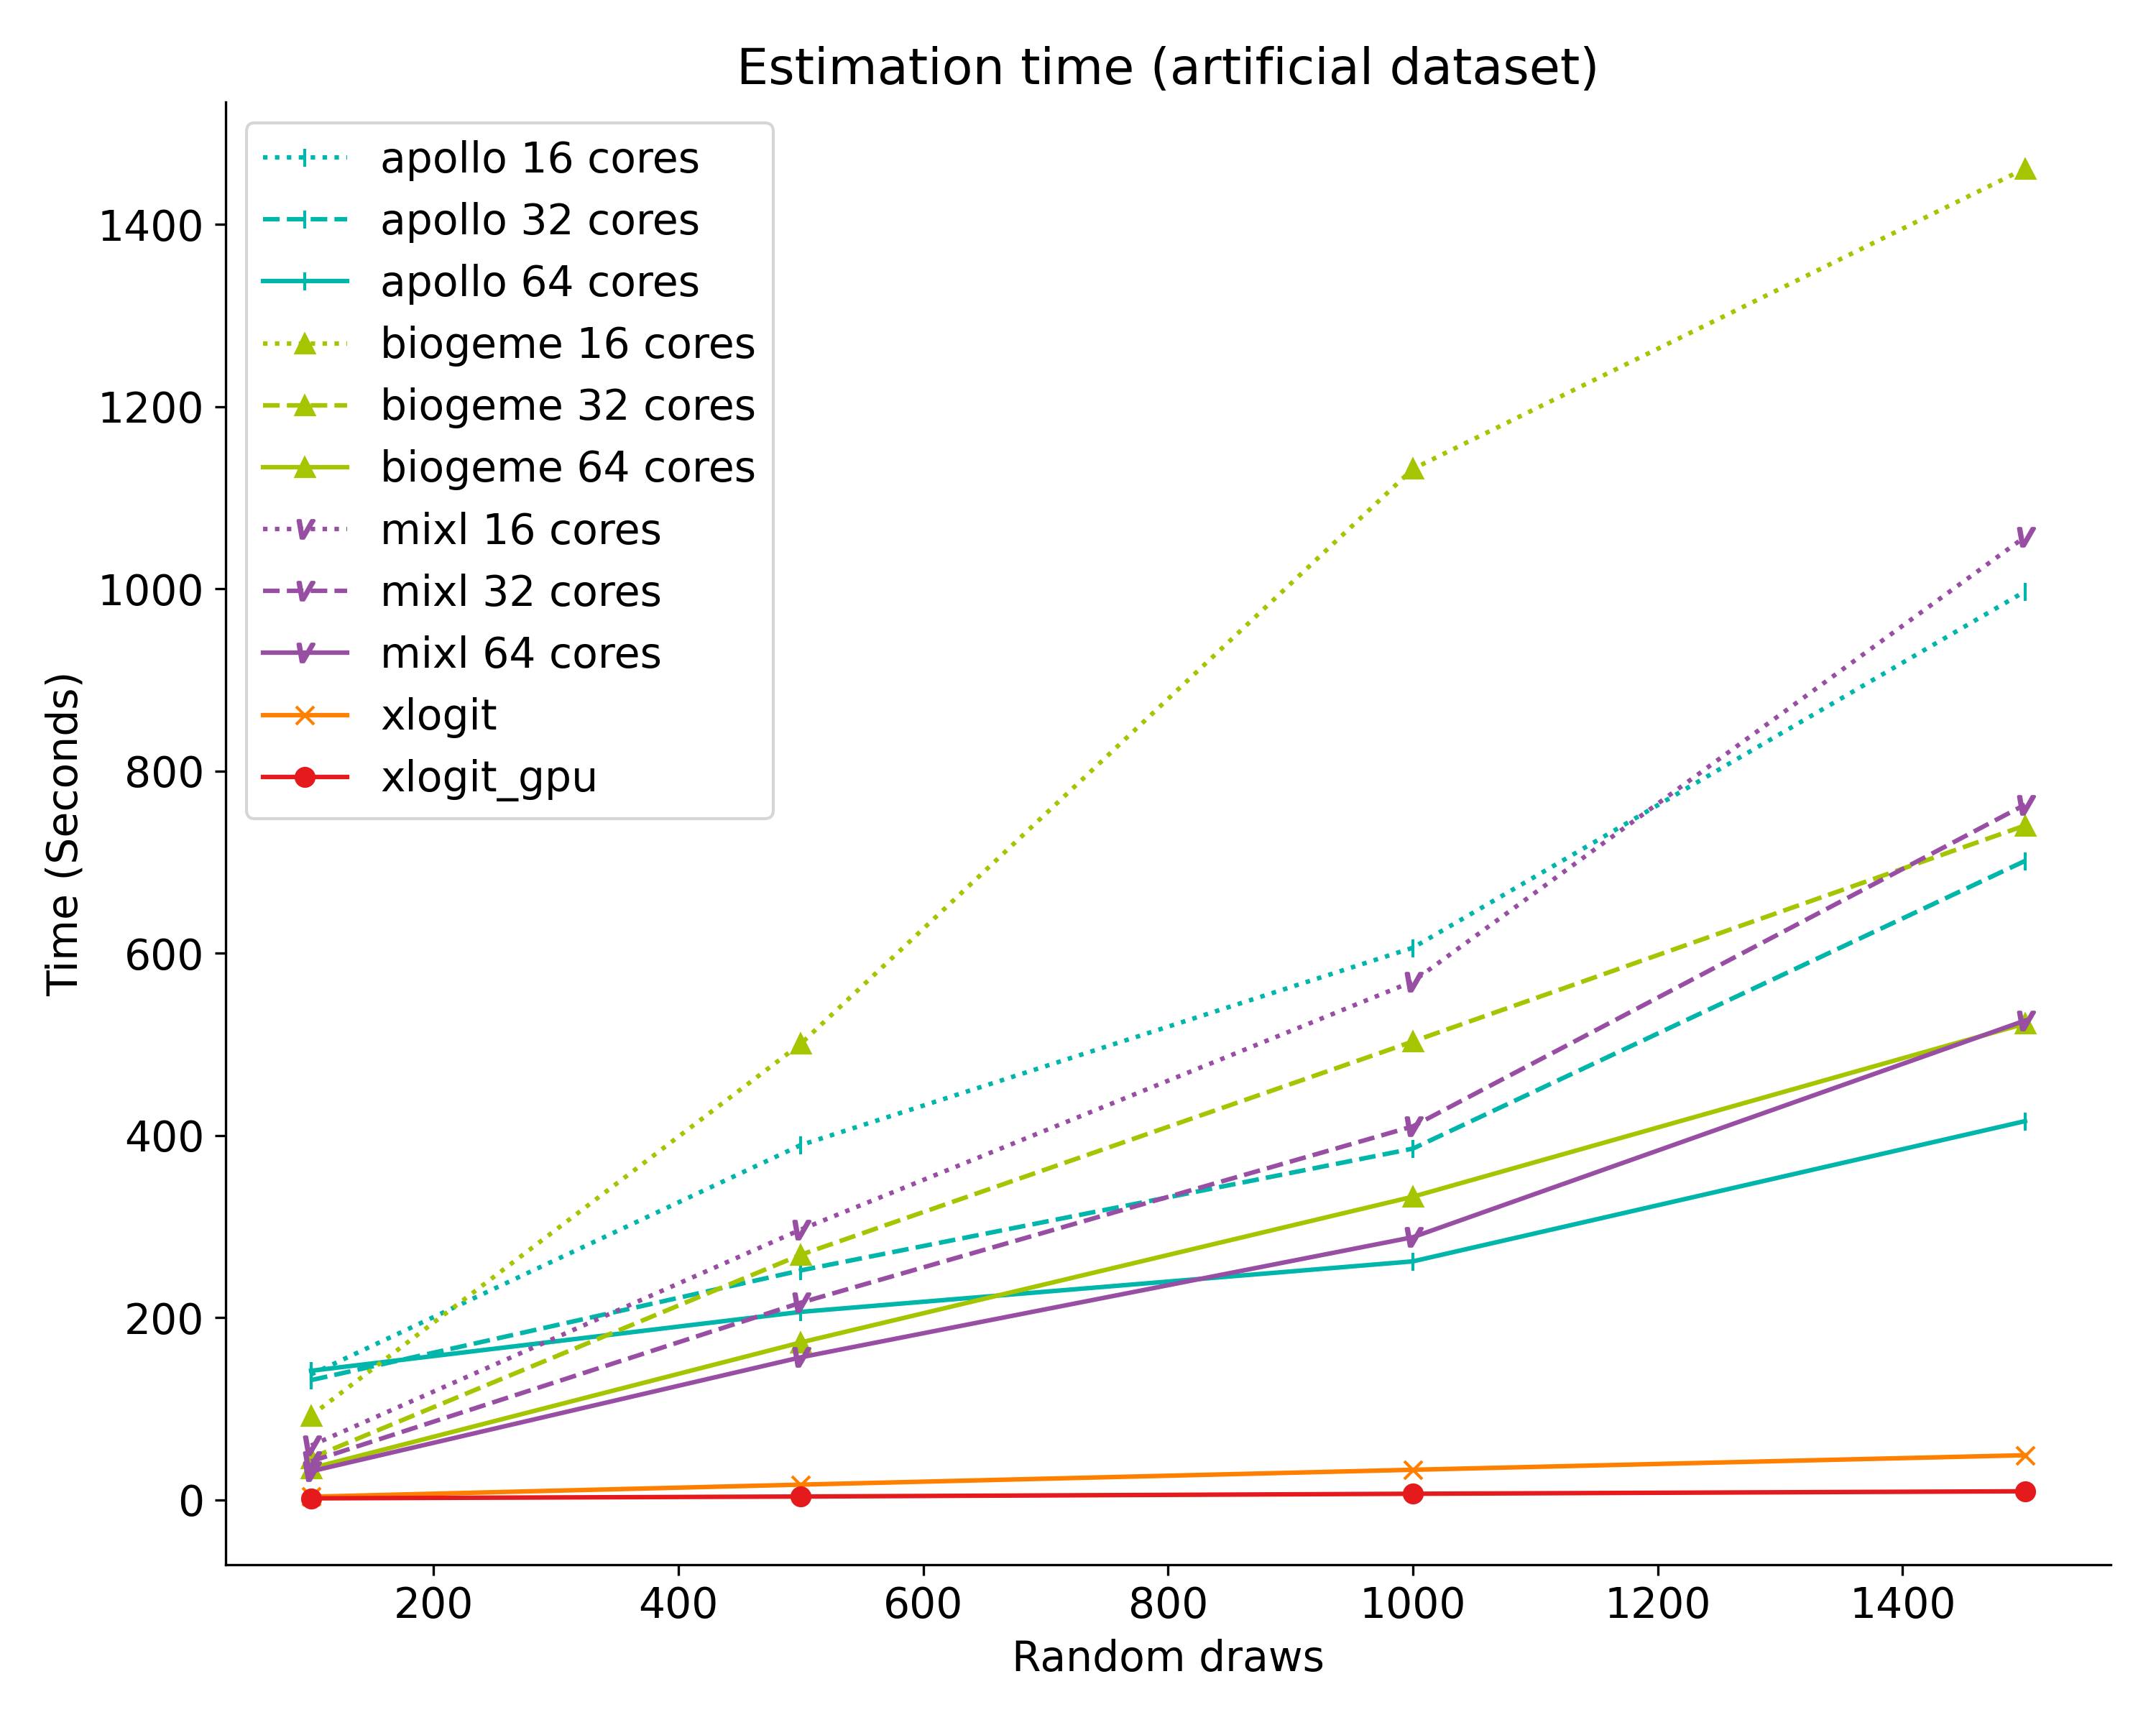
As shown in the plots below, xlogit is significantly faster than existing estimation packages. Also, xlogit provides convenient scaling when the number of random draws increases. These results were obtained using a modest and low-cost NVIDIA GTX 1060 graphics card. More sophisticated graphics cards are expected to provide even faster estimation times. For additional details about this benchmark and for replication instructions check https://xlogit.readthedocs.io/en/latest/benchmark.html.

image

image

Notes

The current version allows estimation of:

  • Mixed Logit with several types of mixing distributions (normal, lognormal, triangular, uniform, and truncated normal)
  • Mixed Logit with panel data
  • Mixed Logit with unbalanced panel data
  • Mixed Logit with Halton draws
  • Multinomial Logit models
  • Conditional logit models
  • WTP space models
  • Handling of unbalanced availability of choice alternatives for all of the supported models
  • Post-estimation tools for prediction and specification testing
  • Inclusion of sample weights for all of the supported models

Contributors

The following contributors have tremendously helped in the enhancement and expansion of xlogit's features.

Contact

If you have any questions, ideas to improve xlogit, or want to report a bug, chat with us on gitter or open a new issue in xlogit's GitHub repository.

Citing xlogit

Please cite xlogit as follows:

Arteaga, C., Park, J., Beeramoole, P. B., & Paz, A. (2022). xlogit: An open-source Python package for GPU-accelerated estimation of Mixed Logit models. Journal of Choice Modelling, 42, 100339. https://doi.org/10.1016/j.jocm.2021.100339

Or using BibTex as follows:

@article{xlogit,
    title = {xlogit: An open-source Python package for GPU-accelerated estimation of Mixed Logit models},
    author = {Cristian Arteaga and JeeWoong Park and Prithvi Bhat Beeramoole and Alexander Paz},
    journal = {Journal of Choice Modelling},
    volume = {42},
    pages = {100339},
    year = {2022},
    issn = {1755-5345},
    doi = {https://doi.org/10.1016/j.jocm.2021.100339},
}

xlogit's People

Contributors

arteagac avatar crforsythe avatar gc-axa avatar sl9289 avatar

Stargazers

 avatar  avatar  avatar  avatar  avatar  avatar  avatar  avatar  avatar  avatar  avatar  avatar  avatar  avatar  avatar  avatar  avatar  avatar  avatar  avatar  avatar  avatar  avatar  avatar  avatar  avatar  avatar  avatar  avatar  avatar  avatar  avatar  avatar  avatar  avatar  avatar  avatar  avatar  avatar  avatar  avatar  avatar  avatar  avatar  avatar  avatar  avatar  avatar

Watchers

 avatar

xlogit's Issues

WTP Space, GMNL, and Starting Values

Thanks for the awesome package. Cristian.

For implementation of WTP Space models, having reasonable starting values may be critical. My attempt to estimate my own data resulted in convergence issue: " Nonpositive definiteness in Cholesky factorization in formt; refresh the lbfgs memory and restart the iteration." The log likelihood is poor, indicating that the algorithm was stuck somewhere.

My intuition is that with proper starting values, the issues of local maxima or flat regions can be tackled. Is it possible to provide starting values to the procedure?

Further, Greene and Hensher (2010; Trasnportation Part D) and Fiebig et al. (2010; Marketing Science) have shown that WTP Space can be implemented with GMNL. The advantage of that is that the price parameter follows a log normal distribution. I wonder how the present set up of xlogit compares to/allow this specification.

Again, thanks for the awesome package. Xlogit is unrivalled in speed. It would be great to complete it with more useful features. This is a lot to ask. I would help if I can overcome the learning curve of programming it.

Variation in alternatives

I am trying to use xlogit in cases where I have variation in alternatives available to each individual. It appears that in these cases, the code will return the following error:

"raise ValueError('inconsistent alts values in long format')"

I believe from looking at the code, this is because the "_check_long_format_consistency" function in the "_choice_model" code checks whether the total number of observations equals the product of individuals times the number of unique alternatives. From what I can tell, this is not strictly necessary from a theoretical or a coding basis. Could someone verify this?

Would is be possible to remove this check in the next edition of the xlogit? In the meantime, is there some sort of workaround for this? Thanks for any comments.

Implement mixed logit models

The current version does not support mixed logit models. In general, the current code is ready to be expanded for this functionality, the major change required is to develop the gradient for the random parameters. This could be done by following some of the strategies implemented in this paper or in the mlogit package for R.

Keep a given parameter fixed to a predetermined value

Hi Cristian Arteaga,

I was wondering if your program allows you to set a subset of parameters to a given value while optimizing the rest of the parameters.

In particular, I am trying to set the cost coefficients to -1 to immediately read the Value of Time (VoT) from time coefficients.

Is that possible?

Best regards!
Álvaro

Standard errors v.0.2.6.

Hi Cristian Arteaga,

Thank you for your package.
I encounter a problem with standard errors when I run my code with version 0.2.6. The issue is that all of them are reported to be equal to 1, but when I run the same code and data on version 0.2.4. I do not have this problem. Am I missing something with the new version maybe?

Thanks in advance.
Best,
Max

potential bug in prediction of MIXL models

Dear Cristian Arteaga,
First of all, thank you for developing such a great package. I have been using it extensively and I think it works just great!

However, I think I found a weird behavior (most likely a bug) when predicting probabilities from a MIXL model.

I was trying to re-create the Log-likelihood (LL) of the model from its predicted probabilities using equation (6) in your article:

image

Unfortunately, noticed that I was not able to replicate them, and the differences were rather large. (see the first chunk of code below). Additionally, weirdly enough, when using only 1 draw, I am able to replicate the LL value. (see the second chunk of code below)

I haven't had time to go through your source code, but I think there is something wrong with the .predict() method for the MIXL models, since, for MNL models, I checked that my method of retrieving the LL works just fine (not included here).

First chunk

#%%
# 
import pandas as pd
import numpy as np
from xlogit.utils import wide_to_long
from xlogit import MixedLogit
# from your example
df_wide = pd.read_table("http://transp-or.epfl.ch/data/swissmetro.dat", sep='\t')
# Keep only observations for commute and business purposes that contain known choices
df_wide = df_wide[(df_wide['PURPOSE'].isin([1, 3]) & (df_wide['CHOICE'] != 0))]
df_wide['custom_id'] = np.arange(len(df_wide))  # Add unique identifier
df_wide['CHOICE'] = df_wide['CHOICE'].map({1: 'TRAIN', 2:'SM', 3: 'CAR'})
df = wide_to_long(df_wide, id_col='custom_id', alt_name='alt', sep='_',
                  alt_list=['TRAIN', 'SM', 'CAR'], empty_val=0,
                  varying=['TT', 'CO', 'HE', 'AV', 'SEATS'], alt_is_prefix=True)
df['ASC_TRAIN'] = np.ones(len(df))*(df['alt'] == 'TRAIN')
df['ASC_CAR'] = np.ones(len(df))*(df['alt'] == 'CAR')
df['TT'], df['CO'] = df['TT']/100, df['CO']/100  # Scale variables
annual_pass = (df['GA'] == 1) & (df['alt'].isin(['TRAIN', 'SM']))
df.loc[annual_pass, 'CO'] = 0  # Cost zero for pass holders
varnames=['ASC_CAR', 'ASC_TRAIN', 'CO', 'TT']


# Model building 
model = MixedLogit()
model.fit(X=df[varnames], 
          y=df['CHOICE'], 
          varnames=varnames,
          alts=df['alt'], 
          ids=df['custom_id'],
           avail=df['AV'],
          panels=df["ID"], randvars={'TT': 'n'}, 
          n_draws=100,
          optim_method='L-BFGS-B')


# Create predictions 
predictions = model.predict(X=df[varnames], 
              varnames=varnames,
                alts=df['alt'], 
                ids=df['custom_id'], 
                avail=df['AV'],
                panels=df["ID"], 
                n_draws=100,
                return_proba = True) 
# Recovering the predicted probabilities
pred_proba = predictions[1]

# transform the df['CHOICE'] variable into a dummy variable
chosen = np.array(df_wide['CHOICE'].map({'TRAIN': 0, 'SM': 1, 'CAR': 2})).reshape(-1, 1)
# Select the probability of the chosen alternative
proba_chosen = np.take_along_axis(pred_proba, chosen, axis=1)
# Compute the negative log-likelihood
recreated_LL = np.sum(np.log(proba_chosen))
print("recreated LL:",recreated_LL)
print("model's LL  :",model.loglikelihood)

# recreated LL: -5293.024645448918
# model's LL  : -4360.226616589964

Second chunk

# The same again but with 1 draw only.
model.fit(X=df[varnames], 
          y=df['CHOICE'], 
          varnames=varnames,
          alts=df['alt'], 
          ids=df['custom_id'],
           avail=df['AV'],
          panels=df["ID"], randvars={'TT': 'n'}, 
          n_draws=1,
          optim_method='L-BFGS-B')


# Create predictions 
predictions = model.predict(X=df[varnames], 
              varnames=varnames,
                alts=df['alt'], 
                ids=df['custom_id'], 
                avail=df['AV'],
                panels=df["ID"], 
                n_draws=1,
                return_proba = True) 
# Recovering the predicted probabilities
pred_proba = predictions[1]

# transform the df['CHOICE'] variable into a dummy variable
chosen = np.array(df_wide['CHOICE'].map({'TRAIN': 0, 'SM': 1, 'CAR': 2})).reshape(-1, 1)
# Select the probability of the chosen alternative
proba_chosen = np.take_along_axis(pred_proba, chosen, axis=1)
# Compute the negative log-likelihood
recreated_LL = np.sum(np.log(proba_chosen))
print("recreated LL:",recreated_LL)
print("model's LL  :",model.loglikelihood)


#recreated LL: -5331.206129776281
#model's LL  : -5331.206129776281

Thank you in advance!

Álvaro

Small Bug in Predict

Hi Cristian,

Hope you're well! Just wanted to let you know that there is a small bug in the predict method. For the multinomial login class on line 283-284, it reads as follows:

if weights is not None: # Reshape weights to match input data weights = weights[y.ravel().astype(bool)]

but it should read as follows to prevent operation on None y values:
if weights is not None and not predict_mode: # Reshape weights to match input data weights = weights[y.ravel().astype(bool)]

Logo generated by DALLE-mini

xlogit needed a logo, so I asked DALLE-mini to generate one.
xlogit_dalle

I selected firs one in the third column and added a transparent background:

Added some text, and done!

inconsistent alts values in long format

I am coming over from R and the mlogit package and I have the data formatted in the same way. It seems like xlogit is expecting that when in long format there's the same number of alt rows for each id group. Is this expected behavior for xlogit? Am I attempting to do something that just isn't possible?

model = MultinomialLogit()
model.fit(X=df[vars], y=df['result'], varnames=vars, ids=df['id'], alts=df['alt_id'])
model.summary()
id alt_id var1 var2 var3 var4 result
1 1 3 4 5 6 0
1 2 3 4 5 6 0
1 3 3 4 5 6 1
1 4 3 4 5 6 0
2 1 3 4 5 6 0
2 2 3 4 5 6 1
2 3 3 4 5 6 0
3 1 3 4 5 6 0
3 2 3 4 5 6 0
3 3 3 4 5 6 0
3 4 3 4 5 6 0
3 5 3 4 5 6 1

Adding logitr to benchmarking

@arteagac, xlogit looks amazing, thanks for your work on this!

As @crforsythe noted in issue #3 on implementing WTP space models, I'm the author of the logitr R package. It seems both packages have very similar functionality (except for the WTP space implementation, which shouldn't be too hard to add if you're interested in adding it). logitr is considerably faster than most of the other R packages you benchmark against, but I don't think it's speed will scale with very large numbers of draws like xlogit. It'd be great to see it added to your benchmarking. I was actually in the process of attempting to benchmark it myself, but since you've already got yours setup it should be pretty easy to add it. I believe xlogit and logitr use the same data structure too - the UI looks quite similar.

Really nice work you've done here!

Include additive term in the utility formulation

The temporary branch addit implements an additive term in the utility formulation. This additive term can help model coefficients kept at a fixed value as well as alternative specific fixed values. The additive term can be included in the fit and predict functions as follows:

model.fit(..., addit= -1*df['cost'], ...)

which would result in the following utility specification that simulates a coefficient of -1 for the cost coefficient kept fixed throughout the estimation (the portion in squared brackets is the addit term):

$$ U_{j} = \beta_0 + \beta_{1j} x_{1j} + ... + [-1\cdot x_{cost j}]$$

Note that you can also add multiple terms by simple pre-computing the addit term.

Enabling Non-Linear Utility Functions - WTP Space

Love seeing this new contribution to choice modeling software! Very impressive work. I was wondering if you had any intention to expand xlogit's ability to allow for nonlinear utility specification, such as WTP space estimation a la Train and Weeks (2005)?

Estimating random utility models from Bruhin et al. (2019)

First of all: Thanks a lot for this very useful package!

I was wondering whether it would be possible to estimate the random utility models in Bruhin et al. (2019) as mixed logits using xlogit? The authors already estimate the utility models as standard logits and finite mixtures. Specifically, they estimate simple social preference models based on a panel of binary dictator and reciprocity games. In a binary dictator game, the subject is randomly matched with another subject and has to choose between two allocations. The utility of a given allocation is given by:

image

In a binary reciprocity game, the subject is faced with the same decision, but the matched subject performs either a kind or unkind decision beforehand. Hence, the utility here is given by:

Screenshot 2022-08-01 at 19 33 58

Based on this, the probability of choosing one allocation over the other is given by:

Screenshot 2022-08-02 at 10 35 49

It is not clear to me whether such a functional form, both as standard logit and mixed logit, can be estimated by xlogit.

Many thanks and best,
Jesper

Recommend Projects

  • React photo React

    A declarative, efficient, and flexible JavaScript library for building user interfaces.

  • Vue.js photo Vue.js

    🖖 Vue.js is a progressive, incrementally-adoptable JavaScript framework for building UI on the web.

  • Typescript photo Typescript

    TypeScript is a superset of JavaScript that compiles to clean JavaScript output.

  • TensorFlow photo TensorFlow

    An Open Source Machine Learning Framework for Everyone

  • Django photo Django

    The Web framework for perfectionists with deadlines.

  • D3 photo D3

    Bring data to life with SVG, Canvas and HTML. 📊📈🎉

Recommend Topics

  • javascript

    JavaScript (JS) is a lightweight interpreted programming language with first-class functions.

  • web

    Some thing interesting about web. New door for the world.

  • server

    A server is a program made to process requests and deliver data to clients.

  • Machine learning

    Machine learning is a way of modeling and interpreting data that allows a piece of software to respond intelligently.

  • Game

    Some thing interesting about game, make everyone happy.

Recommend Org

  • Facebook photo Facebook

    We are working to build community through open source technology. NB: members must have two-factor auth.

  • Microsoft photo Microsoft

    Open source projects and samples from Microsoft.

  • Google photo Google

    Google ❤️ Open Source for everyone.

  • D3 photo D3

    Data-Driven Documents codes.