apexcharts / vue-apexcharts Goto Github PK
View Code? Open in Web Editor NEW📊 Vue.js component for ApexCharts
Home Page: https://apexcharts.com
License: MIT License
📊 Vue.js component for ApexCharts
Home Page: https://apexcharts.com
License: MIT License


![dependabot[bot] avatar](https://avatars.githubusercontent.com/in/29110?v=4 "dependabot[bot]")


https://codepen.io/anon/pen/PdLoZK

Updating the yaxis.max option via Vue doesn't change the yaxis on the chart itself, so when updating data that goes beyond the current range, there's unwanted clipping happening.
Replicating the setup without Vue doesn't show the bug, so it's likely something here.
I'm trying to update the yaxis min and max through the options object
<apexcharts type="line" :options="options" :series="series"></apexcharts>
data() {
  return {
    options: {
      yaxis: {
        min: undefined,
        max: undefined,
      },
    },
  }
}
yRangeChanged(min, max) {
  this.options.yaxis.min = min;
  this.options.yaxis.max = max;
 }
But this doesn't work. The object is correctly updated, but the Y axis range stays the same. If I manually set yaxis.min and yaxis.max to begin with, the graph displays correctly. I noticed a commit which added a Yaxis prop, but it looks like this was taken out straight away.
Am I missing something when trying to update these values?
I am integrating Apexcharts into Vue/Nuxt application. Tooltip for downloading chart as PNG does not open. Any idea what could be wrong?

do you have a sample on how to implement on nuxt js?
The command npm run serve for serving the examples throw the following error:
ERROR  Failed to compile with 1 errors

Module build failed (from ./node_modules/eslint-loader/index.js):
Error: No ESLint configuration found.
I use node v8.12.0 and npm 6.4.1
I'm trying to run vue-apexcharts directly on the browser without importing the component but using Vue.use() function instead, as follows:
<!DOCTYPE html>
<html lang="en">
<head>
<script src="https://cdn.jsdelivr.net/npm/vue/dist/vue.js"></script>
<script src="https://unpkg.com/vue-apexcharts"></script>
</head>
<body>
<div id="appl">
   <div>
     <apexcharts width="500" type="bar" :options="chartOptions" :series="series"></apexcharts>
   </div>
</div>
<script>
Vue.use(VueApexCharts);
var app = new Vue({
  el: '#appl',
    components: {
      apexcharts: VueApexCharts,
    },
    data: function() {
      return {
        chartOptions: {
          chart: {
            id: 'vuechart-example'
          },
          xaxis: {
            categories: [1991, 1992, 1993, 1994, 1995, 1996, 1997, 1998, 1999]
          }
        },
        series: [{
          name: 'series-1',
          data: [30, 40, 45, 50, 49, 60, 70, 91]
        }]
      }
    },
    mounted: function() {
                console.log('mounted()..');
    }
});
</script>
</body>
</html>
Is it possible?
Hi
I have tried the following.
this.$refs.demoChart.chart.svgUrl();blob:http://localhost:4000/5c67f400-7bf3-4ee6-9f99-b3ca41677d91
Is this something wrong?
Hello Team,
I have to implement Heatmap chart in laravel vue js , but I got an error (
Uncaught (in promise) TypeError: Right-hand side of 'instanceof' is not callable) .
which is working fine in https://codesandbox.io/s/42yryo2957 link.
Thanks,
Hello, below is my code, everything is great, except sometimes after data update chart breaks.
Usually, it is happening when there will be more points than previous set has. After next update chart is again perfect.
<ApexCharts type=candlestick :options="chartOptions" :series="series" />

...

export default {
        name: "TerminalCharts",
        props: {
            graph: {
                type: Array,
                default: function() { return []; }
            }
        },
        watch: {
            graph: function(graph) {
                this.series = [{ data: this.graph }];
            }
        },
        components: {
            ApexCharts
        },
        created() {
            this.series = [{ data: this.graph }];
        },
        data () {
            return {
                time: "1m",
                isButtonActive: false,
                chartViewPort: {
                    settings: {
                        candle: true,
                        line: false,
                        depth: false
                    }
                },
                chartOptions: {
                    width: '100%',
                    height: '100%',
                    chart: {
                        id: 'candles',
                        toolbar: {
                          autoSelected: 'pan',
                          show: false
                        },
                        zoom: {
                          enabled: false
                        }
                    },
                    plotOptions: {
                        candlestick: {
                            colors: {
                                upward: '#00B121',
                                downward: '#F65454'
                            }
                        }
                    },
                    grid: {
                        borderColor: '#2B2E39'
                    },
                    xaxis: {
                        type: 'datetime'
                    }
                },
                series: [{ data: [] }]
            }
        }
}
Before break:

After break:

When I do npm run serve, I get:
npm run serve

> [email protected] serve /Projects/vue-apexcharts/example
> vue-cli-service serve

 INFO  Starting development server...
 94% after seal                                                               -
 ERROR  Failed to compile with 1 errors                                 16:59:40

Module build failed (from ./node_modules/eslint-loader/index.js):
Error: No ESLint configuration found.
    at Config.getLocalConfigHierarchy (/Projects/vue-apexcharts/example/node_modules/eslint/lib/config.js:255:39)
    at Config.getConfigHierarchy (/Projects/vue-apexcharts/example/node_modules/eslint/lib/config.js:179:43)
    at Config.getConfigVector (/Projects/vue-apexcharts/example/node_modules/eslint/lib/config.js:286:21)
    at Config.getConfig (/Projects/vue-apexcharts/example/node_modules/eslint/lib/config.js:329:29)
    at processText (/Projects/vue-apexcharts/example/node_modules/eslint/lib/cli-engine.js:163:33)
    at CLIEngine.executeOnText (/Projects/vue-apexcharts/example/node_modules/eslint/lib/cli-engine.js:620:17)
    at lint (/Projects/vue-apexcharts/example/node_modules/eslint-loader/index.js:237:17)
    at transform (/Projects/vue-apexcharts/example/node_modules/eslint-loader/index.js:215:18)
    at /Projects/vue-apexcharts/example/node_modules/loader-fs-cache/index.js:127:18
    at ReadFileContext.callback (/Projects/vue-apexcharts/example/node_modules/loader-fs-cache/index.js:31:14)
    at FSReqWrap.readFileAfterOpen [as oncomplete] (fs.js:420:13)

You may use special comments to disable some warnings.
Use // eslint-disable-next-line to ignore the next line.
Use /* eslint-disable */ to ignore all warnings in a file.
Idea? Thanks!
When HMR (Hot Module Replacement, Webpack 4) is enabled and an update is received the chart is not updated anymore and there are errors whenever a change in the layout happens, e.g. changing browser size.
Uncaught TypeError: Cannot read property 'querySelectorAll' of undefined
This can be easily reproduced just by using the topmost basic component example in README

Hi, in my app I have div as card and it's width is changed when user clicks on button.
Now problem is when card(div) width is changed chart is not resizing.
This is serious problem for me. Can u plz help me.
You can check this in jsfiddle
When running in development/production mode with vue, I get no errors and the chars work as expected.
But when I try to test the component that is using the charts, it throws an exception:
I know it's a babel 7 issue, but this should be pretty simple to solve by replacing es5 modules (module.exports), with es6 modules (export default).
Cannot assign to read only property 'exports' of object '#<Object>'
Hi,
i have tried the following but I can't get it to work
this.$refs.chart.updateOptions({ colors: ['red','green'] })
also if i try
this.$refs.chart.toggleSeries('SeriesName')
i get the error: '_this3.$refs.chart.toggleSeries is not a function'
Any suggestions?
below is my current implementation. im trying to make the colors dynamic but it seems like its always stuck on the default blue color
`<script>
export default {
props: ['id','chartClass', 'fillColor', 'label'],

data() {
    return {
        series: [55],
        chartOptions: {
            plotOptions: {
                radialBar: {
                    startAngle: 0,
                    endAngle: 360,
                    hollow: {
                        margin: 0,
                        size: '50%',
                        dropShadow: {
                            enabled: false,
                            top: 3,
                            left: 0,
                            blur: 4,
                            opacity: 0.24
                        },
                    },

                    track: {
                        background: '#DDD',
                        strokeWidth: '100%',
                        margin: 0 // margin is in pixels
                    },

                    dataLabels: {
                        showOn: 'always',
                        name: {
                            offsetY: 20,
                            show: true,
                            color: '#333',
                            fontSize: '14px'
                        },
                        value: {
                            formatter: function(val) {
                                return parseInt(val);
                            },
                            color: '#DDD',
                            fontSize: '30px',
                            show: true,
                            offsetY: -15,
                        }
                    }
                },

                fill: {
                    type: 'solid',
                    colors: ['#F44336', '#E91E63', '#9C27B0']
                },
                color: [this.fillColor],
                stroke: {
                    dashArray: 4
                },
            },
            labels: [this.label],
        }
    }
},

mounted () {


}
}
</script>`
The readme says that the chart option are reactive and will be update after changing it.
https://codepen.io/lukasleitsch/pen/NEyZGd
In this usecase the updating of the annotations not working. (Update Annotation Button) In the console you see the updated chart options object.
If I use the the updateOptions function the updating of the options works, (Force Update Annotation Button)
I guess that the first version should also work, shouldn't it?
Hi!
Component:
"vue": "^2.5.17",
"vue-apexcharts": "^1.1.1",
"apexcharts": "^1.5.1",
      options: {
        chart: {
          id: "idChart",
          toolbar: { show: true }
        },
        xaxis: { categories: ["1991", "1992", "1993", "1994", "1995", "1996"] }
      },
      series: [ { name: "series-1", data: [30, 40, 45, 50, 49, 60, 70, 91]  }]
In this case I have only download button. Even if specify tools options like this
tools: { download: true, selection: true, zoom: true, zoomin: true, zoomout: true, pan: true, reset: true },

Zoom doesnt work in this case.
But without xaxis.categories I have all buttons and zoom works as expected
      options: {
        chart: {
          id: "idChart",
          toolbar: { show: true }
        },
      },
      series: [ { name: "series-1", data: [30, 40, 45, 50, 49, 60, 70, 91]  }]

Hi. I'm open my page with
" "

and see:

after click "reset zoom" - ok

Sorry for my English )
Screenshot of error:

Dependencies:
...

"apexcharts": "^2.2.1",
"vue-apexcharts": "^1.2.6"
An error appears when using brush-parameter for line graphs. I am trying to adapt the code for the SPA, which lies here.
I import the VueApexCharts library in single page component as:
import VueApexCharts from 'vue-apexcharts'
and use it, as:
...

components: {
   apexcharts: VueApexCharts,
},

...
and in template:
...

<apexcharts type="line" height="230"
    :options="chartOptionsArea"
    :series="series"
></apexcharts>
<apexcharts type="area" height="130"
   :options="chartOptionsBrush"
   :series="series"
></apexcharts>

...
chartOptionsArea, chartOptionsBrush and series params copied from file by link
UPD: If delete brush-parameter, the graphics are displayed normally.
With the latest version of apexcharts.js the series names don't work. In the version 2.1.5 the series names work.
You can see this issue in your line charts example. The series are named with series-1 and series-2. I guess it is an issue of vue-apexcharts because the examples of the apexcharts repo work without this issue.
We've got a chart options object:
this.chartTotal.options = {
...
annotations: { position: 'front', points: [] },
...
}
Prior to 2.1.6 we could add annotations dynamically using this.chartTotal.options.annotations.points.push(...)
this is not working anymore.
I have install apexcharts and when I try to create a chart in component it gives an error as below :
Uncaught (in promise) TypeError: Right-hand side of 'instanceof' is not callable
Let me know if anyone have faced this issue.
Thanks in Advance
If you dynamically add data with negative axis (like from -200 to 200) and don't put them first in the order of the axis, the lines draw like the 0 is at the bottom. It works well if the axis are sorted by axis_min. I can't provide a codepen as of now but will add it later.
First axis and data is a 0 to positive axis :
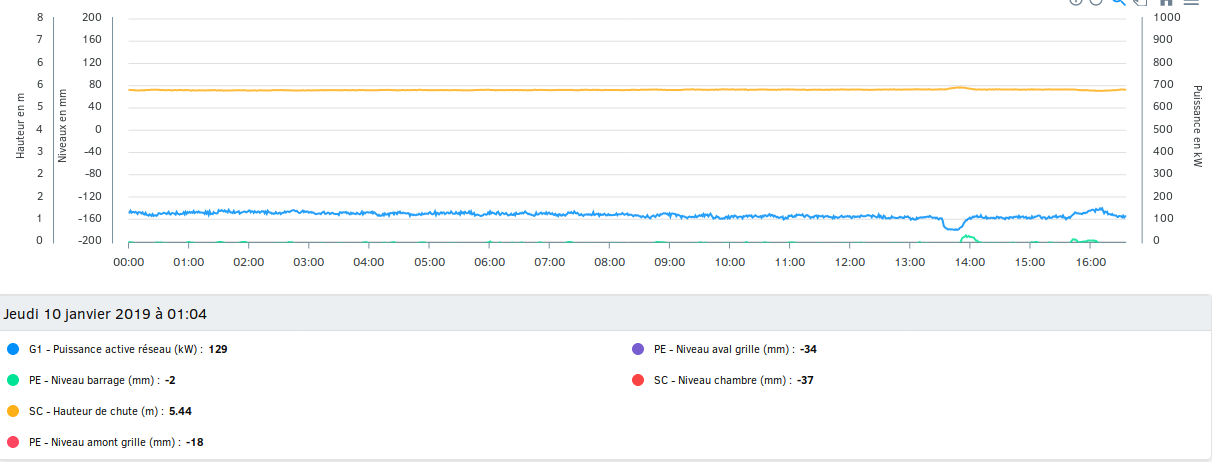
With axis and data sorted by axis min :
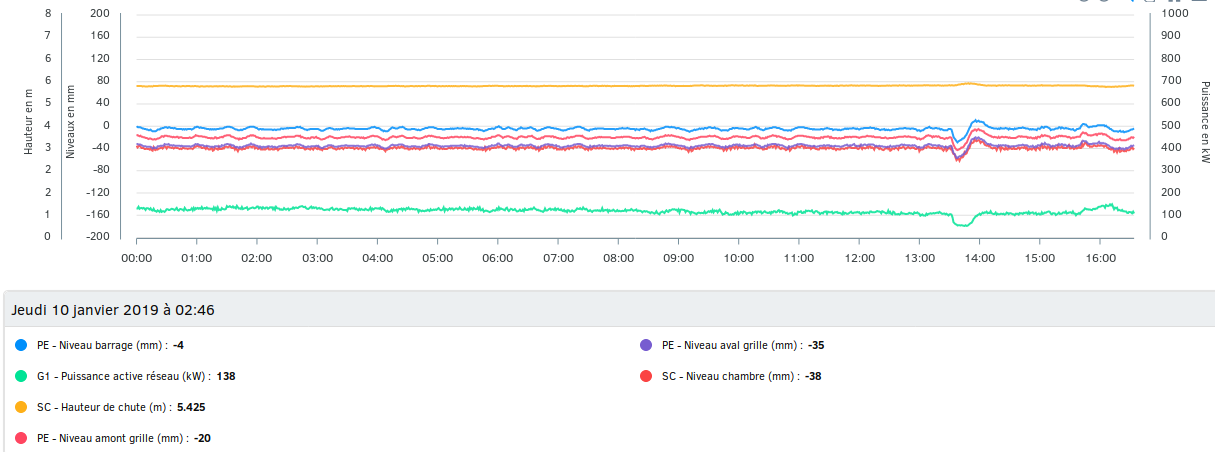
I suppose this is a minor forget somewhere but I'm willing to build up a codepen if needed.
before:
{"type":"category","categories":["20181101","20181102","20181103","20181104","20181105","20181106","20181107","20181108","20181109","20181110","20181111","20181112","20181113","20181114","20181115","20181116","20181117","20181118","20181119","20181120","20181121","20181122","20181123","20181124","20181125","20181126","20181127","20181128","20181129","20181130"]}
after :
{"type":"category","categories":["201810","201811"]}
I changed the "categories" value, but the graph does not respond.
vue devtool

web

I am using the bar chart like this:
        <apexcharts
                width="300"
                height="250"
                type="bar"
                :options="options"
                :series="series">
        </apexcharts>
data: () => {
      return {
        options: {
          chart: {
            id: 'Chart'
          },
          colors: ['#41B883', '#E46651', '#E46651']
        },
        series: [{
          name: 'Count',
          data: [30, 40, 10]
        }]
      }
  }
The chart shows; however, all three bars use the same color, which is the first one ('#41B883').
How can I make the bars use all the colors specified?
Thanks!
Line charts seem to update when the vuex store is manipulated, regardless of whether or not the data has changed, or is even associated with the chart at all. The radialBar charts do not appear to do this, which leads me to believe that it is an issue with the way vue-apexcharts wrap the chart library to handle data updates. It appears as though the chart is not only re-drawn, but re-created and re-initialized, as chrome detects updates to the root element, and all functions of the container reset (ie. zoom, save menu, etc.), and the buttons flicker when the chart refreshes while hovering over them

I wanted to use the appendData method of apexchart, if we add
appendData: function appendData(newData) {
  this.chart.appendData(newData);
}
to the methods of the component, we can access this through Vue's refs
<apexcharts ref="chart" type="line" :options="options" :series="series" />
this.$refs.chart.appendData(valueArray);
Hi,
Is it possible to add types to use vue-apexcharts with Typescript ?
Hey,
have you considered adding apexcharts as a peerDependency ?
Right now it is a direct dependency, however as it acts only as a wrapper for the core, it would be easier if apexcharts would be a peerDependency.
The advantage is, that you provide a sane way to update apexcharts. Right now, there is actually no good way to check for updates nor update the package.
If something in apexcharts changes, you have to bump the version of apexcharts and bump the version of vue-apexcharts. Which is quite a lot of work if you publish fixes often.
Moreover if you forget to do so, and someone runs yarn / npm install it most of the time fetches the latest version of apexcharts (now always) and if apexchart should introduce a breaking bug or a failed fix, as a user you have no way to rollback. Because the version of vue-apexcharts remain the same.
If apexcharts is a peerDependency a user can maintain the version and rollback.
Instad of yarn add vue-apexcharts it would be yarn add vue-apexcharts apexcharts.
Btw. you don't really need Vue as a peerDependency as you are not using Vue.js anywhere in your code.
Hey, recently I updated vue-apexcharts to latest release since then my tooltip in some of my charts is not working.
They includes:
Pie chart
donut chart
radial etc.
I can not figure out whats problem. I have similar jsfiddle to yours as you provided in demo.
Still tooltip is not working.
And one more thing,
this pie charts, donut charts and radial chart have some space below them.
You can also see this problem in jsfiddle.
Thanks.
Using Vue Cli 3, the basic GitHub example generates the following error:
TypeError: "u.parser.draw is undefined"
And no chart displays. Am I missing something?
Update: The chart example works in the root of my project but not inside a component that is being used as a router-view. Unsure if that's relevant but just in case.
Hello! :)
I'm trying to use zoom with custom array of data:
 chartOptions: {
                       chart: {
                        id: 'vuechart',
                        toolbar: { show: true },

                        zoom: {
                            enabled: true,
                            type: 'x',
                        }
                    },
                    xaxis: {
                        categories: [0, 2, 4, 6, 8, 10]
                    }
                }
But tools with settings for zoom don't appear. if I remove 'xaxis' option than this code will works fine with standard xaxis list [1,2,3,...]:
chartOptions: {
                      chart: {
                        id: 'vuechart',
                        toolbar: { show: true },

                        zoom: {
                            enabled: true,
                            type: 'x',
                        }
                    }
                }
How I can use zoom with custom array for xaxis? I know that zooming will not be enabled for category x-axis charts, but only for charts having numeric x-axis. For eg., timeline charts, but...
I apologize if the question is stupid :(
ty very much!
Hi,
is it possible to set a custom interval for the yaxis?
I have a chart with values ranging between 100 and 145. The yaxis values seem to be generated automaticaly based on the chart values, which is great. But that renders yaxis values with decimals and none rounded values.
E.g. there are values such as 137 or 120.5 and those look weird on a chart.
Is it possible to set it to a range (and plot the chart accordingly) such as:
100 - 105 - 110 - 115 - 120 - 125 - 130 - 135 - 140 - 145
So rounded numbers with an interval of 5.
There is an error using vue-apexcharts with v.1.4.10 and onward (tested till 1.4.12), where the data the updating of series just throw a typeError.
vue.runtime.esm.js?2b0e:1737 TypeError: Cannot read property 'min' of undefined
    at eval (apexcharts.min.js?3d1e:1)
    at Array.map (<anonymous>)
    at i.value (apexcharts.min.js?3d1e:1)
    at i.value (apexcharts.min.js?3d1e:1)
    at VueComponent.$watch.series (vue-apexcharts.js?1321:53)
    at Watcher.run (vue.runtime.esm.js?2b0e:3229)
    at flushSchedulerQueue (vue.runtime.esm.js?2b0e:2977)
    at Array.eval (vue.runtime.esm.js?2b0e:1833)
    at flushCallbacks (vue.runtime.esm.js?2b0e:1754)

apexcharts.min.js?3d1e:1 Uncaught (in promise) TypeError: Cannot read property 'result' of undefined
    at e.value (apexcharts.min.js?3d1e:1)
    at eval (apexcharts.min.js?3d1e:1)
    at Array.map (<anonymous>)
    at i.value (apexcharts.min.js?3d1e:1)
    at eval (apexcharts.min.js?3d1e:1)
    at new Promise (<anonymous>)
    at i.value (apexcharts.min.js?3d1e:1)
    at eval (apexcharts.min.js?3d1e:1)
    at new Promise (<anonymous>)
    at i.value (apexcharts.min.js?3d1e:1)
if not give the prop of "width", plot can't be show correctly.
Hello!
i'm using:
And I have strange behavior of animation in bar chart on initial load if series: [ { data: [] } ] is empty.
At the moment when I initial chart object I do not have data for series and categories
 options: {
        chart: {
          id: "isChart",
          dropShadow: { enabled: true, top: 11,  left: 0,  blur: 3,  opacity: 0.5 },
          animations: { enabled: true, easing: "linear", speed: 1500,
            animateGradually: { enabled: true, delay: 1500 },
            dynamicAnimation: { enabled: true, speed: 1500 }
          }
        },
        xaxis: { categories: [] },
      },
      series: [ { name: "s1", data: [] } ]
Then I make request to backend and fill series data and categories
axios.post("http://mydomain/loadData")
        .then(response => {
          response.data.forEach((element, index) => {
            this.numX.push(index + 1);
            this.numY.push(element.data);
          });
          this.series = [ { data: this.numY }  ];
          this.options = {  xaxis: {  categories: this.numX  }  };
        })
        .catch(error => {
          console.log(error);
        });
And on first time animations seems doesn't work and chart appears instantly. If i repeat this action(at this moment series data already filled with some data) animation will work correctly.
This behiavor only with bar chart.
i try for "area" and "line" charts and animation works correctly even on initial load when series data is emty
If labels: ['a', 'b', 'c', 'd'], pie is rendered, but if labels: this.labels1 is not rendered.
I'm trying to change a series' type on the fly, basically from "column" to "line" and vice-versa.
For that, vue needs to re-render the component with the correct series configuration, so placing a ":key" makes it happen on every series type change. The key is composed with all the series' types, delimited by hyphen, like so:
<apexchart v-if="hasChartData" :key="chartId" :options="apexOptions" :series="apexSeries"/>
And possible keys are "revenue:column-comparison:column" and "revenue:line-comparison:column".
It works, however, I'm getting a javascript error on every key change originating from the old component's destroy function:
vue.runtime.esm.js?2b0e:1819 TypeError: Cannot read property 'resizeListeners' of null
at window.removeResizeListener (apexcharts.esm.js?e122:26271)
at ApexCharts.destroy (apexcharts.esm.js?e122:26973)
at VueComponent.destroy (vue-apexcharts.js?1321:93)
at VueComponent.beforeDestroy (vue-apexcharts.js?1321:69)
at callHook (vue.runtime.esm.js?2b0e:3025)
at VueComponent.Vue.$destroy (vue.runtime.esm.js?2b0e:2798)
at destroy (vue.runtime.esm.js?2b0e:4267)
at invokeDestroyHook (vue.runtime.esm.js?2b0e:5831)
at removeVnodes (vue.runtime.esm.js?2b0e:5847)
at updateChildren (vue.runtime.esm.js?2b0e:5952)
ApexCharts.destroy line:
window.removeResizeListener(this.el.parentNode, this.parentResizeCallback.bind(this))
window.removeResizeListener line:
element.__resizeListeners__.splice(element.__resizeListeners__.indexOf(fn), 1);
Any thoughts?
Cannot figure out why, wish some help!
<template>
  <div id="home">
    <section class="hero">
      <div class="hero-body">
        <div class="container">
          <h1 class="title">
            Home Page
          </h1>
          <h2 class="subtitle">
            Dashboard
          </h2>
        </div>
      </div>
    </section>
    <section>
      <apexcharts width="500" type="bar" :options="chartOptions" :series="series"></apexcharts>
    </section>
  </div>
</template>

<script>
  import VueApexCharts from 'vue-apexcharts'

  export default {
    name: 'home-page',
    components: {
      apexcharts: VueApexcharts
    },
    data () {
      return {
        chartOptions: {
          chart: {
            id: 'vuechart-example'
          },
          xaxis: {
            categories: [1991, 1992, 1993, 1994, 1995, 1996, 1997, 1998, 1999]
          }
        },
        series: [{
          name: 'series-1',
          data: [30, 40, 45, 50, 49, 60, 70, 91]
        }]
      }
    },
    methods: {
      open (link) {
        this.$electron.shell.openExternal(link)
      }
    }
  }
</script>

<style>

</style>
ERROR in ./src/renderer/components/HomePage.vue

    ✘  http://eslint.org/docs/rules/no-unused-vars  'VueApexCharts' is defined but never used
    src/renderer/components/HomePage.vue:22:10
      import VueApexCharts from 'vue-apexcharts'
              ^

    ✘  http://eslint.org/docs/rules/no-undef        'VueApexcharts' is not defined
    src/renderer/components/HomePage.vue:27:19
          apexcharts: VueApexcharts
Can't set locale settings in vue-apexcharts component.
import ru from "apexcharts/dist/locales/ru.json";

chartOptions: {
 locales: [ru],
 defaultLocale: "ru",
}
Installing the latest Apexcharts:
"apexcharts": "^2.1.4",
and then installing vue-apexcharts, I get:
warning " > [email protected]" has incorrect peer dependency "apexcharts@^1.4.12".
I believe this is because of:
  "peerDependencies": {
    "apexcharts": "^1.4.12"
  },
Is this correct that vue-apexcharts does not work with the latest apexcharts?
Hi
The annotations feature in ApexCharts doesn't dynamically calculate padding.
Attached is a screenshot of the annotations overlapping

I'm spend now hours trying to figure out how to display more than one chart inside one vue component.
<apexchart v-for="(item, index) in sensor_item_list" width="500" :id="index" type="area" :options="item.options" :series="item.seriesdata"></apexchart>
Usually i end up seeing all charts with same seriesdata.
async getDashboardItems(dashboard_id) {

    let currentObj = this;
    const res = await axios.get('/api/dashboard/' + dashboard_id + '/items/', {});

    var i;
    for (i = 0; i < res.data.length; i++) {

        let response = await axios.get('/api/sensors/' + sensor_id + '/data', {});
        var series = response.data.map(function (item)
        {

            let t = item.created_at.split(/[- :]/);
            var d = new Date(Date.UTC(t[0], t[1] - 1, t[2], t[3], t[4], t[5]));

            return [d, item.value];

        });
        currentObj.sensor_item_list[i].seriesdata[0].data = series;

    }

}
Would be more than happy if you could provide a example.
Hi, I have a dashboard, where I update some charts whenever the main chart is clicked.
I was able to update the charts with a button click, although, I am not able to do it when clicking a slice of the main pie chart.
Clicking a slice of the pie, throws the following error:

As per documentation, this is the code I use to receive the event:
            pieChartOptions1: {
                chart: {
                    events: {
                      dataPointSelection(event, chartContext, config) {
                        this.showPerDisciplineName(config.dataPointIndex)
                      },
                  }
                },
                ...
            }
Also, I have the method showPerDisciplineName declared in the methods section, and I can even access it from button clicks, so it shouldn't throw that error.
methods: {
  ...
  showPerDisciplineName(seriesIndex){
    ...
  }
}
I read all the documentation, so I believe the issue is not on my side.
Is there a way to access the Vue methods from the chart events?
Thanks!
Hey, I am using apexchart in my project and I want to create a card which have full width charts.
So, I dont need any labels, legend etc. But even if I remove everything still I have some space around chart. Which I dont want. I want to cover that card/div with only chart(No Spaces).
Problem Demo:
JSFiddle
What I Want:
I suppose this comes from the vue-wrapper since it works like a charm on the demo site. When I replace my series data in vue, the transitionning works but the chart is flickering just before.
See below :

Maybe we should update package.json requiring the last stable version of apexcharts? I had to manually include the https://cdn.jsdelivr.net/npm/apexcharts@latest script because the scatter chart is buggy, using the latest version if works correctly.
There is a problem with the element foreignObject containing legend that comes in front of chart element.
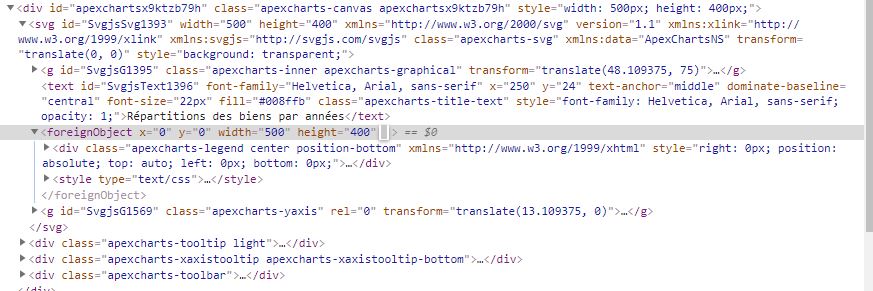
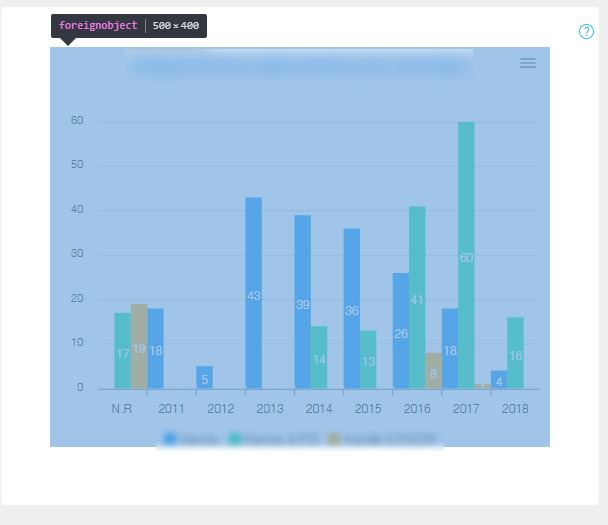
Because this elements is positionned after the chart element, we can't catch hover event to display tooltip and catch click on bar's of chart because this element has same height than global chart.
Hi,
I got this error when I try to do a v-if on a graph with brush option:
Cannot read property 'destroy' of null
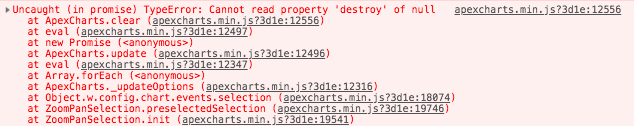
It breaks the navigation on the brush chart.
I'm using:
"apexcharts": "2.2.2",
"vue-apexcharts": "1.2.7"
Please click the Toggle button twice on the Codesandbox
(I reused your code from another issue. I only added this Toggle button on App.vue)
Hi there,
thanks for the great work on the dataURI issue. My jsPDF works perfect now.
In order to make it work with your vue wrapper I had to add the method in your vue-apexcharts.js:
methods: { ......
,
dataURI: function dataURI() {
return this.chart.dataURI();
}
You should insert it and release it :-)
Best!
Alex
A declarative, efficient, and flexible JavaScript library for building user interfaces.
🖖 Vue.js is a progressive, incrementally-adoptable JavaScript framework for building UI on the web.
TypeScript is a superset of JavaScript that compiles to clean JavaScript output.
An Open Source Machine Learning Framework for Everyone
The Web framework for perfectionists with deadlines.
A PHP framework for web artisans
Bring data to life with SVG, Canvas and HTML. 📊📈🎉
JavaScript (JS) is a lightweight interpreted programming language with first-class functions.
Some thing interesting about web. New door for the world.
A server is a program made to process requests and deliver data to clients.
Machine learning is a way of modeling and interpreting data that allows a piece of software to respond intelligently.
Some thing interesting about visualization, use data art
Some thing interesting about game, make everyone happy.
We are working to build community through open source technology. NB: members must have two-factor auth.
Open source projects and samples from Microsoft.
Google ❤️ Open Source for everyone.
Alibaba Open Source for everyone
Data-Driven Documents codes.
China tencent open source team.