Giter Club home page Giter Club logo

google-speedtest-chart's Introduction

google-speedtest-chart

Simple Python script to push speedtest results (using speedtest-cli) to a Google Docs spreadsheet. I use this to measure and track my upload and download bandwith:

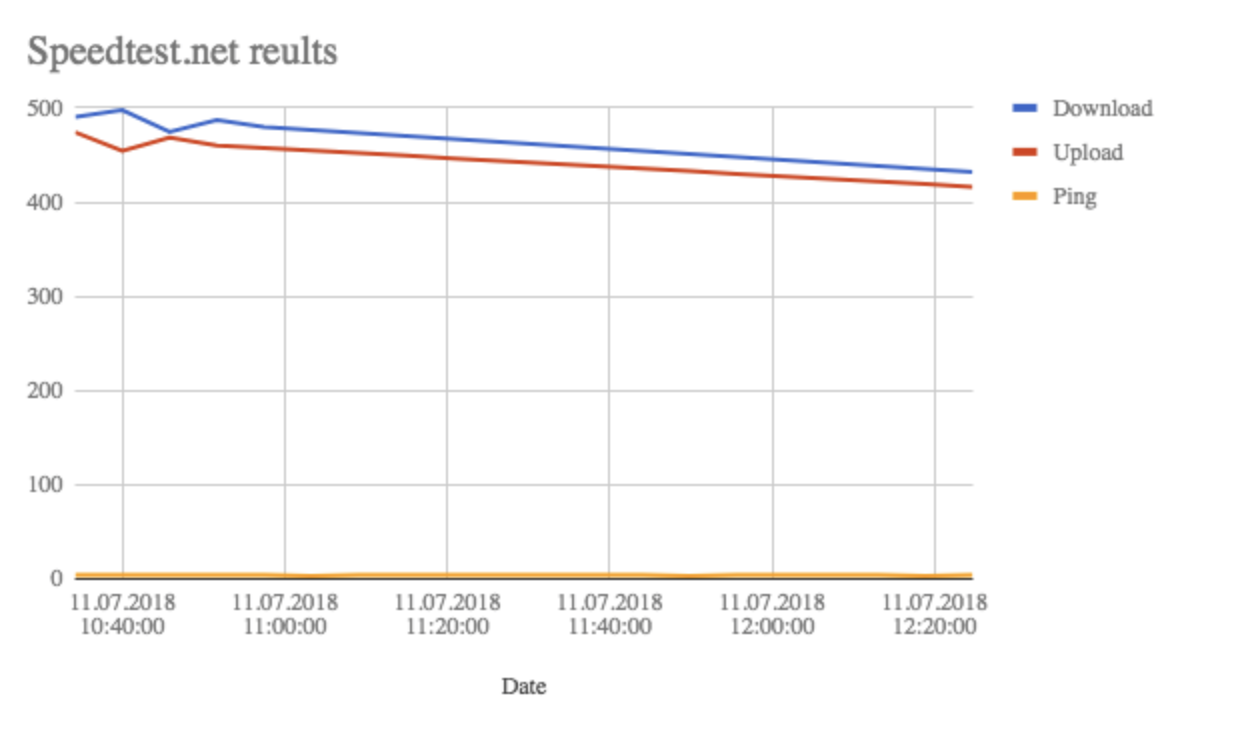
You can find an interactive demo (actually productive) version of the chart by clicking the image above.

Note: If you rather like Grafana than writing to a Google spreadsheet, checkout my new project docker-speedtest.

Requirements

Installation and usage

  1. Clone and open repository:

    git clone https://github.com/frdmn/google-speedtest-chart.git
    cd google-speedtest-chart
    
  2. Install dependencies:

    pip install -r requirements.txt
    
  3. Symlink it into your $PATH:

    ln -s speedtest-charts.py /usr/local/bin/speedtest-to-google
    
  4. Authorization

    1. ๐Ÿ“– Authorize pygsheets
    2. ๐Ÿ“– Create an OAuth token, download the credential file and and store it as credentials.json
  5. Create a spreadsheet dedicated to collect your speedtest results:

    ๐Ÿ“– docs/Create-a-spreadsheet-to-collect-data.md

  6. Run the script with default settings (make sure you have a spreadsheet document called "Speedtest"):

    speedtest-to-google
    

    Alternatively you can use the -w switch to set a custom spreadsheet name:

    speedtest-to-google -w Speedtest-document
    

    Here are some other arguments that are available:

    usage: speedtest-charts.py [-h] [-w, --workbookname WORKBOOKNAME] [-b, --bymonth]
    
    Simple Python script to push speedtest results (using speedtest-cli) to a Google Docs spreadsheet
    
    optional arguments:
      -h, --help            show this help message and exit
      -w, --workbookname WORKBOOKNAME
                        Sets the woorkbook name, default is "Speedtest"
      -b, --bymonth         Creats a new sheet for each month named MMM YYYY (ex: Jun 2018)
    

License

MIT

Version

1.7.0

google-speedtest-chart's People

Contributors

danielgrijalva avatar frdmn avatar kha-faz avatar lologhi avatar yepoleb avatar

Watchers

 avatar  avatar

Recommend Projects

  • React photo React

    A declarative, efficient, and flexible JavaScript library for building user interfaces.

  • Vue.js photo Vue.js

    ๐Ÿ–– Vue.js is a progressive, incrementally-adoptable JavaScript framework for building UI on the web.

  • Typescript photo Typescript

    TypeScript is a superset of JavaScript that compiles to clean JavaScript output.

  • TensorFlow photo TensorFlow

    An Open Source Machine Learning Framework for Everyone

  • Django photo Django

    The Web framework for perfectionists with deadlines.

  • D3 photo D3

    Bring data to life with SVG, Canvas and HTML. ๐Ÿ“Š๐Ÿ“ˆ๐ŸŽ‰

Recommend Topics

  • javascript

    JavaScript (JS) is a lightweight interpreted programming language with first-class functions.

  • web

    Some thing interesting about web. New door for the world.

  • server

    A server is a program made to process requests and deliver data to clients.

  • Machine learning

    Machine learning is a way of modeling and interpreting data that allows a piece of software to respond intelligently.

  • Game

    Some thing interesting about game, make everyone happy.

Recommend Org

  • Facebook photo Facebook

    We are working to build community through open source technology. NB: members must have two-factor auth.

  • Microsoft photo Microsoft

    Open source projects and samples from Microsoft.

  • Google photo Google

    Google โค๏ธ Open Source for everyone.

  • D3 photo D3

    Data-Driven Documents codes.