- BoxPlots
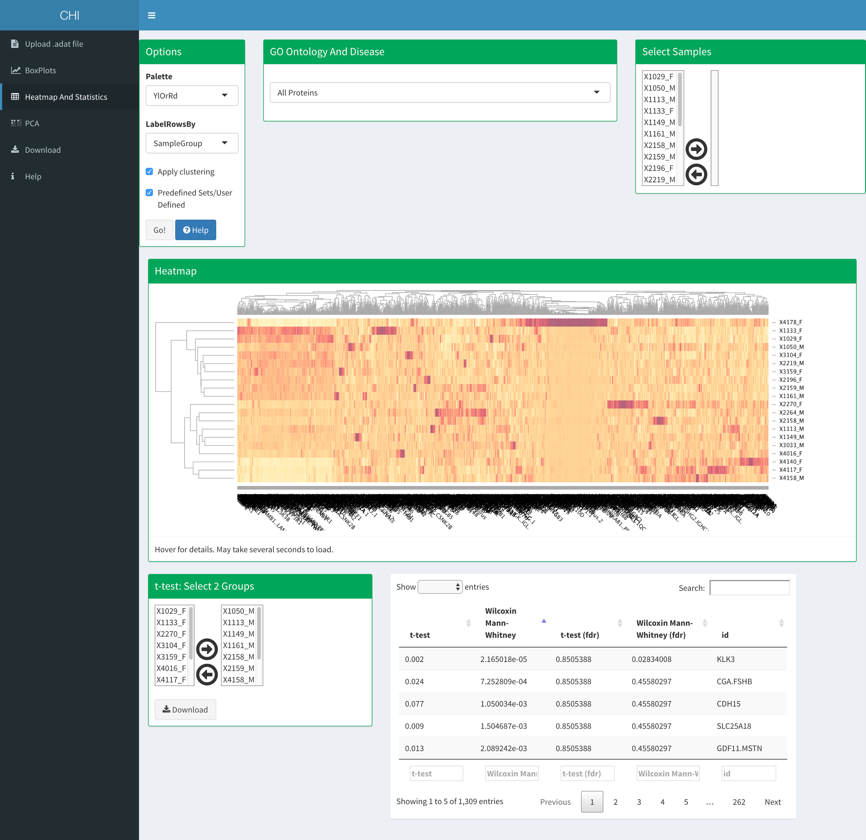
- Heatmap And Statistics
- PCA
- QC
- Explorer and discover new relationships
This web app is written using the shiny framework, a package from RStudio that can be used to build interactive web pages with R. The code is split into two parts, the user interface and the server-side containing the logic. The HTML widgets framework is used for binding JavaScript data visualizations in R and numerous HTML widgets and R packages are used including plotly, DT, d3heatmap, shinydashboard and ggplot2.The user interface is currently organized into the following dashboard tabs: “Upload ADAT file”, “BoxPlots”, “Heatmap And Statistics”, “PCA”, “Download” and “Help”.
To access the current version of the web application through a browser, visit https://foocheung.shinyapps.io/adat_v01/
To access the older MS version of the web application through a browser, visit foocheung.shinyapps.io/adat. Example data and video tutorials are available within the web tool link shown above.
This web tool is an open source project, and the source code is available at https://github.com/foocheung/adat
This web tool is licensed under the Apache licence. © Foo Cheung (2017)