altair-viz / pdvega Goto Github PK
View Code? Open in Web Editor NEWInteractive plotting for Pandas using Vega-Lite
Home Page: http://altair-viz.github.io/pdvega/
License: MIT License
Interactive plotting for Pandas using Vega-Lite
Home Page: http://altair-viz.github.io/pdvega/
License: MIT License


Even though this is not supported by pandas scatterplots, I would love to encode data with shape as in addition to color, x, y, and size.
This is a common pattern with pandas plots:
ax = df.plot.line()
df.plot.area(ax=ax)
We could do a similar thing by adding an ax argument to methods and using vega-lite layering internally... but corner cases may get a bit complicated.
vega3 is marked as decrepited, if I understood well.
This works fine.
df = pd.DataFrame(np.random.rand(5, 3))
df.vgplot.scatter(x=0, y=1, c=2)
But, if you want to use color and y based on same column, i.e column 1. It throws
df.vgplot.scatter(x=0, y=1, c=1)

---------------------------------------------------------------------------
ValueError                                Traceback (most recent call last)
<ipython-input-40-d247c37c9696> in <module>()
      1 df = pd.DataFrame(np.random.rand(5, 3))
----> 2 df.vgplot.scatter(x=0, y=1, c=1)

d:\apps\anaconda2\lib\site-packages\pdvega\_core.pyc in scatter(self, x, y, c, s, alpha, interactive, width, height, **kwds)
    504         spec = finalize_vegalite_spec(spec, interactive=interactive,
    505                                       width=width, height=height)
--> 506         return Axes(spec, data=data[cols])
    507
    508     def area(self, x=None, y=None, stacked=True, alpha=None,

d:\apps\anaconda2\lib\site-packages\pdvega\_axes.pyc in __init__(self, spec, data)
      5     """Class representing a pdvega plot axes"""
      6     def __init__(self, spec=None, data=None):
----> 7         self.vlspec = VegaLite(spec, data)
      8
      9     @property

d:\apps\anaconda2\lib\site-packages\vega3\base.pyc in __init__(self, spec, data)
     21         """Initialize the visualization object."""
     22         spec = utils.nested_update(copy.deepcopy(self.DEFAULTS), spec)
---> 23         self.spec = self._prepare_spec(spec, data)
     24
     25     def _prepare_spec(self, spec, data):

d:\apps\anaconda2\lib\site-packages\vega3\vegalite.pyc in _prepare_spec(self, spec, data)
     15
     16     def _prepare_spec(self, spec, data):
---> 17         return prepare_spec(spec, data)
     18
     19

d:\apps\anaconda2\lib\site-packages\vega3\utils.pyc in prepare_spec(spec, data)
     86         # We have to do the isinstance test first because we can't
     87         # compare a DataFrame to None.
---> 88         data = sanitize_dataframe(data)
     89         spec['data'] = {'values': data.to_dict(orient='records')}
     90     elif data is None:

d:\apps\anaconda2\lib\site-packages\vega3\utils.pyc in sanitize_dataframe(df)
     64             # For floats, convert nan->None: np.float is not JSON serializable
     65             col = df[col_name].astype(object)
---> 66             df[col_name] = col.where(col.notnull(), None)
     67         elif str(dtype).startswith('datetime'):
     68             # Convert datetimes to strings

e:\github\pandas\pandas\core\frame.pyc in __setitem__(self, key, value)
   2547         else:
   2548             # set column
-> 2549             self._set_item(key, value)
   2550
   2551     def _setitem_slice(self, key, value):

e:\github\pandas\pandas\core\frame.pyc in _set_item(self, key, value)
   2623         self._ensure_valid_index(value)
   2624         value = self._sanitize_column(key, value)
-> 2625         NDFrame._set_item(self, key, value)
   2626
   2627         # check if we are modifying a copy

e:\github\pandas\pandas\core\generic.pyc in _set_item(self, key, value)
   2290
   2291     def _set_item(self, key, value):
-> 2292         self._data.set(key, value)
   2293         self._clear_item_cache()
   2294

e:\github\pandas\pandas\core\internals.pyc in set(self, item, value, check)
   3992         removed_blknos = []
   3993         for blkno, val_locs in _get_blkno_placements(blknos, len(self.blocks),
-> 3994                                                      group=True):
   3995             blk = self.blocks[blkno]
   3996             blk_locs = blklocs[val_locs.indexer]

e:\github\pandas\pandas\core\internals.pyc in _get_blkno_placements(blknos, blk_count, group)
   5020
   5021     # FIXME: blk_count is unused, but it may avoid the use of dicts in cython
-> 5022     for blkno, indexer in lib.get_blkno_indexers(blknos, group):
   5023         yield blkno, BlockPlacement(indexer)
   5024

e:\github\pandas\pandas\_libs\lib.pyx in pandas._libs.lib.get_blkno_indexers()
   1164 @cython.boundscheck(False)
   1165 @cython.wraparound(False)
-> 1166 def get_blkno_indexers(int64_t[:] blknos, bint group=True):
   1167     """
   1168     Enumerate contiguous runs of integers in ndarray.

ValueError: Buffer has wrong number of dimensions (expected 1, got 0)
Is this expected? If not, happy to work on the patch.
I recently brought pdvega to the Anaconda users community through the conda-forge channel. you can now install it with:
conda install -c conda-forge pdvega
Thanks for this awesome tool.
-Eddie
We should use the MarkConfig stroke style to match pandas linestyle.
Please advise.
My dataframe have two columns with different scale, I'd like twinx function as Matplotlib
import numpy as np
import matplotlib.pyplot as plt

fig, ax1 = plt.subplots()
t = np.arange(0.01, 10.0, 0.01)
s1 = np.exp(t)
ax1.plot(t, s1, 'b-')
ax1.set_xlabel('time (s)')
# Make the y-axis label, ticks and tick labels match the line color.
ax1.set_ylabel('exp', color='b')
ax1.tick_params('y', colors='b')

ax2 = ax1.twinx()
s2 = np.sin(2 * np.pi * t)
ax2.plot(t, s2, 'r.')
ax2.set_ylabel('sin', color='r')
ax2.tick_params('y', colors='r')

fig.tight_layout()
plt.show()As a rule, I think we should use Altair code internally rather than dicts... it will make things easier to debug if and when Vega-Lite/Altair changes.
e.g. {'maxbins': 10} should be alt.Bin(maxbins=10) etc.
It looks like binder isn't set up correctly - the environment seems to be missing the altair dependency:

For line plots where x is specified, we should use the order encoding to match the behavior pd.plot
Hi!
http://jakevdp.github.io/pdvega/ gives error 404
How can I get docs?
Hi! Thanks for this very cool library!
My goal is to plot a DataFrame which represents a time series.
I'd like to use these encoding channels in my plot:
x channel is the period column,y channel is the value column,color channel is the series_code column.I'm wondering if the line plot isn't missing a c= keyword, like the scatter plot.
What do you think about it?
http://altair-viz.github.io/pdvega/ uses @jakevdp's old repo and thus the examples don't work.
fixed first one locally, need to look into second
pdvega could add an entrypoint to register itself with pandas: https://dev.pandas.io/development/extending.html#plotting-backends
Something like
# in setup.py
setup(  # noqa: F821
    ...,
    entry_points={
        "pandas_plotting_backends": [
            "altair = pdvega.<module>",
        ],
    },
)
where <module> is whatever module has the plot top-level method with the right signature.
as for now, any vgplot will provide color encoding, which creates color legend, even if there is only one category/color
it seems can`t work in zeppelin

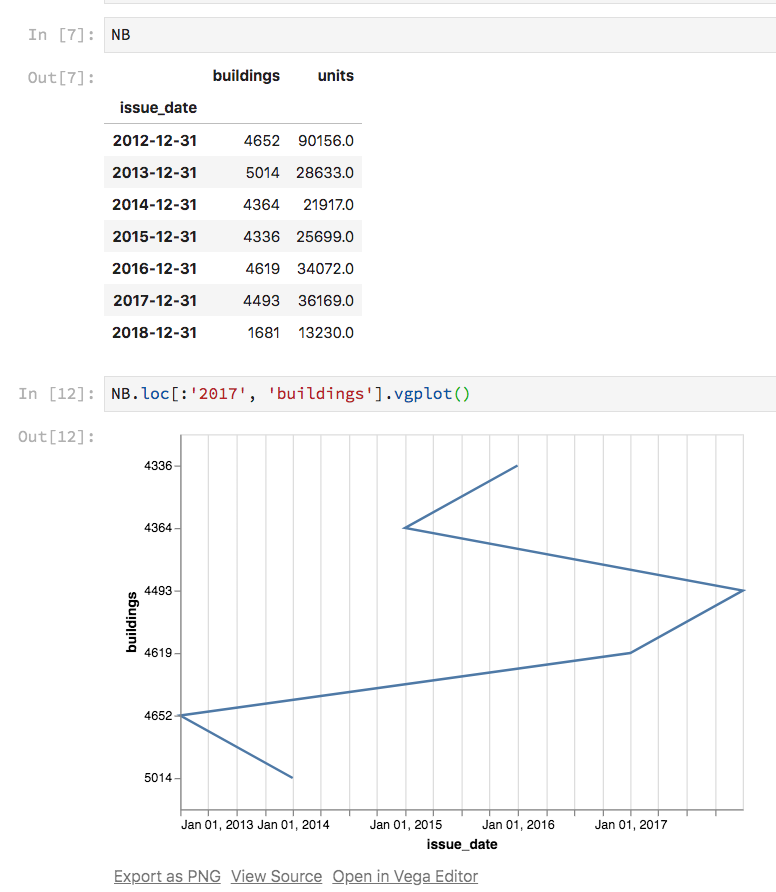
The plotting library doesn't seem to work when I try and plot a datetime object. It can handle just dates but when there is an associated time the plot builds without error but no line is plotted.
Code here that doesn't work:
import pandas as pd
import matplotlib.pyplot as plt
import pdvega
rng = pd.date_range('1/1/2011', periods=72, freq='H')
rng = [pd.Timestamp(r) for r in rng]
ts = pd.Series(np.random.randn(len(rng)), index=rng)
ts.vgplot.line() #this doesn't throw any errors but no data is shown
ts.plot() #this works on the other hand
plt.show()
the current version of pdvega will not work in JupyterLab: the main reason is that the new MIME-based rendering used by JupyterLab is not yet supported in the vega3 library that pdvega depends on
Just wanted to clarify that this is correct, even with the vega3 jupyterlab extension?
If that is the case I guess this can be kept open to track any progress...
As soon as Altair supports Vega-Lite 2, pdvega should output Altair objects for further customization.
Maybe a bit niche, but ran into this issue with lineplot: if there is a column of all np.nan, then it is ignored, but if there is a column of all None, then it makes the plot really wacky.
Generate some data:
import pandas as pd
import numpy as np
import pdvega
%matplotlib inline

# generate some data
np.random.seed(111)
df = pd.DataFrame(np.random.randn(50, 4),
        index=pd.date_range('1/1/2000', periods=50),
                  columns=list('ABCD'))
df = df.cumsum()
# this plot is fine
df.vgplot()
# this column is ignored in the plot
df['nan'] = np.nan
df.vgplot()
(looks the same as above)
# this column makes everything weird
df['none'] = None
df.vgplot()
Oddly enough this doesn't happen if the A and B columns are int:
np.random.seed(111)
df = pd.DataFrame(np.random.randint(low=0, high=5, size=[50, 2]),
        index=pd.date_range('1/1/2000', periods=50),
                  columns=list('AB'))
df = df.cumsum()

# add a column of all none
df['nan'] = np.nan

# add a column of all none
df['none'] = None
df.vgplot()
Trying to plot a df with 25 columns using the vgplot method results in a legend that extends the graph vertically. How can we implement the pandas plotting behavior of:
df.plot(legend=False)
trying to use pdvega like in documentation anytime I get the error message 'module 'pandas.core' has no attribute 'index''
e.g.
import numpy as np
import pandas as pd
import pdvega
from vega_datasets import data
iris = data.iris()
pdvega.andrews_curves(iris, 'species')
I am using python 3.8
I think it is because pandas deprecated index
A declarative, efficient, and flexible JavaScript library for building user interfaces.
🖖 Vue.js is a progressive, incrementally-adoptable JavaScript framework for building UI on the web.
TypeScript is a superset of JavaScript that compiles to clean JavaScript output.
An Open Source Machine Learning Framework for Everyone
The Web framework for perfectionists with deadlines.
A PHP framework for web artisans
Bring data to life with SVG, Canvas and HTML. 📊📈🎉
JavaScript (JS) is a lightweight interpreted programming language with first-class functions.
Some thing interesting about web. New door for the world.
A server is a program made to process requests and deliver data to clients.
Machine learning is a way of modeling and interpreting data that allows a piece of software to respond intelligently.
Some thing interesting about visualization, use data art
Some thing interesting about game, make everyone happy.
We are working to build community through open source technology. NB: members must have two-factor auth.
Open source projects and samples from Microsoft.
Google ❤️ Open Source for everyone.
Alibaba Open Source for everyone
Data-Driven Documents codes.
China tencent open source team.