Tools for parsing ceph logs to help with troubleshooting various issues.
NOTE: I've shortened the sample outputs below with elipses for the sake of brevity.
- Run with ceph.log and redirect output to a CSV
./ceph_log_parser.awk ceph.log > ceph-log-parsed.csv
./ceph_log_parser.awk -v osdtree=ceph_osd_tree.txt -v timeinterval=60 -v bucketsummary=1 ceph.log > ceph-log-parsed.csv
Available options:
  -v osdtree=ceph_osd_tree.txt
      If provided, the osd output portion will be output with its branch path in the crushmap

  -v timeinterval=(1|10|60|day)
      If provided, adjusts the time alignment for the histogram output.  Default is 10 (minutes)

  -v bucketsummary=1
      If provided, provides an output below the OSD data summarizing the OSD counts for each
      successive bucket branch above the OSD ( example: host, rack, row, root )
      Default is 1 if 'osdtree' is defined.

  -v osdhisto=1
      Provides a column per OSD in the time histogram showing initial 'slow request' entries
      incurred by that OSD during the time interval.
      Default is disabled because this can make VERY wide spreadsheets

  NOTE: These options MUST be specified **BEFORE** the ceph.log file, otherwise they will be
        ignored
-
For items which are average, these are summed and averaged over the measurement interval The measurement is reported at the beginning of the interval measurement period
e.g IO: Client Read MB/s for 03:30 to 03:40 is averaged, then reported on the 03:30 line
-
For items which are a static snapshot, these are reported based on the last line containing those details in the log before the end of the measurement interval
e.g. PG: active for 03:30 to 03:40 - If a pgmap is found at 03:39:59, that will be the one reported for the 03:30 line
-
For items like the Slow requests, the count of those entries is summed during the measured period and reported
e.g. If there are 50 'slow request ' logs in the 10 minute interval which are for a primary OSD, then 50 is reported If there are 50 'slow request ' logs 'waiting for subop', then the OSDs called out by the subop (comma separated numbers), are all counted in the 'Slow SubOp' line. For 3x replication, and 50 lines, the reported number would be 100 (due to 2x non-primary copies * 50 lines)
-
NOTE: Slow request processing has changed as of 27 Feb 2018. The intial slow request (delay < 60 seconds) and relogged slow requests ( delay>60 seconds ) are logged separately to better understand if an issue is ongoing.
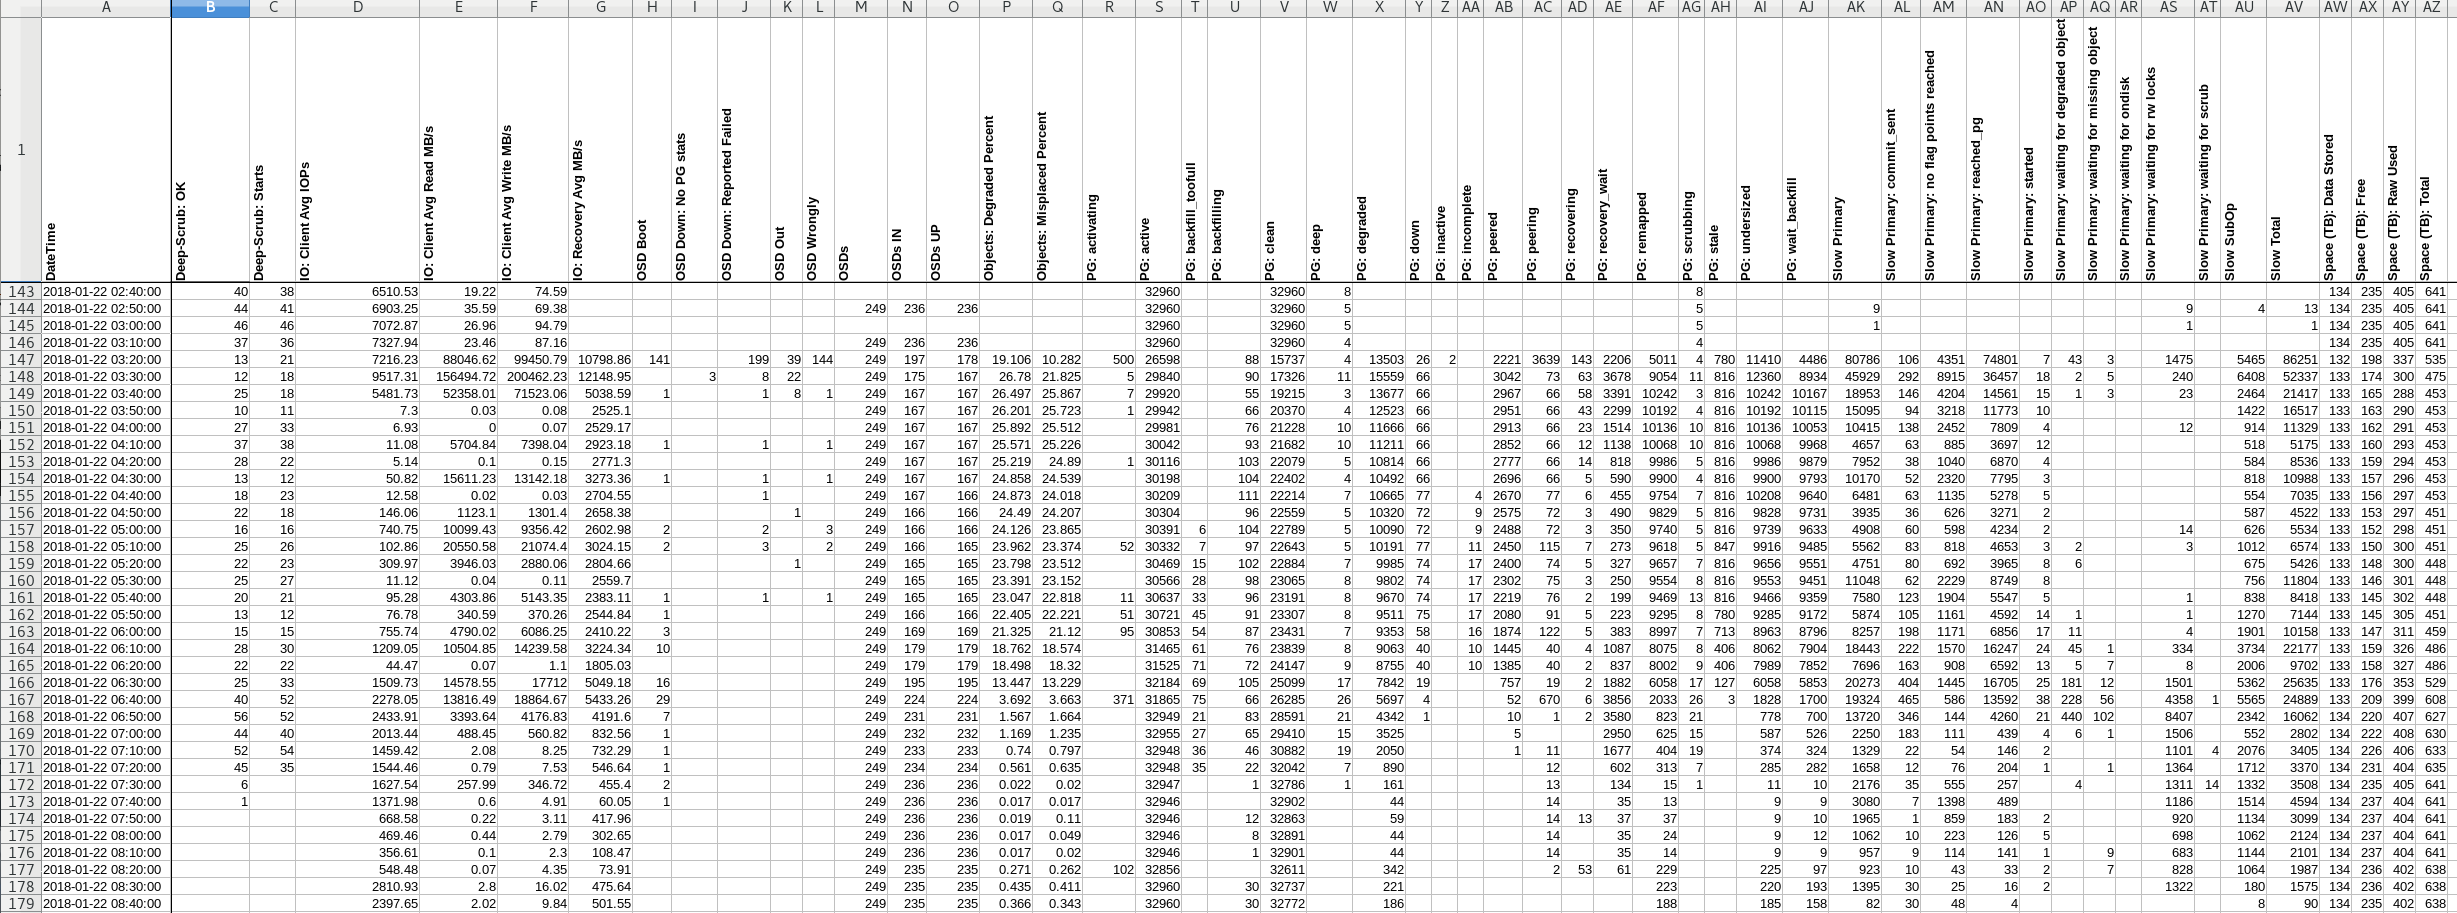
- This command output among all others really should be looked at in a spreadsheet tool. I typically highlight the headers (at the top of each section), bold them, rotate them so the text is vertical, then auto-adjust the column widths to get a more concise view which is much easier to visually parse. Graphing of the data in this report can also make trends stand out and help with reducing the scope for hunting faulting components.
# ./ceph_log_parser.awk -v osdtree=ceph_osd_tree.txt -v timeinterval=10 -v bucketsummary=1 ceph.log > ~/ceph-log-parsed.csv
# cat ~/ceph-log-parsed.csv
DateTime,Deep-Scrub: OK,Deep-Scrub: Starts,IO: Client Avg IOPs,IO: Client Avg Read MB/s,IO: Client Avg Write MB/s,IO: Recovery Avg MB/s,OSD Boot,OSD Down: No PG stats,OSD Down: Reported Failed,OSD Out,
OSD Wrongly,OSDs,OSDs IN,OSDs UP,Objects: Degraded Percent,Objects: Misplaced Percent,PG: activating,PG: active,PG: backfill_toofull,PG: backfilling,PG: clean,PG: deep,PG: degraded,PG: down,PG: inactiv
e,PG: incomplete,PG: peered,PG: peering,PG: recovering,PG: recovery_wait,PG: remapped,PG: scrubbing,PG: stale,PG: undersized,PG: wait_backfill,Slow Primary,Slow Primary: commit_sent,Slow Primary: no fl
ag points reached,Slow Primary: reached_pg,Slow Primary: started,Slow Primary: waiting for degraded object,Slow Primary: waiting for missing object,Slow Primary: waiting for ondisk,Slow Primary: waitin
g for rw locks,Slow Primary: waiting for scrub,Slow SubOp,Slow Total,Space (TB): Data Stored,Space (TB): Free,Space (TB): Raw Used,Space (TB): Total
2018-01-21 03:10:00,,6,,,,,,,,,,,,,,,,,,,,,,,,,,,,,,,,,,,,,,,,,,,,,,,,,
2018-01-21 03:20:00,19,12,10193.47,132.71,86.42,,,,,,,249,236,236,,,,32960,,,32960,,,,,,,,,,,,,,,,,,,,,,,,,,,133.00,235.00,405.00,641.00
2018-01-21 03:30:00,6,7,11243.27,214.92,70.60,,,,,,,,,,,,,32960,,,32960,1,,,,,,,,,,1,,,,,,,,,,,,,,,,133.00,235.00,405.00,641.00
2018-01-21 03:40:00,9,8,9566.01,202.62,73.42,,,,,,,249,236,236,,,,32960,,,32960,,,,,,,,,,,,,,,,,,,,,,,,,,,133.00,235.00,405.00,641.00
2018-01-21 03:50:00,1,1,8549.33,163.93,71.18,,,,,,,249,236,236,,,,32960,,,32960,,,,,,,,,,,,,,,,,,,,,,,,,,,133.00,235.00,405.00,641.00
2018-01-21 04:00:00,,,8331.46,121.57,65.20,,,,,,,,,,,,,32960,,,32960,,,,,,,,,,,,,,,,,,,,,,,,,,,133.00,235.00,405.00,641.00
2018-01-21 04:10:00,11,13,7480.16,58.25,80.61,,,,,,,249,236,236,,,,32960,,,32960,2,,,,,,,,,,2,,,,,,,,,,,,,,,,133.00,235.00,405.00,641.00
2018-01-21 04:20:00,13,11,7202.10,41.08,66.31,,,,,,,,,,,,,32960,,,32960,,,,,,,,,,,,,,,,,,,,,,,,,,,133.00,235.00,405.00,641.00
...
2018-01-22 03:20:00,13,21,7216.23,88046.62,99450.79,0.00,141,,199,39,144,249,197,178,19.106,10.282,500,26598,,88,15737,4,13503,26,2,,2221,3639,143,2206,5011,4,780,11410,4486,80786,106,4351,74801,7,43,3,,1475,,5465,86251,132.00,198.00,337.00,535.00
2018-01-22 03:30:00,12,18,9517.31,156494.72,200462.23,0.00,,3,8,22,,249,175,167,26.780,21.825,5,29840,,90,17326,11,15559,66,,,3042,73,63,3678,9054,11,816,12360,8934,45929,292,8915,36457,18,2,5,,240,,6408,52337,133.00,174.00,300.00,475.00
2018-01-22 03:40:00,25,18,5481.73,52358.01,71523.06,0.00,1,,1,8,1,249,167,167,26.497,25.867,7,29920,,55,19215,3,13677,66,,,2967,66,58,3391,10242,3,816,10242,10167,18953,146,4204,14561,15,1,3,,23,,2464,21417,133.00,165.00,288.00,453.00
2018-01-22 03:50:00,10,11,7.30,0.03,0.08,0.00,,,,,,249,167,167,26.201,25.723,1,29942,,66,20370,4,12523,66,,,2951,66,43,2299,10192,4,816,10192,10115,15095,94,3218,11773,10,,,,,,1422,16517,133.00,163.00,290.00,453.00
2018-01-22 04:00:00,27,33,6.93,0.00,0.07,0.00,,,,,,249,167,167,25.892,25.512,,29981,,76,21228,10,11666,66,,,2913,66,23,1514,10136,10,816,10136,10053,10415,138,2452,7809,4,,,,12,,914,11329,133.00,162.00,291.00,453.00
2018-01-22 04:10:00,37,38,11.08,5704.84,7398.04,0.00,1,,1,,1,249,167,167,25.571,25.226,,30042,,93,21682,10,11211,66,,,2852,66,12,1138,10068,10,816,10068,9968,4657,63,885,3697,12,,,,,,518,5175,133.00,160.00,293.00,453.00
2018-01-22 04:20:00,28,22,5.14,0.10,0.15,0.00,,,,,,249,167,167,25.219,24.890,1,30116,,103,22079,5,10814,66,,,2777,66,14,818,9986,5,816,9986,9879,7952,38,1040,6870,4,,,,,,584,8536,133.00,159.00,294.00,453.00
2018-01-22 04:30:00,13,12,50.82,15611.23,13142.18,0.00,1,,1,,1,249,167,167,24.858,24.539,,30198,,104,22402,4,10492,66,,,2696,66,5,590,9900,4,816,9900,9793,10170,52,2320,7795,3,,,,,,818,10988,133.00,157.00,296.00,453.00
2018-01-22 04:40:00,18,23,12.58,0.02,0.03,0.00,,,1,,,249,167,166,24.873,24.018,,30209,,111,22214,7,10665,77,,4,2670,77,6,455,9754,7,816,10208,9640,6481,63,1135,5278,5,,,,,,554,7035,133.00,156.00,297.00,453.00
2018-01-22 04:50:00,22,18,146.06,1123.10,1301.40,0.00,,,,1,,249,166,166,24.490,24.207,,30304,,96,22559,5,10320,72,,9,2575,72,3,490,9829,5,816,9828,9731,3935,36,626,3271,2,,,,,,587,4522,133.00,153.00,297.00,451.00
2018-01-22 05:00:00,16,16,740.75,10099.43,9356.42,0.00,2,,2,,3,249,166,166,24.126,23.865,,30391,6,104,22789,5,10090,72,,9,2488,72,3,350,9740,5,816,9739,9633,4908,60,598,4234,2,,,,14,,626,5534,133.00,152.00,298.00,451.00
2018-01-22 05:10:00,25,26,102.86,20550.58,21074.40,0.00,2,,3,,2,249,166,165,23.962,23.374,52,30332,7,97,22643,5,10191,77,,11,2450,115,7,273,9618,5,847,9916,9485,5562,83,818,4653,3,2,,,3,,1012,6574,133.00,150.00,300.00,451.00
...
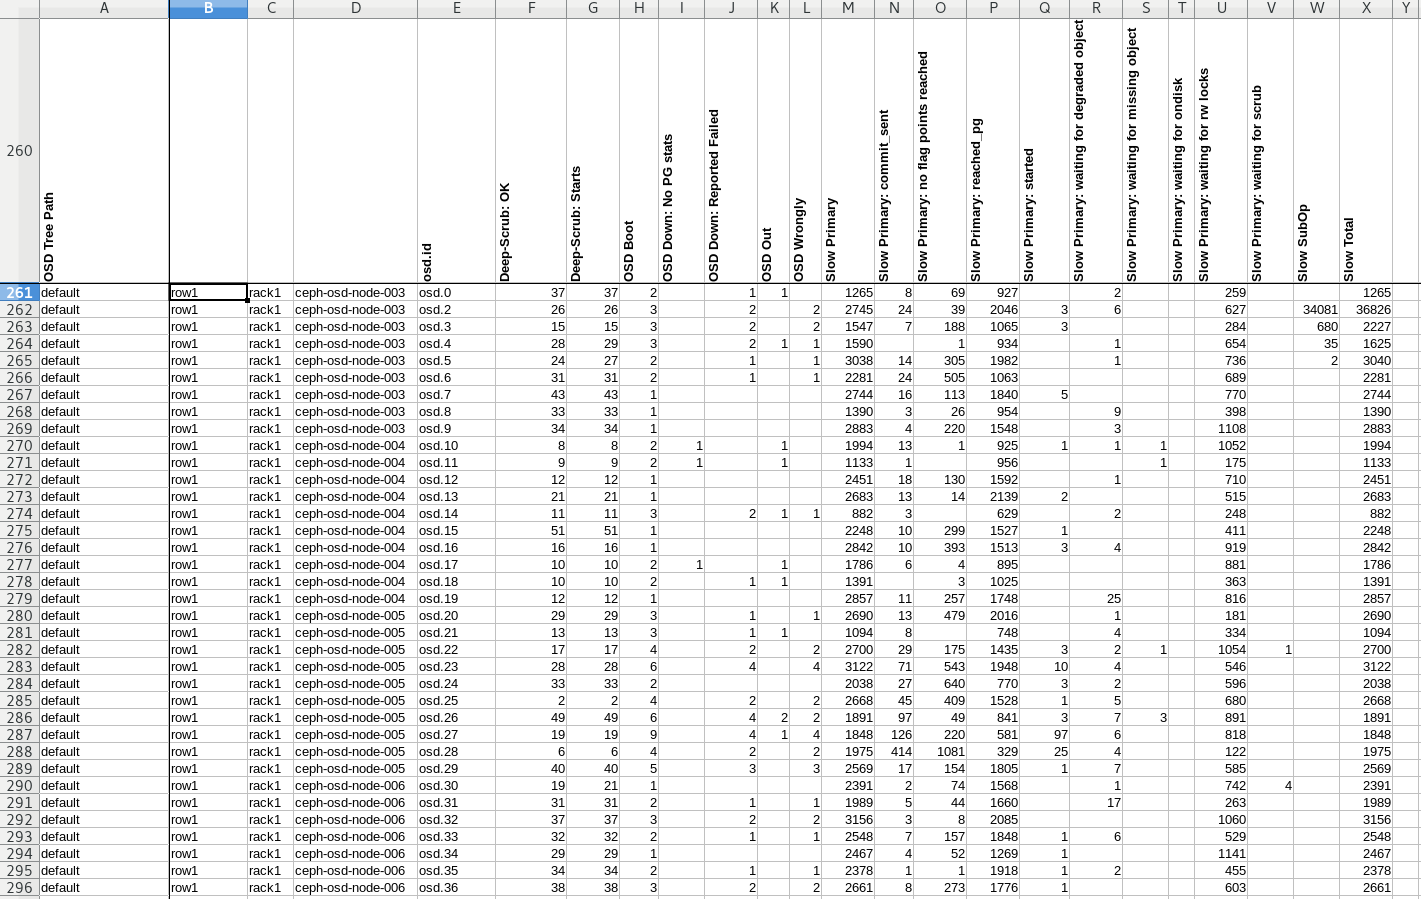
OSD Tree Path,,,,osd.id,Deep-Scrub: OK,Deep-Scrub: Starts,OSD Boot,OSD Down: No PG stats,OSD Down: Reported Failed,OSD Out,OSD Wrongly,Slow Primary,Slow Primary: commit_sent,Slow Primary: no flag points reached,Slow Primary: reached_pg,Slow Primary: started,Slow Primary: waiting for degraded object,Slow Primary: waiting for missing object,Slow Primary: waiting for ondisk,Slow Primary: waiting for rw locks,Slow Primary: waiting for scrub,Slow SubOp,Slow Total
default,row1,rack1,osd-node-003,osd.0,37,37,2,,1,1,,1265,8,69,927,,2,,,259,,,1265
default,row1,rack1,osd-node-003,osd.2,26,26,3,,2,,2,2745,24,39,2046,3,6,,,627,,34081,36826
default,row1,rack1,osd-node-003,osd.3,15,15,3,,2,,2,1547,7,188,1065,3,,,,284,,680,2227
default,row1,rack1,osd-node-003,osd.4,28,29,3,,2,1,1,1590,,1,934,,1,,,654,,35,1625
default,row1,rack1,osd-node-003,osd.5,24,27,2,,1,,1,3038,14,305,1982,,1,,,736,,2,3040
default,row1,rack1,osd-node-003,osd.6,31,31,2,,1,,1,2281,24,505,1063,,,,,689,,,2281
default,row1,rack1,osd-node-003,osd.7,43,43,1,,,,,2744,16,113,1840,5,,,,770,,,2744
default,row1,rack1,osd-node-003,osd.8,33,33,1,,,,,1390,3,26,954,,9,,,398,,,1390
default,row1,rack1,osd-node-003,osd.9,34,34,1,,,,,2883,4,220,1548,,3,,,1108,,,2883
default,row1,rack1,osd-node-004,osd.10,8,8,2,1,,1,,1994,13,1,925,1,1,1,,1052,,,1994
default,row1,rack1,osd-node-004,osd.11,9,9,2,1,,1,,1133,1,,956,,,1,,175,,,1133
...
default,row1,rack2,osd-node-029,,915,915,31,0,21,4,17,12717,341,2732,7155,32,38,1,0,2418,0,0,12717
default,row1,rack2,osd-node-028,,496,497,26,0,16,2,14,17615,124,2223,12062,14,30,0,0,3162,0,0,17615
default,row1,rack2,osd-node-027,,154,154,20,0,11,3,7,13095,224,1753,7253,12,54,14,0,3785,0,0,13095
default,row1,rack2,osd-node-026,,445,445,22,0,12,3,9,15869,578,3750,7262,19,43,35,0,4182,0,0,15869
default,row1,rack2,osd-node-025,,720,720,18,0,10,3,7,16185,123,1691,9394,14,30,3,0,4930,0,0,16185
default,row1,rack2,osd-node-024,,882,882,24,0,13,4,10,21237,384,3710,8365,25,62,47,0,8643,1,0,21237
default,row1,rack2,osd-node-023,,564,564,19,0,10,1,9,16237,38,1062,11968,1,30,5,0,3133,0,0,16237
default,row1,rack2,osd-node-022,,521,521,18,0,9,1,8,21534,66,1261,14698,11,40,4,0,5454,0,0,21534
...
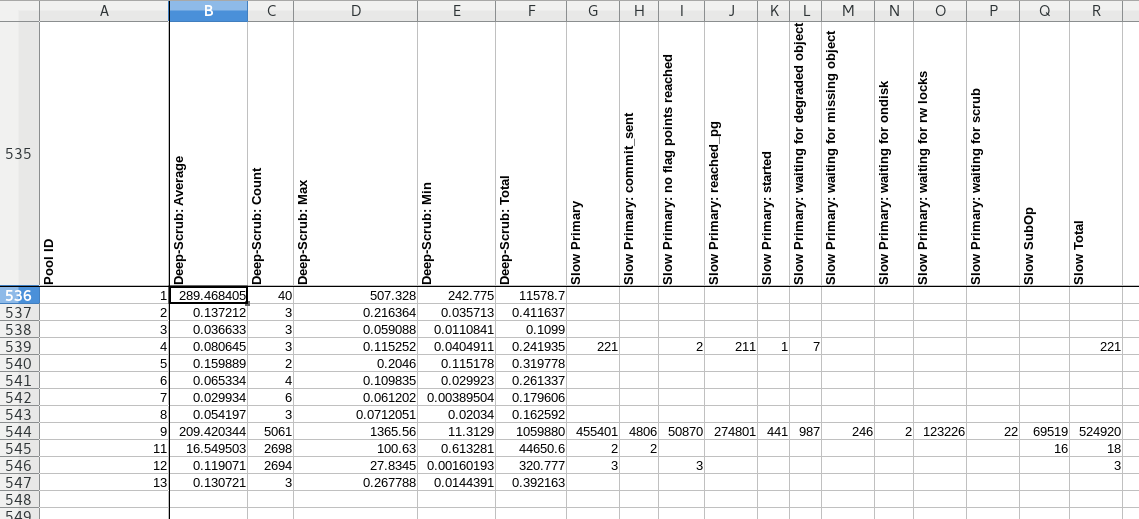
Pool ID,Deep-Scrub: Average,Deep-Scrub: Count,Deep-Scrub: Max,Deep-Scrub: Min,Deep-Scrub: Total,Slow Primary,Slow Primary: commit_sent,Slow Primary: no flag points reached,Slow Primary: reached_pg,Slow Primary: started,Slow Primary: waiting for degraded object,Slow Primary: waiting for missing object,Slow Primary: waiting for ondisk,Slow Primary: waiting for rw locks,Slow Primary: waiting for scrub,Slow SubOp,Slow Total
1,289.468405,40,507.328,242.775,11578.7,,,,,,,,,,,,
2,0.137212,3,0.216364,0.035713,0.411637,,,,,,,,,,,,
3,0.036633,3,0.059088,0.0110841,0.1099,,,,,,,,,,,,
4,0.080645,3,0.115252,0.0404911,0.241935,221,,2,211,1,7,,,,,,221
5,0.159889,2,0.2046,0.115178,0.319778,,,,,,,,,,,,
6,0.065334,4,0.109835,0.029923,0.261337,,,,,,,,,,,,
7,0.029934,6,0.061202,0.00389504,0.179606,,,,,,,,,,,,
8,0.054197,3,0.0712051,0.02034,0.162592,,,,,,,,,,,,
9,209.420344,5061,1365.56,11.3129,1.05988e+06,455401,4806,50870,274801,441,987,246,2,123226,22,69519,524920
11,16.549503,2698,100.63,0.613281,44650.6,2,2,,,,,,,,,16,18
12,0.119071,2694,27.8345,0.00160193,320.777,3,,3,,,,,,,,,3
13,0.130721,3,0.267788,0.0144391,0.392163,,,,,,,,,,,,
- Provide the
ceph.logand this script will provide an output showing the time between the start and stop of every deep-scrub. The output format is csv, with the first column being the deep-scrub time in seconds, second column being the 'deep-scrub' line which stopped the timer. The start/stop lines are keyed on the pg.id. At the end of the processing, a Min,Avg,Max output is also provided, along with the 'deep-scrub' completed line for the Min and Max processing times.
# ./deep-scrub_timing.awk /var/log/ceph/ceph.log > ~/deep-scrub_timings.csv
# cat ~/deep-scrub_timings.csv

0.0155821,2018-01-16 03:44:06.068707 osd.764 10.129.152.42:6851/3796002 4467 : cluster [INF] 29.243 deep-scrub ok
0.0110428,2018-01-16 03:44:11.223353 osd.447 10.129.152.33:6851/3784262 4900 : cluster [INF] 29.5ad deep-scrub ok
0.0009799,2018-01-16 03:45:59.345522 osd.927 10.129.152.50:6836/2106288 6823 : cluster [INF] 20.e9 deep-scrub ok
0.002249,2018-01-16 03:46:04.488109 osd.284 10.129.152.30:6848/3526172 4303 : cluster [INF] 18.2f deep-scrub ok
0.000980854,2018-01-16 03:47:26.628785 osd.540 10.129.152.40:6824/4041304 5864 : cluster [INF] 23.238 deep-scrub ok
0.00139022,2018-01-16 03:47:27.402259 osd.684 10.129.152.42:6818/3777592 5148 : cluster [INF] 17.26d deep-scrub ok
...
Min,Avg,Max
0.000564098,248.451,846.795
Min Req: 2018-01-16 11:28:00.908817 osd.4 10.129.152.25:6837/3496196 5784 : cluster [INF] 48.32 deep-scrub ok
Max Req: 2018-01-17 01:13:12.793967 osd.131 10.129.152.23:6814/3605203 3452 : cluster [INF] 30.7f7 deep-scrub ok
- Provide a 'ceph.log', this script will output a CSV file that can be graphed to understand the IOPs histogram for the time covered by the ceph.log. Left column is thousand IOPs, right column is how many 'pgmap' entries fall into that thousand.
# ./iops_histo.sh ceph.log > iops_histo.csv
# cat iops_histo.csv

0,628
1,124
2,1986
3,8339
4,4218
5,3705
6,3233
7,2574
8,2013
9,1453
10,890
11,607
12,413
13,349
14,287
15,238
16,252
17,214
18,173
- Provide a 'ceph.log' and the text file output of 'ceph osd tree' and this script will output a count of slow requests (local, subop and total),'failed', 'boot' and 'wrongly marked me down' entries mapped to the leaf / buckets to which they were reported against.
# ceph osd tree > ceph_osd_tree.txt
# ./map_events_to_buckets.sh ceph.log ceph_osd_tree.txt > events.csv
Searching for... slow, subops, failed, boot, wrongly marked down

# cat events.csv

buckets...,slow primary,slow subop, total slow,failed,boot,wrongly down
default,rack1,ceph-storage-003,osd.0,775,398,1173,174,174,176
default,rack1,ceph-storage-003,osd.6,725,171,896,175,176,176
default,rack1,ceph-storage-003,osd.10,618,352,970,177,177,179
default,rack1,ceph-storage-003,osd.15,578,829,1407,175,175,176
...
default,rack1,ceph-storage-003,6831,3842,10673,1741,1742,1750,
default,rack1,ceph-storage-004,osd.423,783,397,1180,174,174,175
default,rack1,ceph-storage-004,osd.425,882,517,1399,171,171,171
default,rack1,ceph-storage-004,osd.427,784,795,1579,177,177,177
default,rack1,ceph-storage-004,osd.429,715,327,1042,169,169,167
...
default,rack1,ceph-storage-004,7238,6809,14047,1725,1726,1727,
...
default,rack1,86695,83655,170350,13597,13621,13669,
default,rack2,ceph-storage-020,osd.149,720,573,1293,172,172,172
default,rack2,ceph-storage-020,osd.153,913,140,1053,170,170,175
default,rack2,ceph-storage-020,osd.158,1107,487,1594,170,171,173
default,rack2,ceph-storage-020,osd.163,989,248,1237,170,170,170
...
default,rack2,ceph-storage-020,7801,3220,11021,1711,1714,1720,
default,rack2,ceph-storage-021,osd.150,552,178,730,0,0,0
default,rack2,ceph-storage-021,osd.154,820,738,1558,0,0,0
default,rack2,ceph-storage-021,osd.159,0,0,0,0,0,0
....
default,rack2,ceph-storage-021,5093,3466,8559,0,0,0,
...
default,rack2,97265,87545,184810,11958,11968,12038,
...
default,rack3,154202,58709,212911,2357,2357,2365,
default,338162,229909,568071,27912,27946,28072,
- Provide with a ceph-mon.log and text output file from 'ceph osd tree' and this script will generate a mapping of 'reported failed' (reported and reporters) counts as a result.
# ceph osd tree > ceph_osd_tree.txt
# ./map_reporters_to_buckets.sh ceph-mon.log ceph_osd_tree.txt > reporters.csv
Searching..., mapping to buckets

# cat reporters.csv
buckets...,reported,reporter
default,rack1,ceph-storage-003,osd.0,2411,1520
default,rack1,ceph-storage-003,osd.6,1880,2198
default,rack1,ceph-storage-003,osd.10,2456,1663
default,rack1,ceph-storage-003,osd.15,1978,2677
...
default,rack1,ceph-storage-003,24256,22256,
default,rack1,ceph-storage-004,osd.423,3869,1893
default,rack1,ceph-storage-004,osd.425,3024,2832
default,rack1,ceph-storage-004,osd.427,2219,2439
...
default,rack1,ceph-storage-004,27784,21096,
...
default,rack1,206045,167742,
...
default,rack2,199356,137798,
...
default,rack3,ceph-storage-046,osd.254,34761,46650
default,rack3,ceph-storage-046,osd.259,32485,38331
default,rack3,ceph-storage-046,osd.264,33657,48924
default,rack3,ceph-storage-046,osd.269,31560,48421
default,rack3,ceph-storage-046,309241,409805,
...
default,rack3,313686,413547,
default,719087,719087,
- Provide the
radosgw.logand this script will provide an output showing the time between the start and return of every RGW request. The output format is csv, with the first column being the request time in seconds, second column being the 'req done' line which stopped the timer. The start/stop lines are keyed on the request ID assigned by RGW. At the end of the processing, a Min,Avg,Max output is also provided, along with the 'req done' line for the Min and Max request times.
# ./rgw_req_timing.sh /var/log/ceph/ceph-rgw-myhostname.log > ~/req_timings.csv
# cat ~/req_timings.csv

0.187219,2018-01-16 03:47:01.622215 2af878cd7700  1 ====== req done req=0x2af878cd1710 op status=0 http_status=200 ======
0.051897,2018-01-16 03:47:01.989993 2af8a132d700  1 ====== req done req=0x2af8a1327710 op status=0 http_status=200 ======
0.181928,2018-01-16 03:47:02.045216 2af878cd7700  1 ====== req done req=0x2af878cd1710 op status=0 http_status=200 ======
0.052496,2018-01-16 03:47:02.047359 2af8a5335700  1 ====== req done req=0x2af8a532f710 op status=0 http_status=200 ======
0.279186,2018-01-16 03:47:02.207797 2af87e7e5700  1 ====== req done req=0x2af87e7df710 op status=0 http_status=200 ======
0.16574,2018-01-16 03:47:02.447974 2af878cd7700  1 ====== req done req=0x2af878cd1710 op status=0 http_status=200 ======
0.29716,2018-01-16 03:47:02.712994 2af87e7e5700  1 ====== req done req=0x2af87e7df710 op status=0 http_status=200 ======
0.186362,2018-01-16 03:47:02.828799 2af878cd7700  1 ====== req done req=0x2af878cd1710 op status=0 http_status=200 ======
0.236106,2018-01-16 03:47:02.931637 2af88ab00700  1 ====== req done req=0x2af88aafa710 op status=0 http_status=200 ======
0.0516322,2018-01-16 03:47:02.952181 2af87f0e7700  1 ====== req done req=0x2af87f0e1710 op status=0 http_status=200 ======
...
Min,Avg,Max
0.000127792,0.73737,1200.11
Min Req: 2018-01-16 15:46:07.383273 2af89230f700  1 ====== req done req=0x2af892309710 op status=0 http_status=400 ======
Max Req: 2018-01-16 12:09:07.163211 2af89130d700  1 ====== req done req=0x2af891307710 op status=0 http_status=200 ======

