airmed-dev / meals Goto Github PK
View Code? Open in Web Editor NEWMeals is a meal tracker for people with type 1 diabetes
License: MIT License
Meals is a meal tracker for people with type 1 diabetes
License: MIT License


When creating a new meal, it would make a lot of sense to ask the user if he just consumed it.
It would make the meal entry flow much easier.
When deleting a meal, the photo remains but its should be deleted
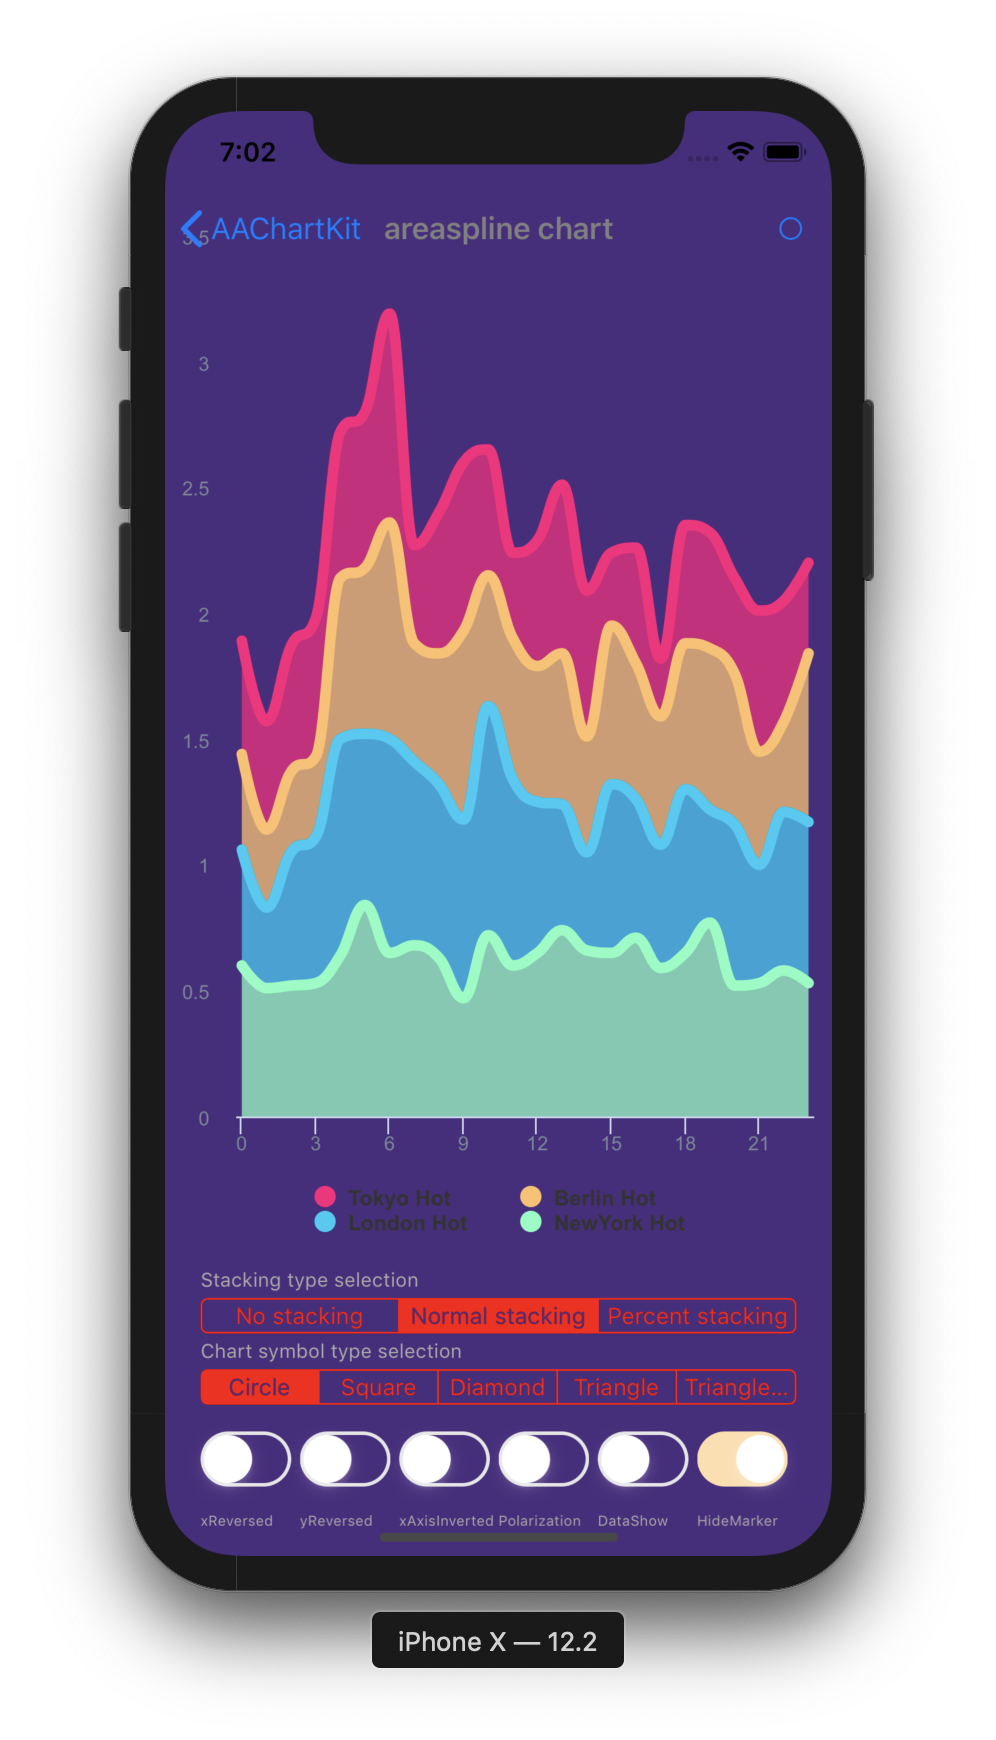
Right now insulin is displayed with a single dimension. There is value in differentiating between bolus and basal.
This could help the user understand how much to bolus for the meal.
Apple Health displays this in stacked column charts of the two models, perhaps the same could work for AAChartKit graph as well.

The current skeleton on the events tab is outdated. the new UI has different layout
When adding or editing a photo for a meal doesn't change the reflect in the grid.
The glucose graph has a bug in the events page, and also in the meal details' meal events list.
When a point is clicked the value isn't shown

Since there could be active insulin before the event, this data should be fetched as well.
In the settings page, when changing the datasource it doesn't apply globaly.
The cause of this seems to be that that Store is initiated based on settings only when the app is starting. And when changing the datasource type it is's only changing the name of which datasource is in use, and doesn't create a metric store.
The events page shows the title of "Statistics", but it doesn't provide any actual statistics.
It sohuld be renamed to "Metrics" as this is more accurate.
Right now the UI is just showing the text "No meals" but an empty tray would be nicer
When first opening the app, the screen is says "No events - log an event" - this is pretty confusing.
Perhaps it should prompt to create the first meal? Or show the meals first?
Or, there could be a fab that's opening and asking you to choose a meal or create one?
There are situation where scrolling through the timeline introduces a glitchy order.
In the events page, when there is no data an empty block is shown.
This block takes space and doesn't indicate there is no data.
It should behave similar to other no-data events and display an icon with the label "No data"


We need some way to indicate glucose values are in range or not.
This is a useful visual cue.
There are a few approaches to add visual cues to the CGM values.
Here are a few examples.
Change color the background of the range. Similar to loop

Dexcom uses this approach and also adds different colors different severity levels.

Change the color of the points according to the range.

Currently the insulin on board is calculated based on a hard coded value.
There are different kinds of insulin and each has its own active time.
The settings page should support the different insulin models.
This can be copied from Loop, where there are 4 insulins models: Walsh, rapid acting for adults, rapid acting for children and fiasp.

In the meal editor there is a bug where the block of description is too small and it's cutting off the space.
It should take all available space.

The app doesn't have any automated testing.
It would be helpful to make a stable app, and prevent from bugs appearing by accident and save time on manually testing things.
The scope of the test is yet to be decided. It could be a bottom-up testing strategy where the most inner components are tested. Also there could be a more end-to-end testing, where the main flows of the app are tested, and thus covering the inner components.
Right now in meal details, statistics and meal events are in different window.
This isn't correct, and causes weird behavior. Both of these blocks are some view of the glucose/insulin metrics.
It means that when there is no data, both of these show that there is no data, and both of them show other duplicate information such as total events, and the hour interval.
They should be merged into the same block named something like "Metrics", and under that have 2 sub sections named "Statistics" and "Meal events"

When we have no data for glucose and insulin, display a single "No data" view.

Right now the meal header is cut off before the unsafe area. This would look better if the photo would reach the edge of the screen.

Right now meal events show an empty graph when there is no data. In this case, the question is what should be done?
On one hand, what's the value of a meal event that has no statistics?
Perhaps it could be used later on to calculate stats such as, how often was it eaten.
In the meal events, the whole point is to see the graphs, so there is really no value in showing an empty block. In other places with no data, we are showing a no-data graphic, but this one would take too much space.
I think the straight forward is to show some minimal thing that would indicate something happened there, but there is no glucose data, and it shouldn't take the whole space of the chart.


When there are only several values, they are skewed horizontally. The chart is centering it.
It's critical to show the insulin+glucose values aligned to each other horizontally. The values in the range should be filled with nil.

Dark mode isn't working properly.
In the graphs in both individual events and also statistics, the value has too many decimal points.
It should be rounded to nearest 2 points for readability.

The hover display of a chart is showing very long numbers.
Both in statistics charts and in the simple glucose and insulin statistics charts.


Currently the app was built with only mg/dL in mind. It would be useful to support mmol/L.
Need to test it and see what changes are required
There is a bug that happens in glucose statistics. It renders that graph with jagged edges.
The cause isn't clear, perhaps there is some data that isn't in order, or the data should be smoothed, perhaps by calculating smaller ranges

The update event sheet from the event view doesn't have padding.

Right now the events tab shows the skeleton instead of showing "No data".
There is a bug in the meal editor. When editing a meal, the keyboard pops up and makes the view smaller, then the photo gets smaller and it loses it's aspect ratio.
Perhaps in this case it should be cropped in the middle

In the settings page, the "Authorized" block doesn't show "true" when in fact it is authorized.
The meal event page uses a header that is different from the other pages.
The pages use a photo that's cropped in the center, with the title overlaying the photo.
However, in the event page, the photo is above, and there is a white block that's offseted into the photo and the title is on the white page.


When asking for healthkit authorization, it might take some time until the HealthKit access screen appears.
So in this case, we might wanna show a loading screen for the user.
TBD
Value + time axis should be rounded to nearest 5 minute, or 25 mg/dL
Right now the app doesn't introduce itself to the user.
It would be helpful to show the user a page that describe the most useful features.
And also prompts the user to choose a datasource, and authorize it or configure it as necessary.
For example the flow could be something like
Right now the charts are using the minimum value of the data as the minimum value of the axis.
It would be more useful to show the values in relation to a static minimum value. Perhaps of 75, or the range's minimum value - after it's implemented with #53
A declarative, efficient, and flexible JavaScript library for building user interfaces.
🖖 Vue.js is a progressive, incrementally-adoptable JavaScript framework for building UI on the web.
TypeScript is a superset of JavaScript that compiles to clean JavaScript output.
An Open Source Machine Learning Framework for Everyone
The Web framework for perfectionists with deadlines.
A PHP framework for web artisans
Bring data to life with SVG, Canvas and HTML. 📊📈🎉
JavaScript (JS) is a lightweight interpreted programming language with first-class functions.
Some thing interesting about web. New door for the world.
A server is a program made to process requests and deliver data to clients.
Machine learning is a way of modeling and interpreting data that allows a piece of software to respond intelligently.
Some thing interesting about visualization, use data art
Some thing interesting about game, make everyone happy.
We are working to build community through open source technology. NB: members must have two-factor auth.
Open source projects and samples from Microsoft.
Google ❤️ Open Source for everyone.
Alibaba Open Source for everyone
Data-Driven Documents codes.
China tencent open source team.