Track your keypresses and mouse movements with ActivityWatch.
NOTE: Work in progress, contributions welcome!
NOTE: This does not track which keys you press, only that you pressed any key some number of times in a given time span. This is not a keylogger, and never will be (due to the massive security and privacy implications).
Make sure you have Python 3.7+ and poetry installed, then install with poetry install.
Run poetry run aw-watcher-input --help for usage instructions.
We might eventually create binary builds (like the ones bundled with ActivityWatch for aw-watcher-afk and aw-watcher-window) to make it easier to get this watcher up and running, but it's still a bit too early for that.
This watcher ships with an experimental custom visualization which needs special configuration.
NOTE: This is a work-in-progress. Custom visualizations is an experimental feature with little to no decent documentation, so far.
First, you need to build it, which you can do by:
cd visualization/
npm install -g pug-cli browserify  # might need sudo
npm install
make build
You can then configure aw-server or aw-server-rust to host the custom visualization.
To do so for aw-server, add the following to your config file (with the correct path!):
[server.custom_static]
aw-watcher-input = "/home/user/path/to/aw-watcher-input/visualization/dist"
For aw-server-rust, instead add the following to your config file (with the correct path!):
[custom_static]
aw-watcher-input = "/home/user/path/to/aw-watcher-input/visualization/dist"
You then need to restart aw-server/aw-server-rust for the changes to take effect.
Once the server is restarted, you can open the Activity view in the web UI, click "Edit view", then "Add visualization", then click the cogwheel and select "Custom visualization". This will open a popup asking for which visualization, here enter "aw-watcher-input".
It should now work. Click save and you're done!
This was massively inspired by ulogme by @karpathy, here's a screenshot of how it looks:
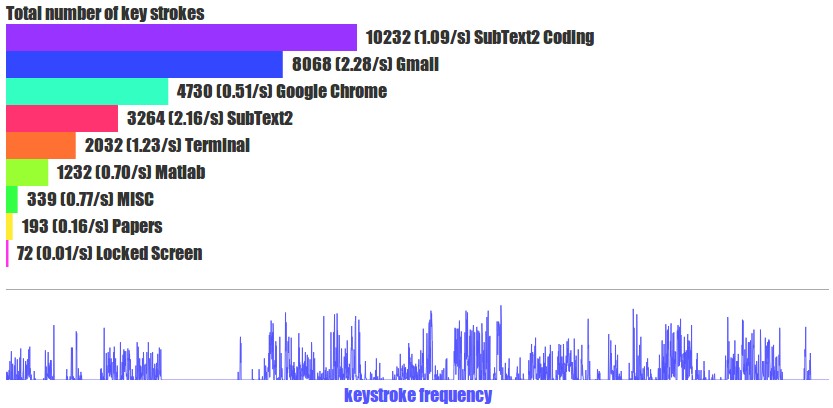
The idea is that we can do the same thing with ActivityWatch, and this watcher is an attempt to incorporate this specific part.
Here's a link to the blog post where he presents it: https://karpathy.github.io/2014/08/03/quantifying-productivity/