Giter Club home page Giter Club logo

cmasher's Introduction

PyPI - Latest Release Conda-Forge - Latest Release PyPI - Python Versions CodeCov - Coverage Status JOSS - Submission Status

CMasher: Scientific colormaps for making accessible, informative and cmashing plots

The CMasher package provides a collection of scientific colormaps and utility functions to be used by different Python packages and projects, mainly in combination with matplotlib, showcased in the online documentation (where I also describe how to use the colormaps in other languages and applications). The colormaps in CMasher are all designed to be perceptually uniform sequential using the viscm package; most of them are color-vision deficiency friendly; and they cover a wide range of different color combinations to accommodate for most applications. It offers several alternatives to commonly used colormaps, like chroma and rainforest for jet; sunburst for hot; neutral for binary; and fusion and redshift for coolwarm. If you cannot find your ideal colormap, then please open an issue, provide the colors and/or style you want, and I will try to create one to your liking! Let's get rid of all bad colormaps in the world together!

If you use CMasher for your work, then please star the repo, such that I can keep track of how many users it has and more easily raise awareness of bad colormaps. Additionally, if you use CMasher as part of your workflow in a scientific publication, please consider citing the CMasher paper (BibTeX: cmr.get_bibtex).

Colormap overview

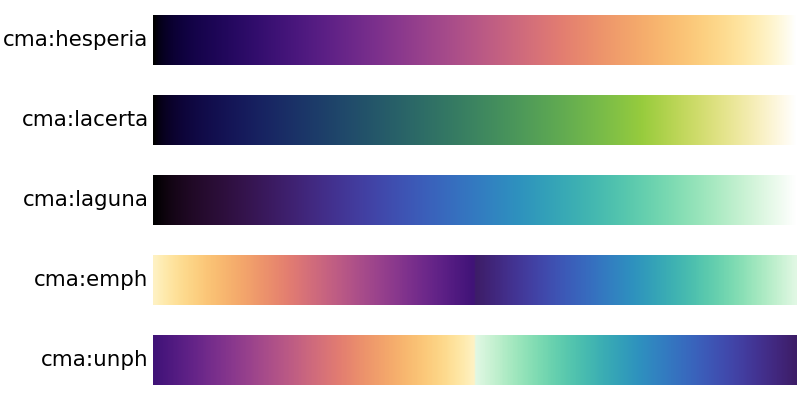
Below is an overview of all the colormaps that are currently in CMasher (made with the cmr.create_cmap_overview() function). For more information, see the online documentation.

CMasher Colormap Overview

In the figure, one can see this wide range of color combinations that CMasher has to offer, as I wanted to make sure that CMasher has a colormap for everyone. Because of this, CMasher's sequential colormaps range from single major color maps like amber; ember; flamingo; freeze; gothic; and jungle, to colormaps with high perceptual ranges like apple; chroma; torch; neon; and rainforest. The diverging colormaps in CMasher have a similar variety, but more importantly, several of them have a black center instead of a white center, like iceburn; redshift; watermelon; and wildfire. Black centered diverging colormaps are quite rare as most researchers are used to white centered ones, even though a black centered diverging colormap can be rather useful in certain cases, like plotting a radial velocity map (the further away from the common center, the higher the velocity in either direction, and thus the corresponding color should be brighter).

Installation & Use

How to install

CMasher can be easily installed directly from PyPI with:

$ pip install cmasher

or from conda-forge with:

$ conda install -c conda-forge cmasher  # If conda-forge is not set up as a channel
$ conda install cmasher                 # If conda-forge is set up as a channel

If required, one can also clone the repository and install CMasher manually:

$ git clone https://github.com/1313e/CMasher
$ cd CMasher
$ pip install .

CMasher can now be imported as a package with import cmasher as cmr.

Besides Python, CMasher's colormaps can also be accessed in various other languages and applications. A list of all currently known languages and applications that support CMasher can be found in the online documentation here.

Example use

The colormaps shown above can be accessed by simply importing CMasher. This makes them available in the cmasher module, in addition to registering them in matplotlib's cm module (with added 'cmr.' prefix to avoid name clashes). So, for example, if one were to use the rainforest colormap, this could be done with:

# Import CMasher to register colormaps
import cmasher as cmr

# Import packages for plotting
import matplotlib as mpl
import matplotlib.pyplot as plt
import numpy as np

# Access rainforest colormap through CMasher or MPL
cmap = cmr.rainforest                   # CMasher
cmap = mpl.colormaps['cmr.rainforest']  # MPL

# Generate some data to plot
x = np.random.rand(100)
y = np.random.rand(100)
z = x**2+y**2

# Make scatter plot of data with colormap
plt.scatter(x, y, c=z, cmap=cmap, s=300)
plt.show()

For other use-cases, including an overview of CMasher's utility functions and how to use CMasher in other programming languages and applications, see the online documentation.

cmasher's People

Contributors

1313e avatar abatten avatar beskep avatar cclauss avatar danielyang59 avatar kthyng avatar neutrinoceros avatar pre-commit-ci[bot] avatar

Stargazers

 avatar  avatar  avatar  avatar  avatar  avatar  avatar  avatar  avatar  avatar  avatar  avatar  avatar  avatar  avatar  avatar  avatar  avatar  avatar  avatar  avatar  avatar  avatar  avatar  avatar  avatar  avatar  avatar  avatar  avatar  avatar  avatar  avatar  avatar  avatar  avatar  avatar  avatar  avatar  avatar  avatar  avatar  avatar  avatar  avatar  avatar  avatar  avatar  avatar  avatar  avatar  avatar  avatar  avatar  avatar  avatar  avatar  avatar  avatar  avatar  avatar  avatar  avatar  avatar  avatar  avatar  avatar  avatar  avatar  avatar  avatar  avatar  avatar  avatar  avatar  avatar  avatar  avatar  avatar  avatar  avatar  avatar  avatar  avatar  avatar  avatar  avatar  avatar  avatar  avatar  avatar  avatar  avatar  avatar  avatar  avatar  avatar  avatar  avatar  avatar

Watchers

 avatar  avatar  avatar  avatar

cmasher's Issues

`view_cmap()` does not show cmap and returns: `FigureCanvasAgg is non-interactive, and thus cannot be shown`

I hope I'm not using the view_cmap util incorrectly, but the following simple code doesn't seems to work:

import cmasher as cmr

cmr.view_cmap("cmr.fusion")

and returns

/home/yang/Developer/CMasher/cmasher/utils.py:1644: UserWarning: FigureCanvasAgg is non-interactive, and thus cannot be shown
  plt.show()

Tried to install pyqt5 and pyqt6 as suggested here which unfortunately doesn't resolve the issue. Also all dependencies are installed from dependencies.txt.

Thanks!

Possible contribution: some sequential, some ~diverging

I have a set of colormaps that I have found useful in various contexts, and I was just going through the process of packaging them when @dfielding14 pointed me to this repo :). So, checking in here to see if you would be open to contributions.

colormaps

Describe the colormap type

The first three are sequential and come from here: http://inversed.ru/Blog_2.htm

The two emph and unph are made from stitching together pieces of Hesperia and Laguna and satisfy some constraints that I wanted, but couldn't find in any other colormaps:

  • Close to cyclic, but with unique colors on either end
  • Options to either emphasize the central values / or de-emphasize central values
  • "Cool" colors on one side, "warm" colors on the other side (so that positive/negative are unique)
  • Print to black and white in a way that preserves lightness
  • Close to perceptually uniform in either direction

These are different from many of the existing diverging and cyclic maps because they don't go to fully to white or black, so colors are meant to be unique anywhere. (although "guppy" and "pride" look close?)

Describe any extra properties

In B&W:
image

Lightness curves:
image

If interested, happy to open a PR with the relevant colormap data...

Replace pytest-pep8

Starting in pytest v6.0.0, pytest-pep8 is no longer supported as it uses a plugin structure that pytest has deprecated (this is why tests are currently failing).
Given that the pytest-pep8 plugin has not been updated for over 5 years now, it is doubtful that it will be updated for this.

I will either have to remove PEP8-compliancy testing (which I would like to avoid) or replace the plugin with one that does the same thing (I however do not know of one that does that as well).
I could also fix the problem myself by migrating the package from BitBucket to GitHub, and fixing the problem.

Anyone has any ideas for alternative pytest plugins or methods that perform PEP8 testing?

Colormap summary table

You mention in a documentation note that colormaps are sorted according to minimum and maximum lightness values, Starting (sequential) or central (diverging and cyclic) lightness value, Difference between the minimum and maximum lightness values and RMSE (root mean square error) of the derivative of the lightness profile. Could these quantities be centralized in a table?

XML format

I love your colormaps. Could you provide them in XML format? That way e.g. ParaVIEW users could also benefit from your colormaps :) The files have the following form:

<ColorMaps>
<ColorMap name="cmap_name" space="RGB">
<Point x="0.000000" o="1" r="0.015312" g="0.022521" b="0.072729"/>
<Point x="0.003922" o="1" r="0.018005" g="0.025446" b="0.078419"/>
<Point x="0.007843" o="1" r="0.020901" g="0.028527" b="0.084078"/>
<Point x="0.011765" o="1" r="0.023998" g="0.031763" b="0.089708"/>
...
...
<Point x="0.988235" o="1" r="0.897592" g="0.978891" b="0.982505"/>
<Point x="0.992157" o="1" r="0.904501" g="0.983140" b="0.986001"/>
<Point x="0.996078" o="1" r="0.911330" g="0.987445" b="0.989444"/>
<Point x="1.000000" o="1" r="0.918059" g="0.991814" b="0.992833"/>
</ColorMap>
</ColorMaps>

Keep up the amazing work!

[Community Help] Renaming 'heat'

TL;DR: Vote here

So, one of the very first colormaps I have made, before CMasher existed or was even an idea, is the heat colormap.
Even though the rainforest colormap is the very first colormap I have made and will therefore always be special to me, the heat colormap is probably a close second.
I personally really like this colormap, and judging from feedback I get from others and papers that use CMasher, so do a lot of others.

Now, the problem I have with heat is its name.
I try to give every colormap a name that provides a good first impression to the user, such that you don't need to know the colormap in order to have a rough idea of what it would look like.
The heat colormap is meant to look like the typical gas flame you get from a burner or stove.
I initially wanted to call it thermal, but because MPL already has a colormap with this name (and my colormaps did not use name prefixes yet), I could not do that.
So, I settled for heat.

I however think that heat does not really set a good expectation for the colormap.
Therefore, I have been wanting to change its name for a long time now, but given its popularity, changing its name would break some codes.
Plus, I am not entirely sure what to change it to actually.

So, what I want to do, is ask everyone reading this issue to either vote on a name, or come with new names.
You can do so here, where you can also add new options for users to vote on.
If enough people vote (not entirely sure yet what I define as 'enough'), I will rename heat to whatever was picked the most.

Faster center transition for dark-centered diverging maps

Describe the colors you would like
I want 'bwr' only with black in the middle, i.e.. I want "dark mode bwr": Blue on one side, red on the other, black in the middle, but for a fairly narrow range in the middle.

I notice that all the light-centered diverging maps appear as if there is a "rapid" transition around the central value, whereas for the darker maps the central dark colors cover a might wider proportion of the colormap.

My collaborator hates all the white in this image and asked for a "dark mode", so I'm working on that.
Screen Shot 2022-12-05 at 5 50 58 PM

'redshift' has too much of the middle of the color range as near-black:
Screen Shot 2022-12-05 at 5 53 18 PM
I want the black to cover a more narrow range in the middle.

'guppy' seems to provide the most rapid transition of the dark-centered diverging colormaps, but I don't want purple in the middle. Most of my plot ends up looking purple (see screenshot below), whereas I'd rather have it mostly dark.
Screen Shot 2022-12-05 at 5 49 46 PM

Describe the colormap type

diverging

Describe any extra properties

I'm not sure how one gets colorblind-friendliness in a diverging map, but if possible, that'd be great!

Is your colormap request related to a specific application? Please describe.

Sure, see tokens_spectrogram_image() in my aeiou library.
I want to easily see at a glance the distribution of positive, negative, and "small" (near zero) values in a 2D array.

Additional context

screenshots above

listing colortable for "export"

I use RGB text tables in NEMO, 3 columns, and I believe ds9 as well. So for the community it would be useful to have some kind of script that does:
mkrgbtable cmr.rainforest > rainforest.rgb
I know they are also deep inside the python tree. I wrote something that might be of some use to clean up a but and feel feel to adopt that one. Mine is called mklut in NEMO, e.g..
https://github.com/teuben/nemo/blob/master/data/lut/mklut
As you will see from mine, I also support the generic MPL names, as well as yours, in the cmr. namespace.

Adding stub file of cm.py

Is your feature request related to a problem? Please describe.

Adding stub file of cm.py would be very helpful for auto completing and type checking.

Describe the solution you would like

cm.pyi would be like the following:

from matplotlib.colors import ListedColormap as LC

CMAP_DCT = dict[str, LC]
cmap_d: CMAP_DCT
cmap_cd: dict[str, CMAP_DCT]

amber: LC
amber_r: LC
amethyst: LC
amethyst_r: LC
apple: LC
apple_r: LC
arctic: LC
arctic_r: LC

I generated the stub file with this script:

from pathlib import Path

import cmasher.cm as cmrcm
from cmasher._known_cmap_types import _CMASHER_BUILTIN_MAP_TYPES

if __name__ == "__main__":
    pyi = Path(cmrcm.__file__).with_suffix(".pyi")

    with pyi.open("w", encoding="utf-8") as f:
        f.write(
            """from matplotlib.colors import ListedColormap as LC

CMAP_DCT = dict[str, LC]
cmap_d: CMAP_DCT
cmap_cd: dict[str, CMAP_DCT]

"""
        )

        for cmap in _CMASHER_BUILTIN_MAP_TYPES:
            if cmap.startswith("cmr."):
                continue

            f.write(f"{cmap}: LC\n")
            f.write(f"{cmap}_r: LC\n")

Additional context

image

Is there a way to reverse the sequential cmasher colormaps?

Hello!

I would like to reverse the cmasher colormap "neon" so that it changes from green to red rather than red to green. I did not see anything in the documentation that gives an easy way to do this with a colormap that does not come from matplotlib. Is this possible?

Thank you!

2D Colormaps

Hello,

I am long time admirer and user of your great colormaps!

Lately I have been playing around a little bit with making 2D colormaps from your original 1D colormaps. To do this I shift the overall lightness / darkness of the whole color map. However, my current implementation is very rudimentary, all I do is linearly interpolate the rgb values up or down based on the second variable I am plotting against. This linear interpolation does not preserve perceptual uniformity, so I was wondering if you have any thoughts on how I could do this more rigorously. You can see an example in the following image where black to white encodes Log T, and color encodes f_sat.
Screen Shot 2022-11-02 at 1 21 31 PM

My initial attempt to do this was somewhat more perceptually uniform, but much less vivid and harder to discern the intermediate color values.
Screen Shot 2022-11-02 at 1 23 15 PM

What do you think?

Upgrade via pip failed

I had installation of cmasher via: pip install cmasher and when I ran: pip install --upgrade cmasher I get the following error:

Installing collected packages: six, cmasher
  Found existing installation: six 1.10.0
Cannot uninstall 'six'. It is a distutils installed project and thus we cannot accurately determine which files belong to it which would lead to only a partial uninstall.

Any suggestions?

I am using Python 3.6.1 and system: OS X Yosemite Version 10.10.5

install instructions

Any reason not to list it as pip install git+https://github.com/1313e/CMasher.git ?

Diverging white-centered colormaps with

Describe the colors you would like
I am currently using the cosmic and the gothic sequential colormaps and I love these colors (especially that really nice bright blue in cosmic) and for uniformity in the plots, I'm not super happy with current blue and purple diverging colormaps for subsequent plots when showing distributions from the mean. Two diverging colormaps with white centres (one blue-brown/red/oorange and the second purple-brown/red.orange), which I envision would be similar to:
1 - cosmic and sunburst (that bright blue to a browny/red/orange color, white centre)
2 - amethyst and sunburst (a purple to a browny/red/orange color, white centre).

Describe the colormap type
diverging

Describe any extra properties
Colour-blindness and black/white friendly would be great.

Is your colormap request related to a specific application? Please describe.
I'm making metallicity maps (which are coloured with the cosmic sequential maps) and ionisation parameter maps (coloured with the gothic colormap) of galaxies. I fit radial profile distribution with a linear fit and then subtract off the fit to study the scatter around the average value, and these plots are best representative with diverging maps. Matplotlib's PuOr is too dark of purples compared to the cmr.gothic purple (which is really nice by the way!), and the same goes for blue diverging color bars, I wish there was one with the nice bright blue that makes cmr.cosmic so great.

Additional context
I do realise it is more complicated than taking two color bars and stitching them together to make a diverging colorer.

A set of sequential colormaps that do not start with black

Describe the colors you would like

Describe the colormap type
Sequential, perceptually uniform (or at least colorblind friendly)

Describe any extra properties
The specific property I would like to request is that the colormap does not start with pure black. Sometimes it is useful to have plot background set to black color.

Is your colormap request related to a specific application? Please describe.
My specific application is looking at lots of parallel coordinates plots on black background---however I think that many people who use black backgrounds would appreciate a color palette that does not start with pure black.

Additional context
Dusk palette
image

Viridis palette -- note dark purple lines in the middle between y=0.0 and y=0.2 which disappear with all CMasher palettes
image

Matplotlib deprecation warnings

On matplotlib 3.7 I am getting the following errors when importing and using cmasher

MatplotlibDeprecationWarning: The get_cmap function was deprecated in Matplotlib 3.7 and will be removed two minor releases later. 
Use ``matplotlib.colormaps[name]`` or ``matplotlib.colormaps.get_cmap(obj)`` instead.
cmap = mplcm.get_cmap(cmap)

And the following:

MatplotlibDeprecationWarning: The register_cmap function was deprecated in Matplotlib 3.7 and will be removed two minor releases later. 
Use ``matplotlib.colormaps.register(name)`` instead.
mplcm.register_cmap(cmap=cmap_mpl_r)

These methods should be updated as described.

Instructions on how to import CMasher colormaps into Tableau

Hi,
I compiled here a short "How to import CMasher colormaps into Tableau" explanation, feel free to edit it and include in your Documentation :)

Once you have your Tableau installed (tested with Public and Desktop version of Tableau), by default you will have My Tableau Repository folder inside My Documents. Within this folder, you may already have or you can create Tableau Preferences.tps file.

The Preferences.tps file is a XML file which you can edit in text editor to input your colormaps, the empty file looks like this:

<?xml version='1.0'?>
<workbook>
</workbook>

The opening and closing preferences tags should be placed inside workbooks tags:

<?xml version='1.0'?>
<workbook>
    <preferences>
    </preferences>
</workbook>

Inside the preferences tags, you can place a sequence of hex numbers of your colormap, for example:

<?xml version='1.0'?>
<workbook>
    <preferences>    
    <color-palette name="amber" type="ordered-sequential">
        <color>#2B1619</color>
        <color>#2D171A</color>
        <color>#2E171B</color>
        <color>#30181B</color>
        <color>#31181C</color>
        ...
        <color>#EAB830</color>
        <color>#EBB931</color>
    </color-palette>
    </preferences>
</workbook>

For diverging colormap use type="ordered-diverging", and for the cyclic colormaps use type = "regular".

Once colormaps are placed, save Preferences.tps file and restart Tableau. Now you are able to use new colormaps in Tableau.

Below I made a function that extracts all sequential, diverging and cyclic colormaps from CMasher and saves output as
the Preferences.tps file:

# Import packages
import cmasher as cmr
#cmr.__version__
#'1.6.0'

# In case you don't have cmasher, install it
# pip install cmasher

def create_cmasher_tableau_properties_file(cmap_range=(0.15,0.85)):
	"""
    Create Tableau parameters.tps file that contains colormaps from CMasher
    
    Parameters:
    ==========
    colormap_range: input two float numbers in range (0, 1)
    
    Returns:
    =======
    Parameters.tps -- Tableau preferences file with CMasher's colormaps
    """
    # Get colormaps
    cmr.cm.cmap_d.keys()

    # Get type of the colormaps
    cmr.cm.cmap_cd.keys()

    # We obtain names of colormaps using only those that do not end with '_r' 
    # since they are the reversed version of each colormap, and in Tableau
    # we can reverse colormaps when we use them.
    sequential_colormaps = [y for y in cmr.cm.cmap_cd['sequential'] if not y.endswith('_r')]
    diverging_colormaps = [y for y in cmr.cm.cmap_cd['diverging'] if not y.endswith('_r')]
    cyclic_colormaps = [y for y in cmr.cm.cmap_cd['diverging'] if not y.endswith('_r')]

    # Get the HEX values of each sequential colormap
    # Export them in range of: 0.15 to 0.85 -> you can export the full range if you prefer
    all_sequential_maps_hex = []
    for colormap in sequential_colormaps:
        cmp = cmr.take_cmap_colors('cmr.{}'.format(colormap), None, cmap_range=cmap_range, return_fmt='hex')
        all_sequential_maps_hex.append(cmp)

    # Get the HEX values of each diverging colormap
    all_diverging_maps_hex = []
    for colormap in diverging_colormaps:
        cmp = cmr.take_cmap_colors('cmr.{}'.format(colormap), None, cmap_range=cmap_range, return_fmt='hex')
        all_diverging_maps_hex.append(cmp)

    # Get the HEX values of each cyclic colormap
    all_cyclic_maps_hex = []
    for colormap in cyclic_colormaps:
        cmp = cmr.take_cmap_colors('cmr.{}'.format(colormap), None, cmap_range=cmap_range, return_fmt='hex')
        all_cyclic_maps_hex.append(cmp)

    # Create Tableau Preferences.tps file:
    with open("Preferences.tps", 'w') as f:
    
        print("<?xml version='1.0'?>", file=f)
        print("<workbook>", file=f)
        print("    <preferences>", file=f)
    
    	   # Get all the sequential colormaps in the format that is required in Tableau
        for i, hexes in enumerate(all_sequential_maps_hex):
            print('    <color-palette name='+'"'+'{}'.format(sequential_colormap[i])+'" ' +'type="ordered-sequential">', file=f)
            for j, col in enumerate(hexes):
                    print('        <color>'+'{}'.format(hexes[j])+'</color>', file=f)
                print('    </color-palette>', file=f)
    
    
        # Get all the cyclic colormaps in the format that is required in Tableau
        for i, hexes in enumerate(all_cyclic_maps_hex):
            print('<color-palette name='+'"'+'{}'.format(cyclic_colormap[i])+'" ' +'type="regular">', file=f)
            for j, col in enumerate(hexes):
                print('        <color>'+'{}'.format(hexes[j])+'</color>', file=f)
            print('    </color-palette>', file=f)
    
        # Get all the diverging colormaps in the format that is required in Tableau
        for i, hexes in enumerate(all_diverging_maps_hex):
            print('<color-palette name='+'"'+'{}'.format(diverging_colormap[i])+'" ' +'type="ordered-diverging">', file=f)
            for j, col in enumerate(hexes):
                print('        <color>'+'{}'.format(hexes[j])+'</color>', file=f)
            print('    </color-palette>', file=f)
    
        print("    </preferences>", file=f)
        print("</workbook>", file=f)

if __name__ == "__main__":
    #Change cmap_range as required from 0 to 1.
    cmap_range = (0.15, 0.85)
    create_cmasher_tableau_properties_file(cmap_range)

An example that shows imported CMasher colormaps in Tableau:

Tableau_cmaps
:

Cheers

dutch blue and oranje diverging cmap request

Hoi, Ellert,
Niko here.

I was wondering if you can maybe generate two cmaps in "Dutch colors" for me?
It is just a bit different from prinsenvlag.

Describe the colors you would like

  • Dutch blue (hex #4a638d) and oranje?
    and
  • Delft blue (HEX "#1F305E") and oranje "#FF9B00"

Describe the colormap type
diverging

Describe any extra properties
N/A

Is your colormap request related to a specific application? Please describe.
I need it for some fractional difference heatmaps but I would use these two colors throughout the project.

Additional context
Orange blue is my preferred color combination when it comes to plots (my usual go to). And I usually go with these "Dutch" options as I find the colors nice.

ETA: typos

Preview version of application overview

As the application overview figure on the "Usage" page is quite large (about 5 MB at this point), it would save loading time to create two versions of the plot: A preview that is shown on the page and the full-size one.
I will have to figure out how to do that though.

PS: Could also look into just more efficiently saving the figure, as I am unsure why the size of the file is so high.

Implement CLI tools

Although CMasher is made for Python, a large portion of its utility functions could work just as fine when called directly from the command-line.
Additionally, the colormaps are nothing more than representations of an RGB table, which can also be printed in a console.

As mentioned in #16, it might be desirable to generate an RGB table directly from the command-line, without having to execute code yourself.
Furthermore, generating any of the colormap files in cmasher/colormaps could be useful for any colormap.
This would make CMasher more useful when used in combination with other programming languages.

Implement the following:

  • Add a global attribute list with Python packages that contain colormaps.
    Whenever any CLI function is used, attempt to import all packages in this list;
    • Use an environment variable for this?
  • CLI versions of the get_bibtex; get_cmap_type; and take_cmap_colors functions;
  • CLI functions that print all RGB values of a colormap to console;
  • CLI function that can create a stand-alone colormap module?
  • Try to avoid importing all of CMasher's colormaps when the CLI main function is invoked;

Instructions for R/IDL/Matlab/DS9/etc. users

Would be good to have instructions on how R/IDL/Matlab/etc users might be able to use the cmasher colourmaps.
Similarly, for certain application, this might be a good idea as well.
Perhaps in the README or in the online documentation.

eclipse divergent and other possibilities

Describe the colors you would like
yellow and dark blue/green (like eclipse), orange and gray, orange and purple/or dark brown/or dark blue(blue might be the best)

Describe the colormap type
diverging, sequential

Describe any extra properties
Colorblind-friendliness; lightness range; color focus; etc.

Is your colormap request related to a specific application? Please describe.
I am currently making a lot of plots for different cosmological scenarios. All the scenarios I am inspecting have values above and below a standard one. Therefore a divergent map in some other colors would be great. When I write my thesis eventually I would like to have only one color scheme throughout (that is my dream at least). So far I really like eclipse but it only comes as a sequential. Therefore a divergent eclipse would be grand and you would have my eternal gratitude. Also maybe some pastel options for the cmaps would be great, as someone else requested.

Additional context
I posted two plots I've been working on. I used wildfire clipped and not clipped but the color scheme is not to my liking. I think eclipse would be just gorgeous Also thanks for making CMasher - awesome!
Screenshot 2021-04-22 at 10 40 14
Screenshot 2021-04-22 at 10 39 40

Write 'sitemap.xml' file for CMasher docs

Title says it all.
In order to make sure that search engines (mainly Google) crawl the online docs of CMasher regularly, it will be required to have a 'sitemap.xml' file that lists all pages that frequently change.

Also, try to figure out why 'scientific colormaps' does not point to the online docs at all, even though that is literally in the title and description of CMasher everywhere.

Ability to reduce central 'whiteness' in diverging colormaps

I would like to use cmasher's beautiful diverging colormaps for plotting purposes. I need a diverging colormap where the color in the centre is 'close to' white but not completely white. The closest equivalent of what I want is the colormap 'coolwarm' in Matplotlib. Just like cmasher has an ability to cut colors from the edges, is it possible to introduce the ability to cut color from the centre? The available diverging colormaps with a white centre are too white for my purpose. Thanks for considering this idea in advance!

Recommend Projects

  • React photo React

    A declarative, efficient, and flexible JavaScript library for building user interfaces.

  • Vue.js photo Vue.js

    🖖 Vue.js is a progressive, incrementally-adoptable JavaScript framework for building UI on the web.

  • Typescript photo Typescript

    TypeScript is a superset of JavaScript that compiles to clean JavaScript output.

  • TensorFlow photo TensorFlow

    An Open Source Machine Learning Framework for Everyone

  • Django photo Django

    The Web framework for perfectionists with deadlines.

  • D3 photo D3

    Bring data to life with SVG, Canvas and HTML. 📊📈🎉

Recommend Topics

  • javascript

    JavaScript (JS) is a lightweight interpreted programming language with first-class functions.

  • web

    Some thing interesting about web. New door for the world.

  • server

    A server is a program made to process requests and deliver data to clients.

  • Machine learning

    Machine learning is a way of modeling and interpreting data that allows a piece of software to respond intelligently.

  • Game

    Some thing interesting about game, make everyone happy.

Recommend Org

  • Facebook photo Facebook

    We are working to build community through open source technology. NB: members must have two-factor auth.

  • Microsoft photo Microsoft

    Open source projects and samples from Microsoft.

  • Google photo Google

    Google ❤️ Open Source for everyone.

  • D3 photo D3

    Data-Driven Documents codes.