

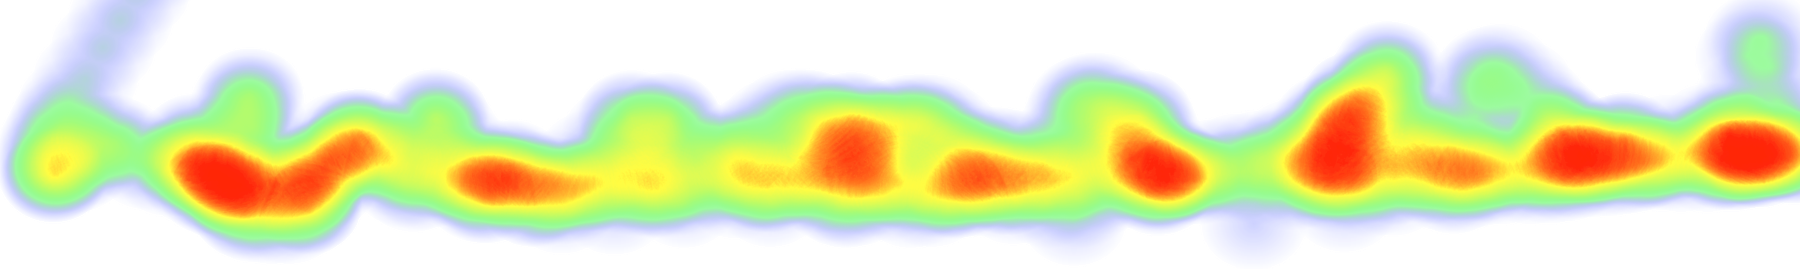
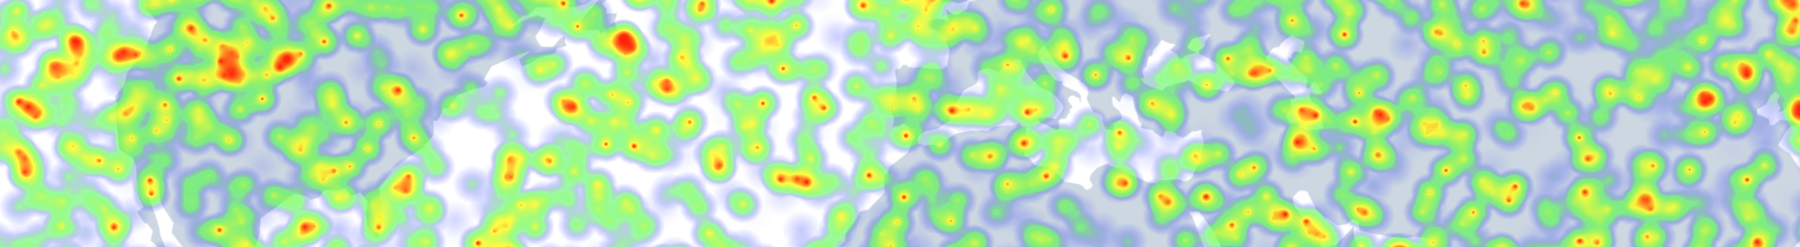
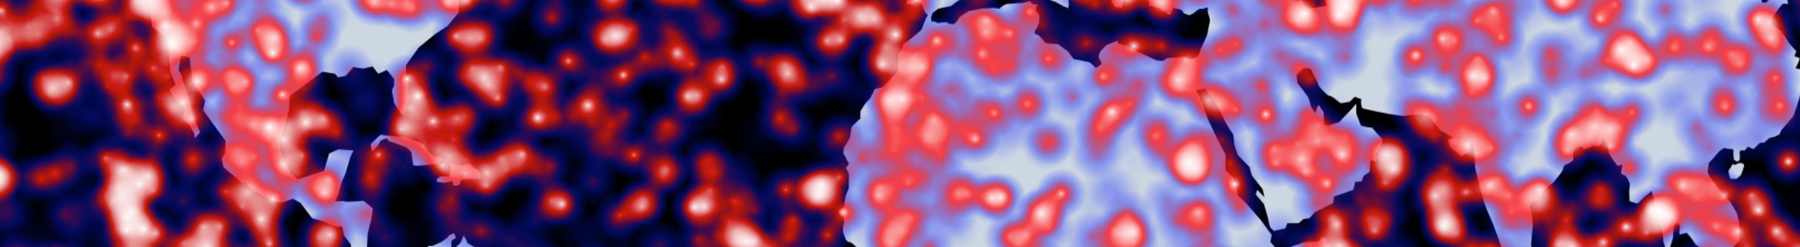
Visual Heatmap, an open-source JavaScript module, emerges as a powerful tool designed to render large-scale heatmaps with exceptional performance. This framework is based on advanced graphical rendering - WebGL/Shaders. It can render 500,000+ data points with a good framerate.
npm
npm i visual-heatmap --save
Or Download the source code from the below links
Visual-Heatmap offers both ES6 and UMD modules, making it possible to integrate the module into applications as needed.
import Heatmap from 'visual-heatmap'
visualHeatmap provides an API to create heatmap instances. API accepts container/containerId and config as an input. A context element will be created under the provided Div #containerId.
let instance = Heatmap('#containerId', {
size: 30.0, //Radius of the data point, in pixels. Default: 20
max: 100, // if not set, will be derived from data
min: 0, // if not set, will be derived from data
intensity: 1.0,
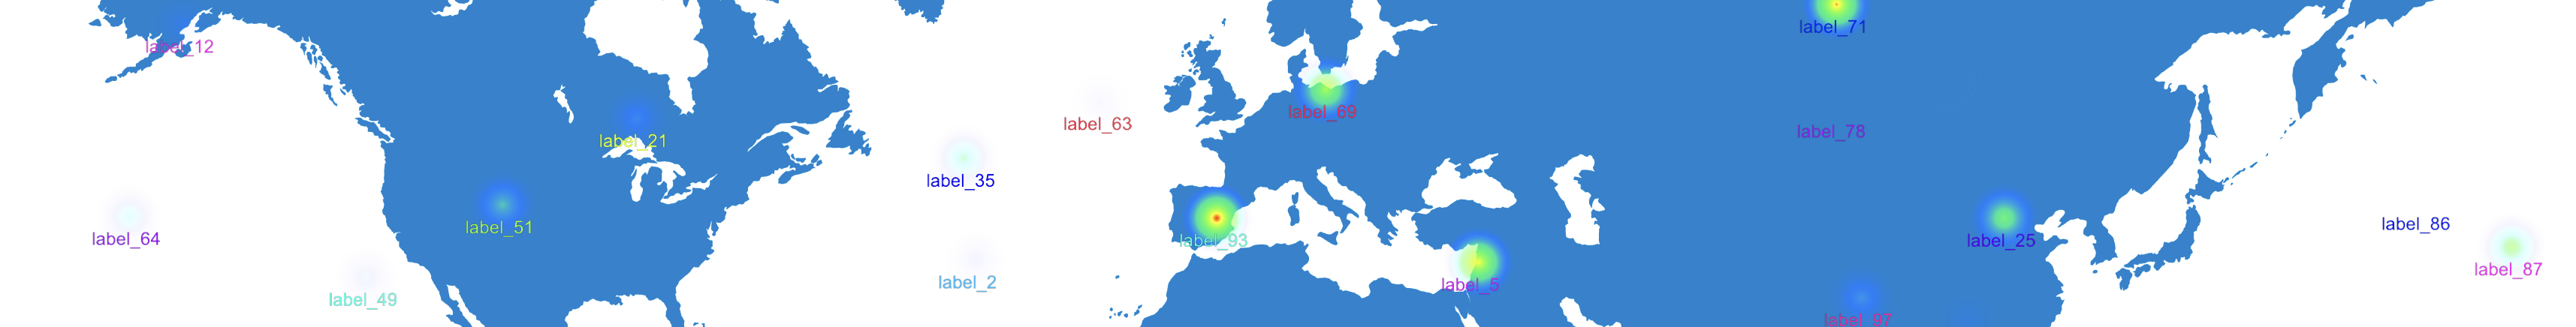
backgroundImage: {
url: "urlPath", // image url
width: 100, // if not set, viewport width of the image will be considered
height: 100, // if not set, viewport height of the image will be considered
x: 0,
y: 0
},
gradient: [{
color: [0, 0, 255, 1.0],
offset: 0
}, {
color: [0, 0, 255, 1.0],
offset: 0.2
}, {
color: [0, 255, 0, 1.0],
offset: 0.45
}, {
color: [255, 255, 0, 1.0],
offset: 0.85
}, {
color: [255, 0, 0, 1.0],
offset: 1.0
}]
});Container/ContainerId : The container div element or a string CSS Query selector that identifies the container.
Config Object :
{
     size : Radius of the data point, in pixels. Default: 20
     max : Max data Value for relative gradient computation. if not set, will be derived from data.
     min : Min data Value for relative gradient computation. if not set, will be derived from data.
     intensity : intensity factor. Default: 1.0
     opacity : Opacity factor. Default: 1.0
     rotationAngle : Rotation angle. Default: 0
     translate : translate vector [x, y]. Default: [0,0]
     zoom : Zoom Factor. Default: 1.0
     gradient : Color Gradient, an array of objects with color value and offset.
     backgroundImage: To set the background for the heatMap. Value : { url: , x: , y: , height: , width: }
}
Accepts an array of data points with 'x', 'y' and 'value'. Demo
instance.renderData([{x: , y: , value: }])Accepts an array of data points with 'x', 'y', and 'value' and a boolean flag to specify to apply existing heatmap transformations on the newly added data points. After adding data points, need to invoke the .render() method to update the heatmap.
Try Example
instance.addData([{x: , y: , value: }],transformationIntactflag)Method to re-render the heatmap. This method needs to be invoked as and when configurations get changed. Example
instance.render()To set max data value, for relative gradient calculations.
To set min data value, for relative gradient calculations.
Api to perform translate transformation on the canvas. Accepts array[x, y] as an input. Try Example
Api to perform zoom transformation on the canvas. Accepts float value as an input. Try Example
Api to perform rotation transformation on the canvas. Accepts angle in radians. Try Example
Api to set point radius. Accepts float value as an input. Try Example
Api to set color gradient. Accepts array of objects with color value and offset.
Api to set the Intensity factor. Accepts float value as an input. Try Example
Api to set Opacity factor. Accepts float value as an input. Try Example
Api to set Background image. Accepts Object with { Url, height, width, x, and y} properties as input Try Example
Api to get projected co-ordinates relative to the heatmap layer. Try Example
Api to rerender heatmap on parent container resizes.
Api to clear canvas.
Please give a ⭐️ if this project helped you!

![dependabot[bot] avatar](https://avatars.githubusercontent.com/in/29110?v=4 "dependabot[bot]")


