Comments (11)
 snapper911T
commented on May 13, 2024
1
snapper911T
commented on May 13, 2024
1
Ok it works now! I followed the same steps as detailed above but after i snapped the rectangle to the two guides I then entered "100" manually to the width as you mentioned.
Thanks!
from charticulator.
snapper911T
commented on May 13, 2024
1
Curious if there is a way to take the PBI.viz that Charticulator creates, rename as a .zip, and extract the .JS for use in PBI visual tools? This way I could generate the initial visual in Charticulator but fine tune or fix small items within the PBI custom visual SDK to compile and create custom viz?
from charticulator.
 donghaoren
commented on May 13, 2024
donghaoren
commented on May 13, 2024
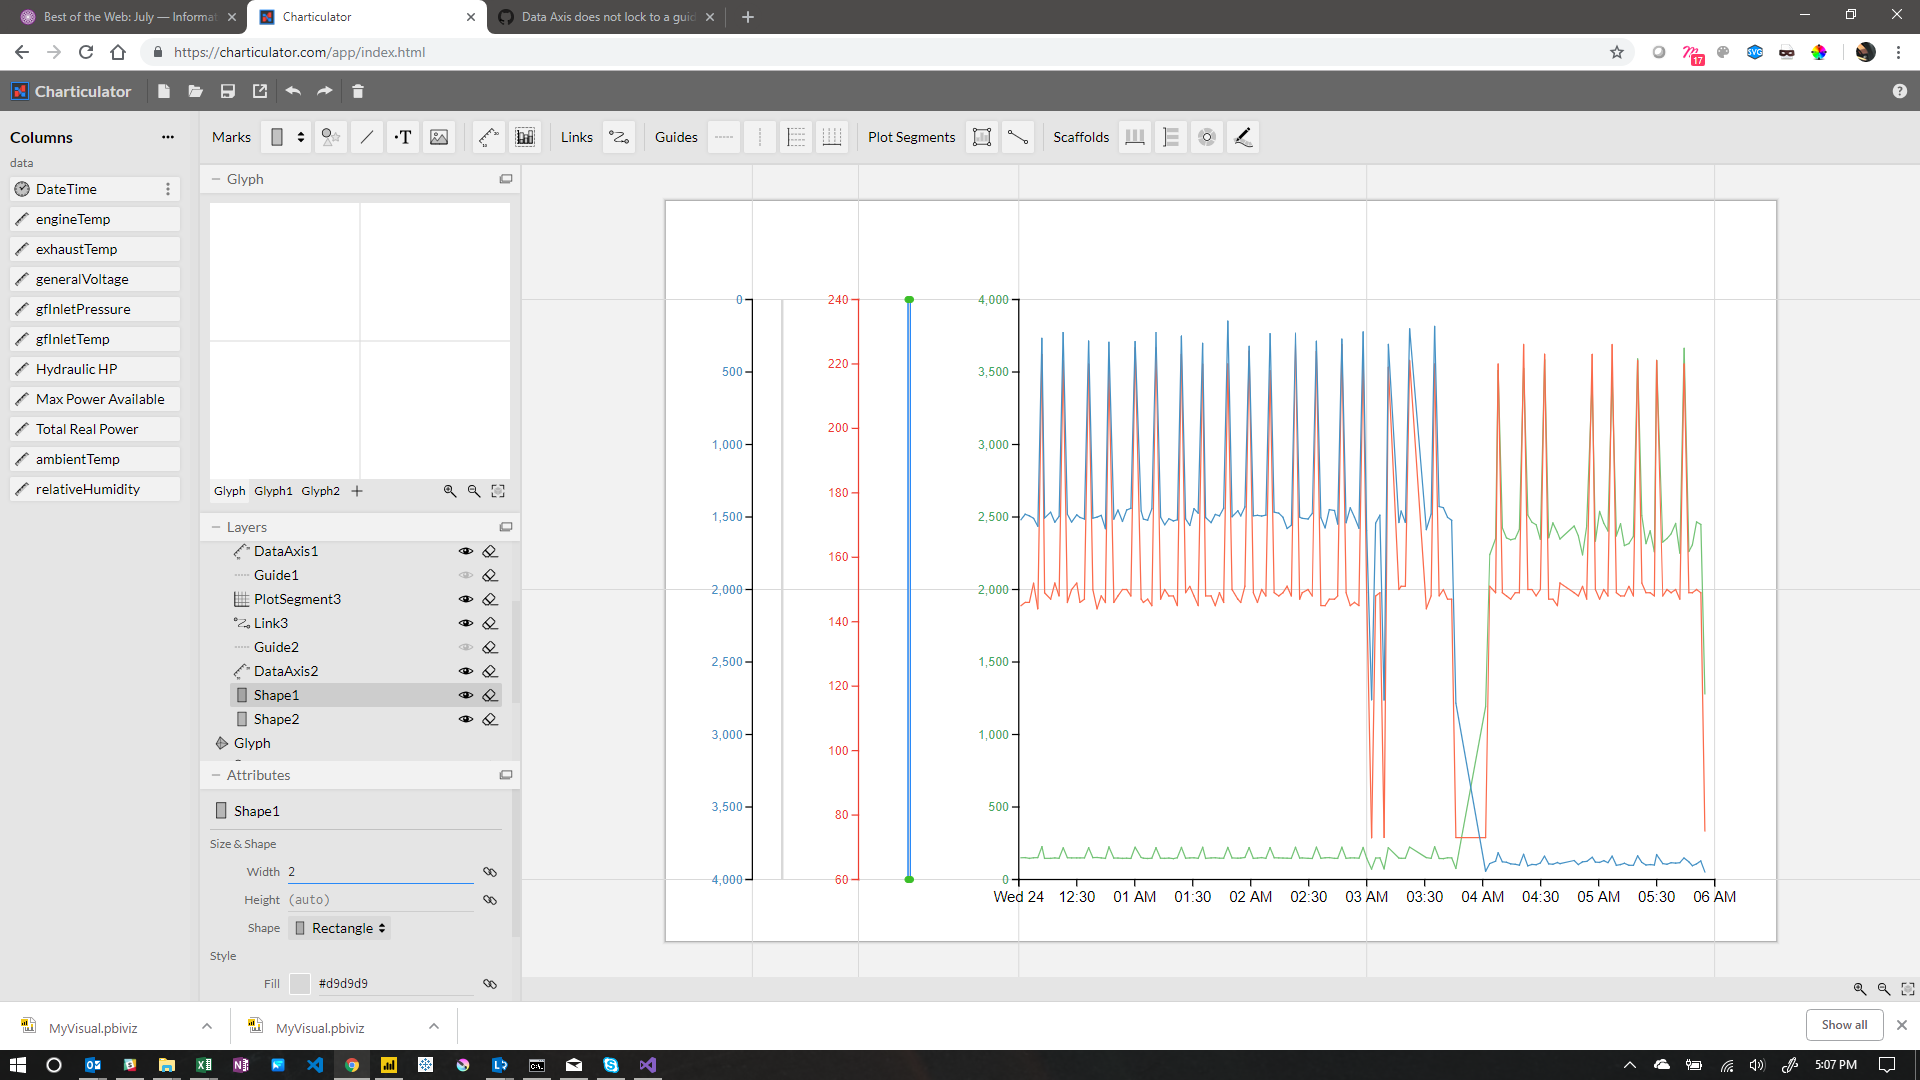
This is a bug, guides are not retaining their original positions when exported into a visual. If you want to make a working visual before we fix it, you can use this "invisible rect" hack:
- Add two rects between the three vertical guides (i.e., one between the blue and red, another one between the red and green). The rects should be snapped to the guides.
- Set the width of the rects to a desired value by selecting the rect and entering a number in its "width" attribute. If a rect is snapped correctly, setting its width will affect the position of the guide (because Charticulator uses a constraint-based layout algorithm!)
- Make the rect invisible by setting its opacity to 0, or simply remove the stroke and fill colors.
from charticulator.
snapper911T
commented on May 13, 2024
I tried this but it doesn't seem to fix anything when i output:
Add a rectangle shape between both data guides:
I resized the width of the rectangles to 2px then snapped to the guides:

When i export the 2 guides still snap back to center in PBI.
from charticulator.
donghaoren
commented on May 13, 2024
For this to work, the rectangle should be snapped to both vertical guides:

from charticulator.
donghaoren
commented on May 13, 2024
Actually, we've added a "Split Gap" property for the guides, setting it to non-zero will split the guide into two guides with the gap value. You can use this feature to do relative positioning, for example:

Here we first split the guide into two with a gap of 100 pixels, then, we snap the right one to one of the existing chart guides. Finally, we add two axes to the chart. You can see that the left axis now respond to chart size changes -- the two will always be 100 pixels apart.
You can use either the above "invisible rect" hack, or use this new split guide feature to position the axes.
from charticulator.
snapper911T
commented on May 13, 2024
Neither was successful for me upon export to PBIVIZ. I did notice you are using a "plot segment" instead of a "data axis" to create the additional Y axis. I tried both and they both snap back to center. Essentially I am creating a multiple Y axis line chart and i want the Y axis to have independent scales.
My steps:
-
Create initial 2D plot segment with datetime field for X axis and measure 1 for Y axis.

-
Next, I add another glyph and create a second 2 D plot overlaying the first one. Add the same date time field on the X axis but another measure for the Y axis. Add a circle mark to the glyph panel and then hide the Y and X axis labels. Last I added a vertical guide to the left of the plots.

-
Add a rectangle between the new vertical guide and the left most guide for the two 2D plots.
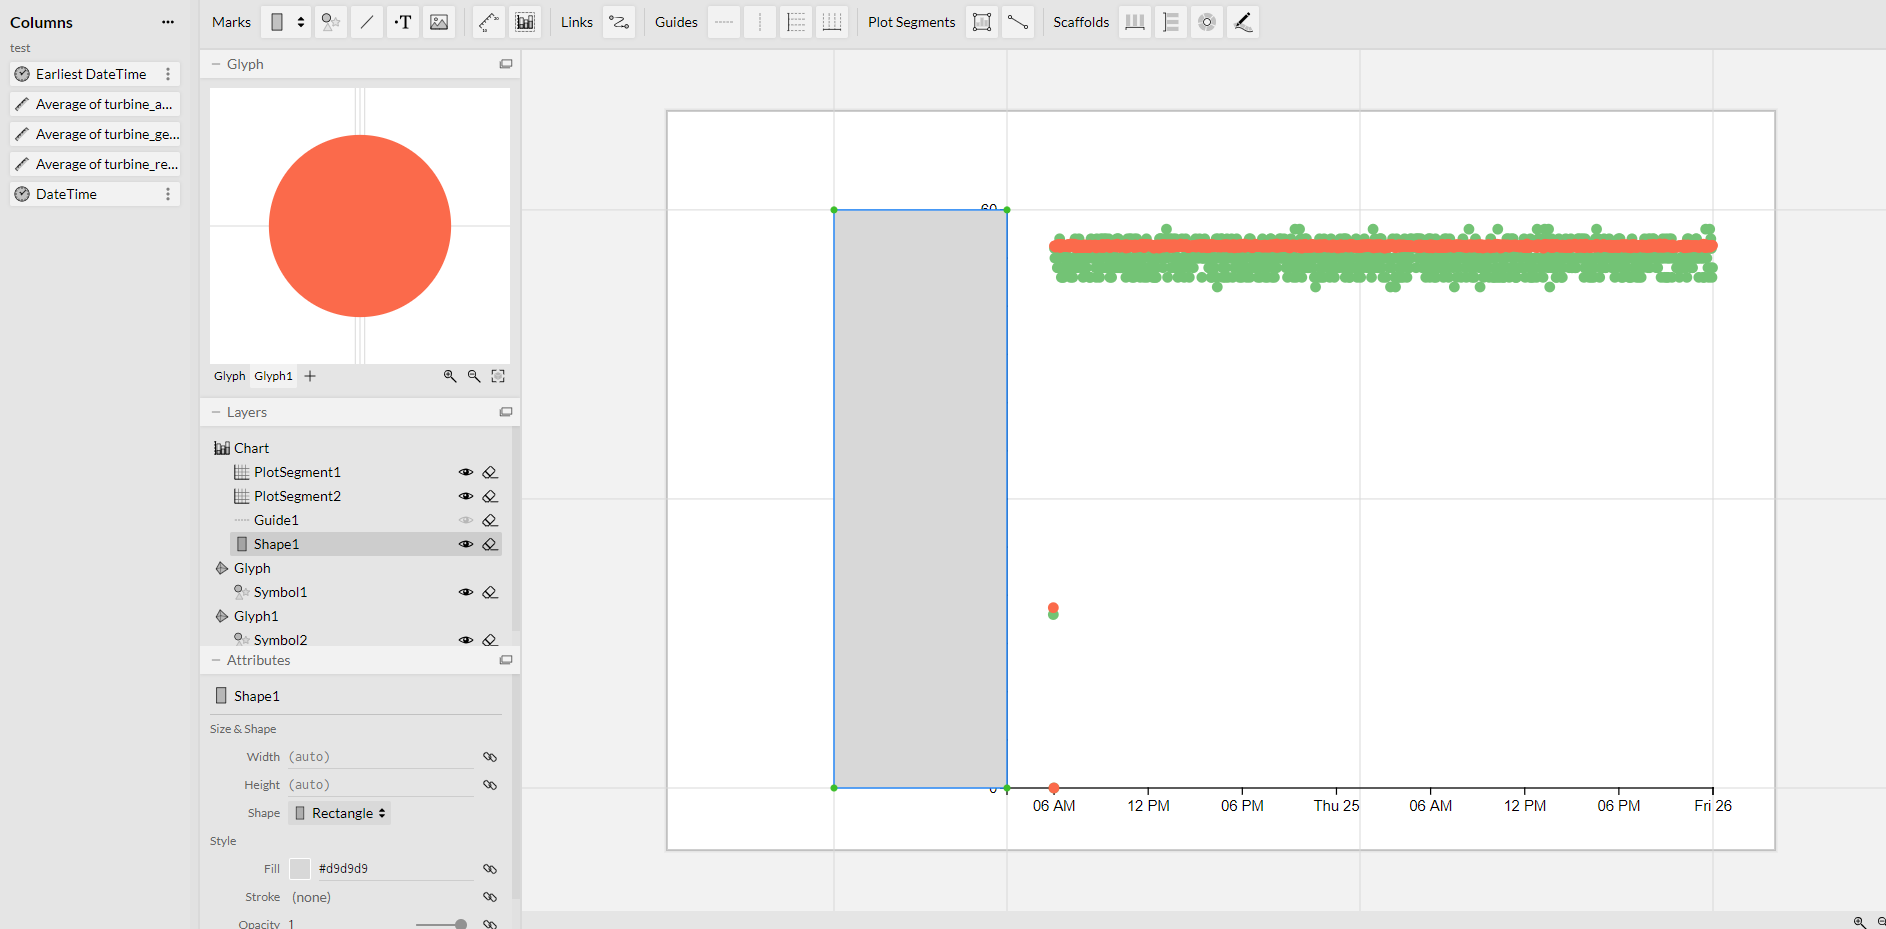
-
Make the rectangle transparent.

-
Add a data axis snapped to the left most vertical guide.

-
Output to PBI

Appreciate the help here! Very happy you are still developing this tool!
from charticulator.
donghaoren
commented on May 13, 2024
Could you try setting the width of the rectangle manually? i.e., enter something like 100 to its "Width" attribute.
from charticulator.
donghaoren
commented on May 13, 2024
Technically, you can extract the zip file. But I don't think it would be helpful, because it's doesn't resemble any visualization code you'd expect (e.g., something written with D3), so it would be very hard to modify.
I'd vote for an alternative way -- adding a popup Charticulator editor from Power BI so you can adjust the visualization after you've put data into it. We'll look into this possibility, but can't promise it can be implemented...
from charticulator.
snapper911T
commented on May 13, 2024
I'd argue if this tool keeps being developed there is little need to touch D3.js anyway unless you want to get real advanced...and this makes me very happy :)
from charticulator.
 bongshin
commented on May 13, 2024
bongshin
commented on May 13, 2024
I'm closing this issue because there is no further discussion.
from charticulator.
Related Issues (20)
- export HTML with no picture HOT 1
- How to delete a glyph? HOT 3
- Issue with legends not updating properly/displaying wrong colors
- Missing bar in plotted waterfall chart after clicking Save
- Charticulator chart date display vs Power BI HOT 5
- CHARTICULATOR.COM shows images correctly. CHARTICULATOR Power BI does not behave correctly using same file HOT 3
- Unable to update the order by field when the data is getting change in visuals
- Charticulator can not show quarter in date. HOT 2
- How to delete a Glyph?
- Shape Legend not displaying in Charticulator HOT 1
- Export to html, no image HOT 1
- Can't drag and drop Scaffold HOT 1
- Sev X Test Bug
- User has a column based on the hex code of which the color of the visual is supposed to render . This was working before and started occuring in Service and Desktop few months back. Issue is only with the color of the visual and not the visual data has context menu HOT 3
- Conditional Visibility Not Working
- npm install yarn npm ERR! code ERESOLVE npm ERR! ERESOLVE could not resolve npm ERR!
- What will happen to the Power BI visual at the end of 2023 if the project is being retired? HOT 8
- Custom visual is not displaying correctly in Power BI. HOT 1
- yarn build error: Error: error:0308010C:digital envelope routines::unsupported HOT 2
- Charticulator Links having no data
Recommend Projects
-
 React
React
A declarative, efficient, and flexible JavaScript library for building user interfaces.
-
Vue.js
🖖 Vue.js is a progressive, incrementally-adoptable JavaScript framework for building UI on the web.
-
 Typescript
TypeScript is a superset of JavaScript that compiles to clean JavaScript output.
-
TensorFlow
An Open Source Machine Learning Framework for Everyone
-
Django
The Web framework for perfectionists with deadlines.
-
 Laravel
A PHP framework for web artisans
-
D3
Bring data to life with SVG, Canvas and HTML. 📊📈🎉
-
Recommend Topics
-
javascript
JavaScript (JS) is a lightweight interpreted programming language with first-class functions.
-
web
Some thing interesting about web. New door for the world.
-
server
A server is a program made to process requests and deliver data to clients.
-
Machine learning
Machine learning is a way of modeling and interpreting data that allows a piece of software to respond intelligently.
-
Visualization
Some thing interesting about visualization, use data art
-
Game
Some thing interesting about game, make everyone happy.
Recommend Org
-
Facebook
We are working to build community through open source technology. NB: members must have two-factor auth.
-
Microsoft
Open source projects and samples from Microsoft.
-
Google
Google ❤️ Open Source for everyone.
-
Alibaba
Alibaba Open Source for everyone
-
D3
Data-Driven Documents codes.
-
Tencent
China tencent open source team.
from charticulator.