Comments (9)
 DanielGoldfarb
commented on May 17, 2024
DanielGoldfarb
commented on May 17, 2024
This is strange. The code specifically sets the upper limit on the yaxis to 1.1 * max(volumes).
Will have to investigate why that doesn't seem to be working as expected here.
Can you please provide the data, and code, that were used to generate this plot?
from mplfinance.
 fintron
commented on May 17, 2024
fintron
commented on May 17, 2024
Here's the sample:
sample.csv.zip
code:
import pandas as pd
import mplfinance as mpf
df = pd.read_csv('sample.csv', index_col=0, parse_dates=True)
mpf.plot(df, type='line', volume=True)
Also, it it a bug that there's empty room on the left and right sides of the graph? (ie. before Jan 2 9:30) and at the right most part of the graph)? Should I create a new bug for it?
Thanks so much for your help and creation of this library btw - super helpful!
from mplfinance.
DanielGoldfarb
commented on May 17, 2024
In your sample file, out of almost 2300 data points, there are 4 large volumes:
| timestamp | Open | High | Low | Close | Volume |
|---|---|---|---|---|---|
| 2020-01-02 09:30:00-05:00 | 1341.55 | 1347.28 | 1341.55 | 1347.01 | 53112 |
| 2020-01-07 09:30:00-05:00 | 1397.94 | 1397.94 | 1393.29 | 1395.52 | 44491 |
| 2020-01-03 15:59:00-05:00 | 1360.09 | 1362.23 | 1359.48 | 1359.49 | 40712 |
| 2020-01-06 12:05:00-05:00 | 1386.4519 | 1387.415 | 1386.4519 | 1387.415 | 39615 |
I don't have time now to play with it myself, but I suspect that, given the resolution of your plot, and the large number of data points (2295), you are unable to see these four outliers on the plot.
You could play with the zoom, and/or set kwarg figscale=2.5 maybe, to be able to actually see them on the plot. At any rate, it appears that the one point at 53112 is what is setting ymax to over 58000.
Please let me know if that solves your problem.
from mplfinance.
DanielGoldfarb
commented on May 17, 2024
Btw, it is normal and behaving as expected to have some space on the left before the first data point, and some on the right after the last. This was mentioned once before. This is standard practice generally for plotting. However if it's regarded as too much (i think it's about right) or if there is enough demand for an option to have the first and last data point exactly at the left and right axes, we can consider adding that as an option.
from mplfinance.
DanielGoldfarb
commented on May 17, 2024
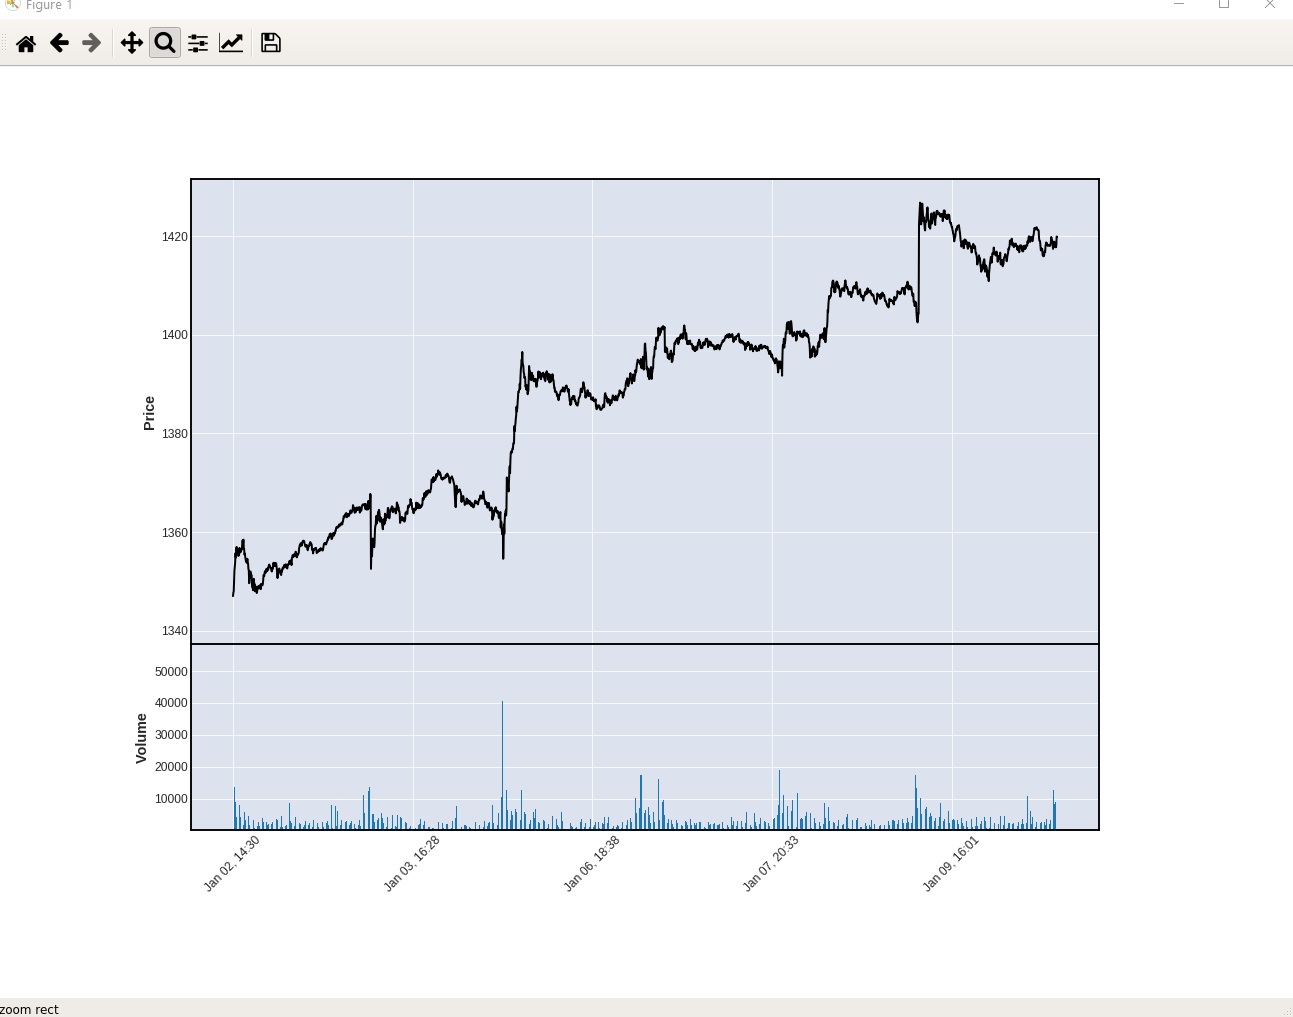
Above is plot before zoom.
Below using the magnifying glass zoom feature on the plot, shows the high volume at the beginning that is resonsible for the high y-axis limit on the lower subplot. The single volume bar is so narrow with this much data, and happens to line up very close with one of the grid lines, so it cannot be seen when zoomed out.
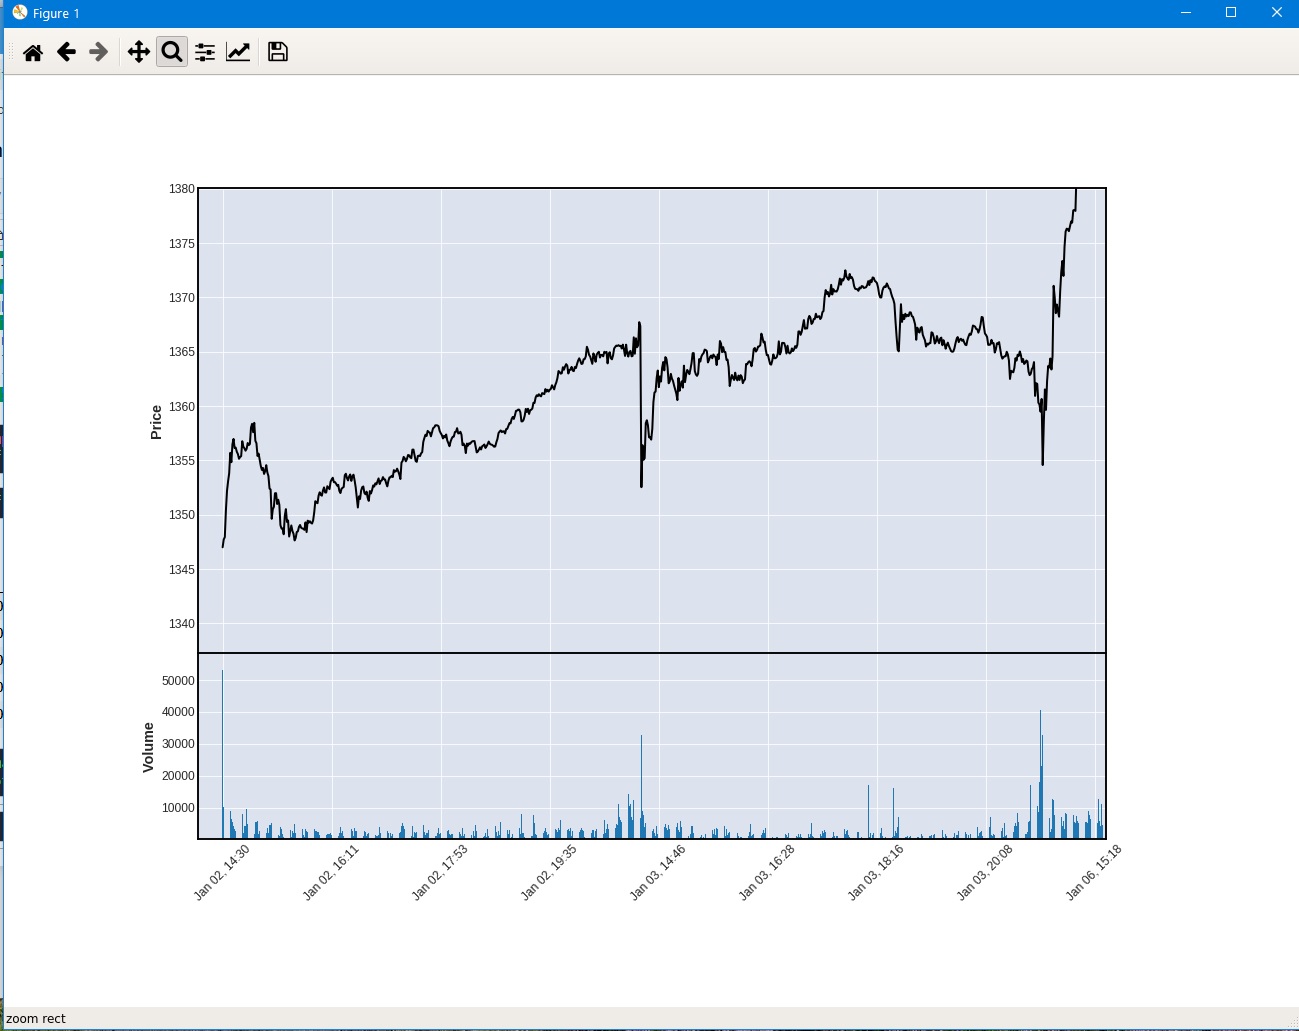
Plotting only the first day also makes it easy to see the one, very high volume:
mpf.plot(df.loc[:'2020-01-02',:], type='line', volume=True)

from mplfinance.
DanielGoldfarb
commented on May 17, 2024
@fintron - Thank you very much for providing the data and the code. That made it much easier to find the issue.
from mplfinance.
fintron
commented on May 17, 2024
@DanielGoldfarb - thanks for your help!
However if it's regarded as too much (i think it's about right) or if there is enough demand for an option to have the first and last data point exactly at the left and right axes, we can consider adding that as an option.
That would be nice to have as an option!
from mplfinance.
fintron
commented on May 17, 2024
@DanielGoldfarb - it could be nice to support aggregating volume in the plot below. For example, if the graph is in minutes but that’s too fine for the volume, maybe just plot aggregates of 5 minutes in the volume graph below?
from mplfinance.
DanielGoldfarb
commented on May 17, 2024
So you would want to aggregate the volumes to 5 mins, but leave the OHLC at 1 min??
Certainly it is easy to aggregate both using Pandas as noted in #19 and demonstrated here. However there is a basic assumption in the code that volume and prices (which share the x-axis) have the same periodicity, but possiblely if I can break that assumption without over complicating the code I would consider it. It's an interesting idea, but I also wonder how often people would want it. Personally if I were to aggregate the volumes, I would probably want to aggregate the prices so that my open,high,low, and close apply to the same 5 minute intervals (which as noted above can be done easily with Pandas resample).
from mplfinance.
Related Issues (20)
- how to get OHLC return values and trend from renko plot HOT 1
- Issue while trying to get_ydata of an EMA from a fig or from the axes HOT 3
- Subplot and panel work fine when they use separately, but mix up when I try to use them in same figure, how can I solve? HOT 8
- Feature Request: HOT 2
- How do i get renko values without ploting the chart? HOT 2
- weird orange line appearing in axes' .plot() HOT 1
- Parabolic Sar and supertrend for renko
- Assist to draw Simple Moving Average. HOT 2
- I just don't know who to ask…. HOT 1
- mplfinance warn if user passes an empty data set. HOT 1
- Feature Request: The line width argument adding request for 'candlestick_ohlc' about the 'Wick/shadow' part(above/blow line) HOT 9
- Bug Report: marketcolors display error when open=close HOT 1
- Bug Report: Typo HOT 1
- How do I create a buy indicator using mplfinance? HOT 1
- Using with `matplotlib.testing.decorators.image_comparison` HOT 6
- PNF ATR Boxsize HOT 4
- Hollow and Filled Candles HOT 1
- Feature Request: Add SubFigures to Mpf_Figure HOT 2
- The example image of price-movement_plots.ipynb is inconsistent with the displayed result. HOT 3
- Interactive plots for OHLC candles with mplfinance HOT 1
Recommend Projects
-
 React
React
A declarative, efficient, and flexible JavaScript library for building user interfaces.
-
Vue.js
🖖 Vue.js is a progressive, incrementally-adoptable JavaScript framework for building UI on the web.
-
 Typescript
TypeScript is a superset of JavaScript that compiles to clean JavaScript output.
-
TensorFlow
An Open Source Machine Learning Framework for Everyone
-
Django
The Web framework for perfectionists with deadlines.
-
 Laravel
A PHP framework for web artisans
-
D3
Bring data to life with SVG, Canvas and HTML. 📊📈🎉
-
Recommend Topics
-
javascript
JavaScript (JS) is a lightweight interpreted programming language with first-class functions.
-
web
Some thing interesting about web. New door for the world.
-
server
A server is a program made to process requests and deliver data to clients.
-
Machine learning
Machine learning is a way of modeling and interpreting data that allows a piece of software to respond intelligently.
-
Visualization
Some thing interesting about visualization, use data art
-
Game
Some thing interesting about game, make everyone happy.
Recommend Org
-
Facebook
We are working to build community through open source technology. NB: members must have two-factor auth.
-
Microsoft
Open source projects and samples from Microsoft.
-
Google
Google ❤️ Open Source for everyone.
-
Alibaba
Alibaba Open Source for everyone
-
D3
Data-Driven Documents codes.
-
Tencent
China tencent open source team.
from mplfinance.