Comments (8)
 jolars
commented on May 19, 2024
1
jolars
commented on May 19, 2024
1
eulerr uses grid graphics, not base graphics. Try gridExtra::grid.arrange(plot(fit1), plot(fit2)).
from eulerr.
 JudithvanSanten
commented on May 19, 2024
1
JudithvanSanten
commented on May 19, 2024
1
Thank you so much! that works great!
from eulerr.
JudithvanSanten
commented on May 19, 2024
Dear Jolars,
I have a follow-up question.
I would like to plot several plots next to eachother and each make them have a title.
How can I combine these two codes:
gridExtra::grid.arrange(plot(euler1, quantities = TRUE),plot(euler2, quantities = TRUE))
and
plot1 <- plot(euler1)
grid.arrange(grobs = list(plot1), top = "Title 1")
Kind regards, Judith
from eulerr.
jolars
commented on May 19, 2024
Use the main argument in plot.euler(), like so:
library(eulerr)
library(gridExtra)

p1 <- plot(euler(c(A = 1)), main = "Foo")
p2 <- plot(euler(c(B = 1)), main = "Bar")
grid.arrange(p1, p2, ncol = 2)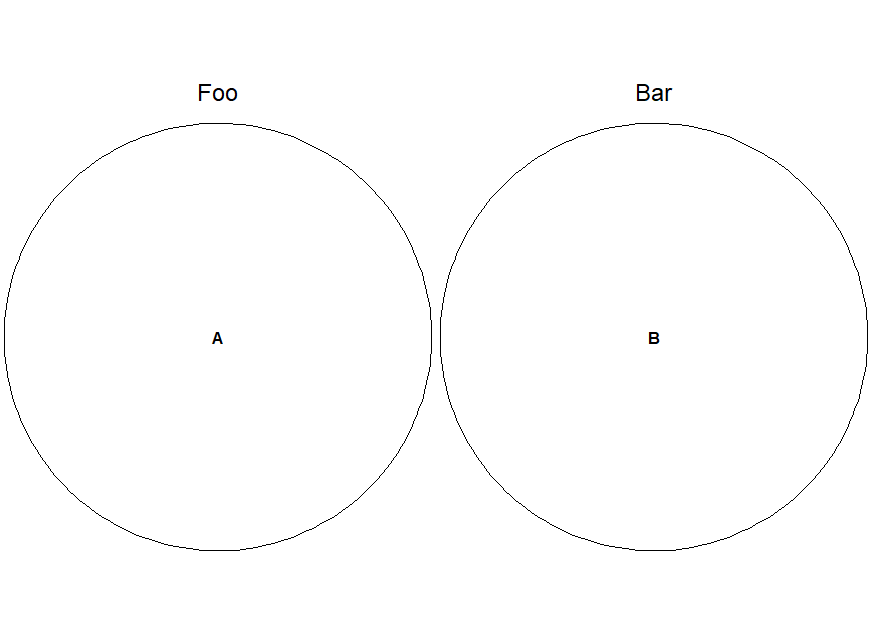
from eulerr.
JudithvanSanten
commented on May 19, 2024
Thank you. it works now.
before I also used the 'main' argument in 'plot', but it would never show the title, and I found this topic: #27
but now it indeed works.
thank you for the quick reply. have a great day
from eulerr.
 vonjd
commented on May 19, 2024
vonjd
commented on May 19, 2024
Unfortunately the titles don't show up in this example either... please advise - Thank you
from eulerr.
jolars
commented on May 19, 2024
What version of the package are you using @vonjd ?
from eulerr.
vonjd
commented on May 19, 2024
Oops... my bad: it works in v 5.1
from eulerr.
Related Issues (20)
- eulerr not working with r 4.2.0 HOT 1
- Missing overlaps and areas in euler vs venn HOT 2
- Overlap of four sets is missing observations HOT 1
- label and percent/count font size and space in between? HOT 1
- eulerr fits my data wrong, not sure what is the problem HOT 1
- Display big numbers with a comma HOT 1
- Overlapping area colors HOT 1
- Can't intall under R version 4.3.0 HOT 4
- color of intersection not changes for some intersections HOT 2
- radius and co-ordinates changes on every run with four sets venn diagram HOT 2
- very slow, Doesn't work with large datasets HOT 6
- basic use raises error and sometimes crashes R HOT 1
- Empty "interaction" present HOT 1
- Missing overlaps in euler plot HOT 2
- missing overlaps using eulerr HOT 3
- Cannot "unbold" labels HOT 2
- Option to have areas proportional to the *log* of the populations?
- The overlaps of last row data cannot be viewed from the plot
- Plotting euler diagram overrides multi-panel layout HOT 1
- percent and counts on two different lines? HOT 1
Recommend Projects
-
 React
React
A declarative, efficient, and flexible JavaScript library for building user interfaces.
-
Vue.js
🖖 Vue.js is a progressive, incrementally-adoptable JavaScript framework for building UI on the web.
-
 Typescript
TypeScript is a superset of JavaScript that compiles to clean JavaScript output.
-
TensorFlow
An Open Source Machine Learning Framework for Everyone
-
Django
The Web framework for perfectionists with deadlines.
-
 Laravel
A PHP framework for web artisans
-
D3
Bring data to life with SVG, Canvas and HTML. 📊📈🎉
-
Recommend Topics
-
javascript
JavaScript (JS) is a lightweight interpreted programming language with first-class functions.
-
web
Some thing interesting about web. New door for the world.
-
server
A server is a program made to process requests and deliver data to clients.
-
Machine learning
Machine learning is a way of modeling and interpreting data that allows a piece of software to respond intelligently.
-
Visualization
Some thing interesting about visualization, use data art
-
Game
Some thing interesting about game, make everyone happy.
Recommend Org
-
Facebook
We are working to build community through open source technology. NB: members must have two-factor auth.
-
Microsoft
Open source projects and samples from Microsoft.
-
Google
Google ❤️ Open Source for everyone.
-
Alibaba
Alibaba Open Source for everyone
-
D3
Data-Driven Documents codes.
-
Tencent
China tencent open source team.
from eulerr.