Comments (29)
 qqqdu
commented on April 27, 2024
19
qqqdu
commented on April 27, 2024
19
已成功在 WePy导入 echarts 做法和 @denty 一样,都是将原生组件变为 WePy组件,但是 denty 的代码有些细节问题。
下面是转化完的组件。
<template>
    <canvas class="ec-canvas"
            canvas-id="mychart-pie"
            style="width:200px;height:200px;display:block;">
    </canvas>
</template>

<script>
    import wepy from 'wepy';
    import WxCanvas from '../ec-canvas/wx-canvas';
    import * as echarts from '../ec-canvas/echarts';
    export default class EcCanvas extends wepy.component {
        data = {
            canvasId: 'mychart-pie'
        }

       props = {
            ec: {
                type: Object
            }
        }

        methods = {
            touchStart(e) {
                if (this.chart && e.touches.length > 0) {
                    var touch = e.touches[0];
                    this.chart._zr.handler.dispatch('mousedown', {
                        zrX: touch.x,
                        zrY: touch.y
                    });
                    this.chart._zr.handler.dispatch('mousemove', {
                        zrX: touch.x,
                        zrY: touch.y
                    });
                }
            },

            touchMove(e) {
                if (this.chart && e.touches.length > 0) {
                    var touch = e.touches[0];
                    this.chart._zr.handler.dispatch('mousemove', {
                        zrX: touch.x,
                        zrY: touch.y
                    });
                }
            },

            touchEnd(e) {
                if (this.chart) {
                    const touch = e.changedTouches ? e.changedTouches[0] : {};
                    this.chart._zr.handler.dispatch('mouseup', {
                        zrX: touch.x,
                        zrY: touch.y
                    });
                    this.chart._zr.handler.dispatch('click', {
                        zrX: touch.x,
                        zrY: touch.y
                    });
                }
            }
        }

        init(callback) {
            const version = wx.version.version.split('.').map(n => parseInt(n, 10));
              const isValid = version[0] > 1 || (version[0] === 1 && version[1] >= 9)
                || (version[0] === 1 && version[1] === 9 && version[2] >= 91);
              if (!isValid) {
                console.error('微信基础库版本过低,需大于等于 1.9.91。'
                  + '参见:https://github.com/ecomfe/echarts-for-weixin'
                  + '#%E5%BE%AE%E4%BF%A1%E7%89%88%E6%9C%AC%E8%A6%81%E6%B1%82');
                return;
              }

              const ctx = wx.createCanvasContext(this.canvasId, this);
              console.log(ctx)
              const canvas = new WxCanvas(ctx);

              echarts.setCanvasCreator(() => {
                return canvas;
              });
              var query = wx.createSelectorQuery();
              console.log(query.select('.ec-canvas'))
              query.select('.ec-canvas').boundingClientRect(res => {
                if (typeof callback === 'function') {
                  this.chart = callback(canvas, res.width, res.height);
                }
                else if (this.ec && this.ec.onInit) {
                  this.chart = this.ec.onInit(canvas, res.width, res.height);
                }
              }).exec();
        }

        onLoad() {
            console.log(this)
            console.log('canvasId', this.canvasId)
            if (!this.ec) {
                console.warn('组件需绑定 ec 变量,例:<ec-canvas id="mychart-dom-bar" ' + 'canvas-id="mychart-bar" ec="{{ ec }}"></ec-canvas>');
                return;
            }
            if (!this.ec.lazyLoad) {
                this.init();
            }
        }
    }
</script>

<style lang="css">
    .ec-canvas {
        width: 100%;
        height: 100%;
        display: block;
    }
</style>
如果canvasId是通过Prop传进来的,好像canvas不会显示,猜测可能在小程序渲染的节点的时候,canvasId还没有被传过来,这时,小程序检测到 canvas 没有 Id,就会 display:none,所以我这里将canvaId 固定写死在 data 里。
from echarts-for-weixin.
 Gcaufy
commented on April 27, 2024
8
Gcaufy
commented on April 27, 2024
8
wepy 在初始化时,会用初始数据进行一次 setData, 而这样正好命中了官方小程序的一个bug。因此解决这个问题的方法有两种:
- 延时 init
echarts 提交一个 lazyLoad 属性,以及一个可调用方法 init, 可以手动去触发 init 方法
<template>
    <ec-canvas id="mychart-dom-bar" canvas-id="mychart-bar" ec="{{ ec }}"></ec-canvas>
</template>
<script>
   import wepy from 'wepy';

   function initChart(canvas, w, h) {}

  export default class Index extends wepy.page {
     config = {
        "usingComponents": {
             "ec-canvas": "../../libs/ec-canvas/ec-canvas"
        }
     }
     data = {
       ec: { lazyLoad: true }
     }
     onReady () {
       this.$wxpage.selectComponent('#mychart-dom-bar').data.ec.onInit = initChart;
       this.$wxpage.selectComponent('#mychart-dom-bar').init();
     }
  }
</script>
- 推荐:使用 triggerEvent
修改ec-charts 源码,使用triggerEvent 去调用 init 事件
参考: #202
from echarts-for-weixin.
 denty
commented on April 27, 2024
2
denty
commented on April 27, 2024
2
是这样的,使用wepy框架的话,和原始的小程序组件方式不太一样.
会使用和vue一样的风格编写一个组件,再通过wepy的build命令建立出和小程序类似的组件进行使用.
我这里使用的import EcCanvas 中我已经重新的编写ec-canvas.wpy文件,替换掉你项目里面的ec-canvas.js ec-canvas.wxml ec-canvas.wxss 这三个文件
具体代码如下:
<template>
    <canvas class="ec-canvas" canvas-id="{{ canvasId }}" @init="init" @touchstart="touchStart" @touchmove="touchMove" @touchend="touchEnd">
    </canvas>
</template>

<script>
    import wepy from 'wepy';
    import WxCanvas from './wx-canvas';
    import * as echarts from './echarts';
    export default class EcCanvas extends wepy.component {
        props = {
            canvasId: {
                type: String,
                default: 'ec-canvas'
            },
            ec: {
                type: Object
            }
        }
        methods = {
            init(callback) {
                const version = wx.version.version.split('.').map(n => parseInt(n, 10));
                const isValid = version[0] > 1 || (version[0] === 1 && version[1] >= 9) ||
                    (version[0] === 1 && version[1] === 9 && version[2] >= 91);
                if (!isValid) {
                    console.error('微信基础库版本过低,需大于等于 1.9.91。' + '参见:https://github.com/ecomfe/echarts-for-weixin' + '#%E5%BE%AE%E4%BF%A1%E7%89%88%E6%9C%AC%E8%A6%81%E6%B1%82');
                    return;
                }

                const ctx = wx.createCanvasContext(this.data.canvasId, this);

                const canvas = new WxCanvas(ctx);

                echarts.setCanvasCreator(() => {
                    return canvas;
                });

                var query = wx.createSelectorQuery().in(this);
                query.select('.ec-canvas').boundingClientRect(res => {
                    if (typeof callback === 'function') {
                        this.chart = callback(canvas, res.width, res.height);
                    } else if (this.data.ec && this.data.ec.onInit) {
                        this.chart = this.data.ec.onInit(canvas, res.width, res.height);
                    }
                }).exec();
            },

            touchStart(e) {
                if (this.chart && e.touches.length > 0) {
                    var touch = e.touches[0];
                    this.chart._zr.handler.dispatch('mousedown', {
                        zrX: touch.x,
                        zrY: touch.y
                    });
                    this.chart._zr.handler.dispatch('mousemove', {
                        zrX: touch.x,
                        zrY: touch.y
                    });
                }
            },

            touchMove(e) {
                if (this.chart && e.touches.length > 0) {
                    var touch = e.touches[0];
                    this.chart._zr.handler.dispatch('mousemove', {
                        zrX: touch.x,
                        zrY: touch.y
                    });
                }
            },

            touchEnd(e) {
                if (this.chart) {
                    const touch = e.changedTouches ? e.changedTouches[0] : {};
                    this.chart._zr.handler.dispatch('mouseup', {
                        zrX: touch.x,
                        zrY: touch.y
                    });
                    this.chart._zr.handler.dispatch('click', {
                        zrX: touch.x,
                        zrY: touch.y
                    });
                }
            }
        }

        onLoad() {
            if (!this.ec) {
                console.warn('组件需绑定 ec 变量,例:<ec-canvas id="mychart-dom-bar" ' + 'canvas-id="mychart-bar" ec="{{ ec }}"></ec-canvas>');
                return;
            }

            if (!this.ec.lazyLoad) {
                this.init();
            }
        }
    }
</script>

<style lang="css">
    .ec-canvas {
        width: 100%;
        height: 100%;
    }
</style>
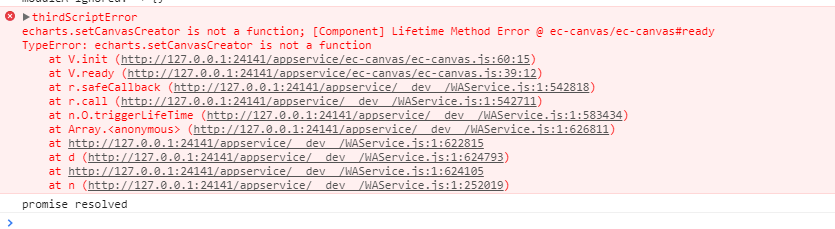
再通过外部的page页面使用我这里重新编写的ec-canvas.js组件 , 但是在微信的编译器中却出现了,上面的 getAttribute 的问题
具体的 page中的代码如下:
<template>
<view class='container'>
<ecCanvas id='mychart-dom-pie' :canvasId.sync='canvasId' :ec.sync='ec'></ecCanvas>
</view>
</template>
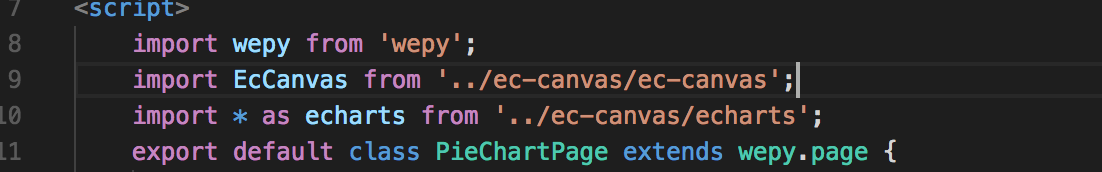
<script>
import wepy from 'wepy';
import EcCanvas from '../ec-canvas/ec-canvas';
import * as echarts from '../ec-canvas/echarts';
export default class PieChartPage extends wepy.page {
config = {
navigationBarTitleText: '饼图'
};
components = {
ecCanvas: EcCanvas
};
data = {
canvasId: 'mychart-pie',
ec: {
onInit: this.initChart()
}
};
onLoad() {
console.log('heheheeheh');
}
initChart(canvas, width, height) {
const chart = echarts.init(canvas, null, {
width: width,
height: height
});
canvas.setChart(chart);
var option = {
backgroundColor: '#ffffff',
color: ['#37A2DA', '#32C5E9', '#67E0E3', '#91F2DE', '#FFDB5C', '#FF9F7F'],
series: [{
label: {
normal: {
fontSize: 14
}
},
type: 'pie',
center: ['50%', '50%'],
radius: [0, '60%'],
data: [{
value: 55,
name: '北京'
}, {
value: 20,
name: '武汉'
}, {
value: 10,
name: '杭州'
}, {
value: 20,
name: '广州'
}, {
value: 38,
name: '上海'
},
],
itemStyle: {
emphasis: {
shadowBlur: 10,
shadowOffsetX: 0,
shadowColor: 'rgba(0, 2, 2, 0.3)'
}
}
}]
};
chart.setOption(option);
return chart;
}
}
</script>
<style>
</style>
我基本方式照搬了Demo中的逻辑
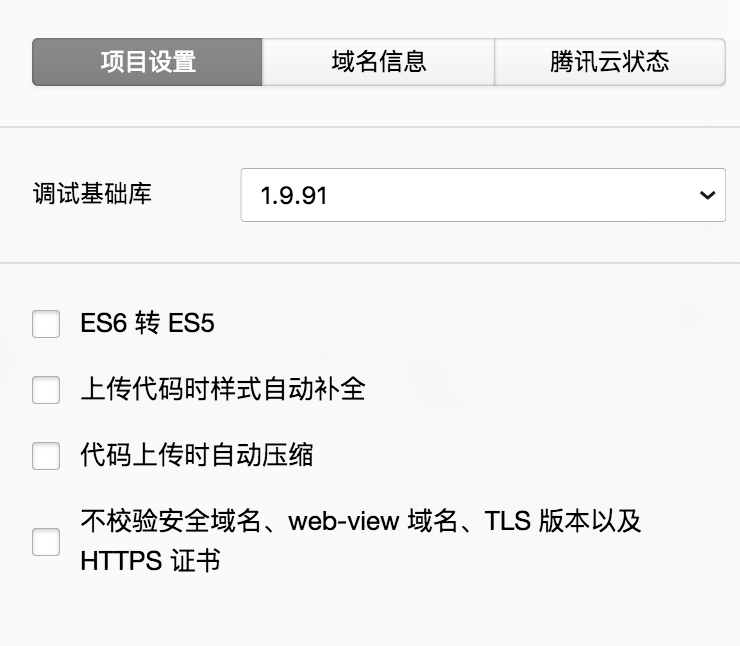
最后提一句在wepy 的项目中需要关闭es转化,如下图:
不知道是否会引起编译错误,还希望可以提供帮助,如果需要提供的信息,我会快速跟进的,万分感谢! : )
from echarts-for-weixin.
Gcaufy
commented on April 27, 2024
2
ECharts 组件是使用官方原生组件实现的,最简单的使用方法是将ECharts项目代码Copy至src目录下面,然后在config中加入usingComponents 引入组件。
当然,像楼上一样使用wepy.components 再包装一层也是可以的。
参考这里
Tencent/wepy#1010
from echarts-for-weixin.
 F-loat
commented on April 27, 2024
2
F-loat
commented on April 27, 2024
2
@checkmind 封装 mpvue 的 echarts 组件时,遇到了类似的问题,在 canvas 上加个 v-if ,然后延迟一定时间初始化就可以解决
from echarts-for-weixin.
Gcaufy
commented on April 27, 2024
2
@mikexfreeze 这个我有贴链接的 9d0c805
from echarts-for-weixin.
 Ovilia
commented on April 27, 2024
Ovilia
commented on April 27, 2024
我没用过 wepy,不过应该就是它怎么使用其他组件的就怎么使用 ECharts 组件吧。
有遇到问题的话,把具体的情况描述一下。
from echarts-for-weixin.
denty
commented on April 27, 2024
同问,目前引入会报错,因为wepy框架会重新编译一遍,echart.js文件,采用npm的方式引入 echart却报路径问题,待解答
from echarts-for-weixin.
Ovilia
commented on April 27, 2024
ECharts 文件大于 500k 应该跳过编译了。至于路径问题,具体是?
from echarts-for-weixin.
 LoserMr
commented on April 27, 2024
LoserMr
commented on April 27, 2024
利用组件的方式 重写ec-canvas其余和文档保持一致就行
from echarts-for-weixin.
denty
commented on April 27, 2024

使用的是ec-cavans中的chart.js文件,具体报错的代码如下:

from echarts-for-weixin.
denty
commented on April 27, 2024
我使用了wepy的框架,在我定制的图表文件下引入了ec-canvas文件夹下的文件,具体引入文件代码如下:
from echarts-for-weixin.
LoserMr
commented on April 27, 2024
重写ec-canvas.js 但貌似wepy下 组件下canvas动作属性貌似不能用
from echarts-for-weixin.
Ovilia
commented on April 27, 2024
import EcCanvas 不对吧?组件的引入方式是 ec-canvas 里 usingComponents。
我没用过 wepy,不太情况具体情况。那你知道 wepy 一般引入其他组件是怎么写的吗?
from echarts-for-weixin.
LoserMr
commented on April 27, 2024
http://blog.csdn.net/yaoxiewan6617/article/details/79420524
from echarts-for-weixin.
Ovilia
commented on April 27, 2024
你把项目文件打包压缩下,放在评论下,我跑一下吧
from echarts-for-weixin.
denty
commented on April 27, 2024
https://github.com/denty/test_wx_echarts 我将项目打包到了这个仓库下,clone后 需要 npm install 和 wepy build 命令 进行编译
from echarts-for-weixin.
 BernersH
commented on April 27, 2024
BernersH
commented on April 27, 2024

这里的initChart不要加括号 就可以了 @denty
from echarts-for-weixin.
 jiushiwoyuze
commented on April 27, 2024
jiushiwoyuze
commented on April 27, 2024
@checkmind ,写死在data中要如何实现在一个页面中加载多个图表呢?
from echarts-for-weixin.
qqqdu
commented on April 27, 2024
@jiushiwoyuze emmm~~,这个好像不行。我也尝试过,反正props怎么弄,canvas都显示不了。如果非要用eCharts的话,可以考虑多写几遍eCharts组件,每个组件不同的canvasId,(不过太不优雅了,我们项目最终没有用eCharts的原因也是这个,因为图比较简单,自己画掉了。
from echarts-for-weixin.
 LinkXSystem
commented on April 27, 2024
LinkXSystem
commented on April 27, 2024
在wepy中,你们是怎么解决echart打包之后过大的问题的
from echarts-for-weixin.
 HEYEggplant
commented on April 27, 2024
HEYEggplant
commented on April 27, 2024
Description
[问题描述:站在其它人的角度尽可能清晰地、简洁地把问题描述清楚]
[Description of the issue]
Environment
Platform: [开发者工具]
wepy version: [V1.7.1]
已查阅关于echarts issue 了解到关于引入echarts-for-weixin的两种方式
一.利用组件的方式 重写ec-canvas其余和文档保持一致
代码如下:
封装及重写ec-canvas
canvas-id="mychart-pie"
style="width: {{width}};height:{{height}};display:block;">
页面引入组件:
  @import '../styles/base.less';

  .capital-inflow__wrapper {
    padding: 30rpx;
    .title {
      font-size: 15px;
      color: #fff;
    }
  }
  canvas {
    width: 375px;
    height: 200px;
  }
</style>

<template>
  <view class="capital-inflow__wrapper">
    <ecCanvas :ec.sync="ec" height="200px"></ecCanvas>
  </view>
</template>

<script>
  import wepy from 'wepy'
  import ecCanvas from '../components/ecCanvas'
  import * as echarts from '../ec-canvas/echarts'

  function initChart(canvas, width, height) {
    const chart = echarts.init(canvas, null, {
      width: width,
      height: height
    })
    canvas.setChart(chart)
    const option = {
      grid: [{
        left: 10,
        right: 10,
        bottom: 10,
        top: 196
      }],
      xAxis: {
        data: ['酿酒行业', '家电行业', '保险', '医药制造', '软件服务'],
        axisLabel: {
          textStyle: {
            color: '#fff',
            fontSize: 11
          }
        },
        axisTick: {
          show: false
        },
        axisLine: {
          show: false
        }
      },
      yAxis: {
        type: 'value',
        show: !false,
        axisTick: {
          show: false
        },
        axisLine: {
          show: false
        },
        splitLine: {
          show: false
        }
      },
      series: {
        type: 'bar',
        data: [5, 4, 7, 5, 4],
        label: {
          itemStyle: {
            color: '#fff'
          }
        },
        barWidth: '70%'
      }
    }
    chart.setOption(option)
    return chart
  }

  export default class InfeiCapitalInflow extends wepy.component {
    config = {
    }
    components = {
      ecCanvas
    }
    data = {
      ec: {
        onInit: initChart
      }
    }
    props = {
    }
  }
</script>

出现问题 :
开发者工具中与真机测试表现不一致:
1:位置
 开发者工具中正常
 真机测试时,图表实例固定在页面 不随页面滚动
2:option 中的 grid 开发者工具中top不能按正常情况赋值 ,但真机测试应按正常情况赋值 ,即同样的位置参数 开发者工具和真机测试位置不一致(手机位置为正确位置)

二、通过usingComponents 方式引入 其余与文档一致
```<style lang="less">
</style>

<template>
  <view>
    <ec-canvas id="mychart-dom-bar" canvas-id="mychart-bar" ec="{{ec}}"></ec-canvas>
    <view>{{ec.onInit}}</view>
  </view>
</template>

<script>
  import wepy from 'wepy'
  import * as echarts from '../ec-canvas/echarts'

  export default class Test extends wepy.page {
    config = {
      'usingComponents': {
        'ec-canvas': '../ec-canvas/ec-canvas'
      }
    }
    data = {
      ec: {
        onInit: this.initChart
      }
    }
    initChart(canvas, width, height) {
      const chart = echarts.init(canvas, null, {
        width: width,
        height: height
      })
      canvas.setChart(chart)
      const option = {
        grid: [{
          left: 10,
          right: 10,
          bottom: 10,
          top: 196
        }],
        xAxis: {
          data: ['酿酒行业', '家电行业', '保险', '医药制造', '软件服务'],
          axisLabel: {
            textStyle: {
              color: '#fff',
              fontSize: 11
            }
          },
          axisTick: {
            show: false
          },
          axisLine: {
            show: false
          }
        },
        yAxis: {
          type: 'value',
          show: !false,
          axisTick: {
            show: false
          },
          axisLine: {
            show: false
          },
          splitLine: {
            show: false
          }
        },
        series: {
          type: 'bar',
          data: [5, 4, 7, 5, 4],
          label: {
            itemStyle: {
              color: '#fff'
            }
          },
          barWidth: '70%'
        }
      }
      chart.setOption(option)
      return chart
    }
  }
</script>
组件引入成功,查看页面元素有显示,但图标实例赋值不成功 即 函数initChart 不执行 ,排查原因为
<ec-canvas id="mychart-dom-bar" canvas-id="mychart-bar" ec="{{ec}}"></ec-canvas>
props ec 传值时 ec-canvas.js  获取的this.data.ec变成了 ec: {}  所以initChart执行不成功 图表没被渲染

望有成功引入的小伙伴查看下哪里出错了 谢谢
from echarts-for-weixin.
 mikexfreeze
commented on April 27, 2024
mikexfreeze
commented on April 27, 2024
@Gcaufy "推荐:使用 triggerEvent 修改ec-charts 源码,使用triggerEvent 去调用 init 事件" 这部分修改你已经写了吗?可以分享下吗?
from echarts-for-weixin.
 ahriyx
commented on April 27, 2024
ahriyx
commented on April 27, 2024

报错呢,一样的方法,一开始进去canvas默认是display:none的
from echarts-for-weixin.
ahriyx
commented on April 27, 2024
这个是根据封装的eccanvas.wpy
from echarts-for-weixin.
ahriyx
commented on April 27, 2024
有没有报这个错的啊
from echarts-for-weixin.
 Everytimeyumi
commented on April 27, 2024
Everytimeyumi
commented on April 27, 2024
求解 一步都走不动
from echarts-for-weixin.
 Hugo-Liang93
commented on April 27, 2024
Hugo-Liang93
commented on April 27, 2024
对于在使用wepy上canvasID不能动态绑定的问题,可以通过使用 slot 的方式,在插入位置的方式插入,不能显示的原因是wx.createCanvasContext(this.canvasId, this)在获取canvasID失败,这个不知道具体原因,可能是由于组件静态编译的缘故

from echarts-for-weixin.
 echo-ho
commented on April 27, 2024
echo-ho
commented on April 27, 2024
我使用了wepy的框架,在我定制的图表文件下引入了ec-canvas文件夹下的文件,具体引入文件代码如下:
请问是需要下载吗?官方教程中的下载似乎并不适用
from echarts-for-weixin.
Related Issues (20)
- 小程序使用series-custom renderItem报错
- 小程序横屏现在支持了吗?
- 微信小程序 echarts tooltip设置extraCssText不生效
- 热力图数据量太大导致tootip失效
- 热力图数据量太大3万条以上点击显示tootip失效
- 结合echarts使用
- 微信小程序的tooltips卡顿问题有解决吗? HOT 2
- 柱形图和折线图,不能支持自定义样式
- 用import * as echarts from '../../../ec-canvas/ec-canvas';在js引入会报错APP-SERVICE-Engine:Please do not register multiple Pages in
- 使用markline中的coord控制台会报Cannot read property 'coord' of undefined,并且无法正常显示markline HOT 2
- 最新的官方版本支持了tooltip吗? HOT 2
- TypeError: Image is not a constructor HOT 1
- 有支持 Skyline 模式的计划吗?目前有点小问题 HOT 2
- 两个页面的echarts,一个页面滑动跳转到另一个页面,这个页面的echarts也跟着动到了上个页面echarts滑动到的位置
- 我想用旧版本的该怎么办
- series折线图 symbolSize的样式不正常 HOT 1
- 加上小程序"miniprogramRoot": "miniprogram/",就无法正常绘制图表了
- 这个改成uniapp版的微信小程序可以么 vue3的 HOT 1
- 小程序中使用PictorialBar象形柱图,普通写法和懒加载,ios系统都会闪退,安卓系统不会闪退
- 能否提供ts支持?
Recommend Projects
-
 React
React
A declarative, efficient, and flexible JavaScript library for building user interfaces.
-
Vue.js
🖖 Vue.js is a progressive, incrementally-adoptable JavaScript framework for building UI on the web.
-
 Typescript
TypeScript is a superset of JavaScript that compiles to clean JavaScript output.
-
TensorFlow
An Open Source Machine Learning Framework for Everyone
-
Django
The Web framework for perfectionists with deadlines.
-
 Laravel
A PHP framework for web artisans
-
D3
Bring data to life with SVG, Canvas and HTML. 📊📈🎉
-
Recommend Topics
-
javascript
JavaScript (JS) is a lightweight interpreted programming language with first-class functions.
-
web
Some thing interesting about web. New door for the world.
-
server
A server is a program made to process requests and deliver data to clients.
-
Machine learning
Machine learning is a way of modeling and interpreting data that allows a piece of software to respond intelligently.
-
Visualization
Some thing interesting about visualization, use data art
-
Game
Some thing interesting about game, make everyone happy.
Recommend Org
-
Facebook
We are working to build community through open source technology. NB: members must have two-factor auth.
-
Microsoft
Open source projects and samples from Microsoft.
-
Google
Google ❤️ Open Source for everyone.
-
Alibaba
Alibaba Open Source for everyone
-
D3
Data-Driven Documents codes.
-
Tencent
China tencent open source team.
from echarts-for-weixin.